Sheila, Georgia
Last week Sheila posted some times where she increased the RF9 modulation depth, and decreased the DARM offset, increasing the coupling of RF9 RIN to DARM.
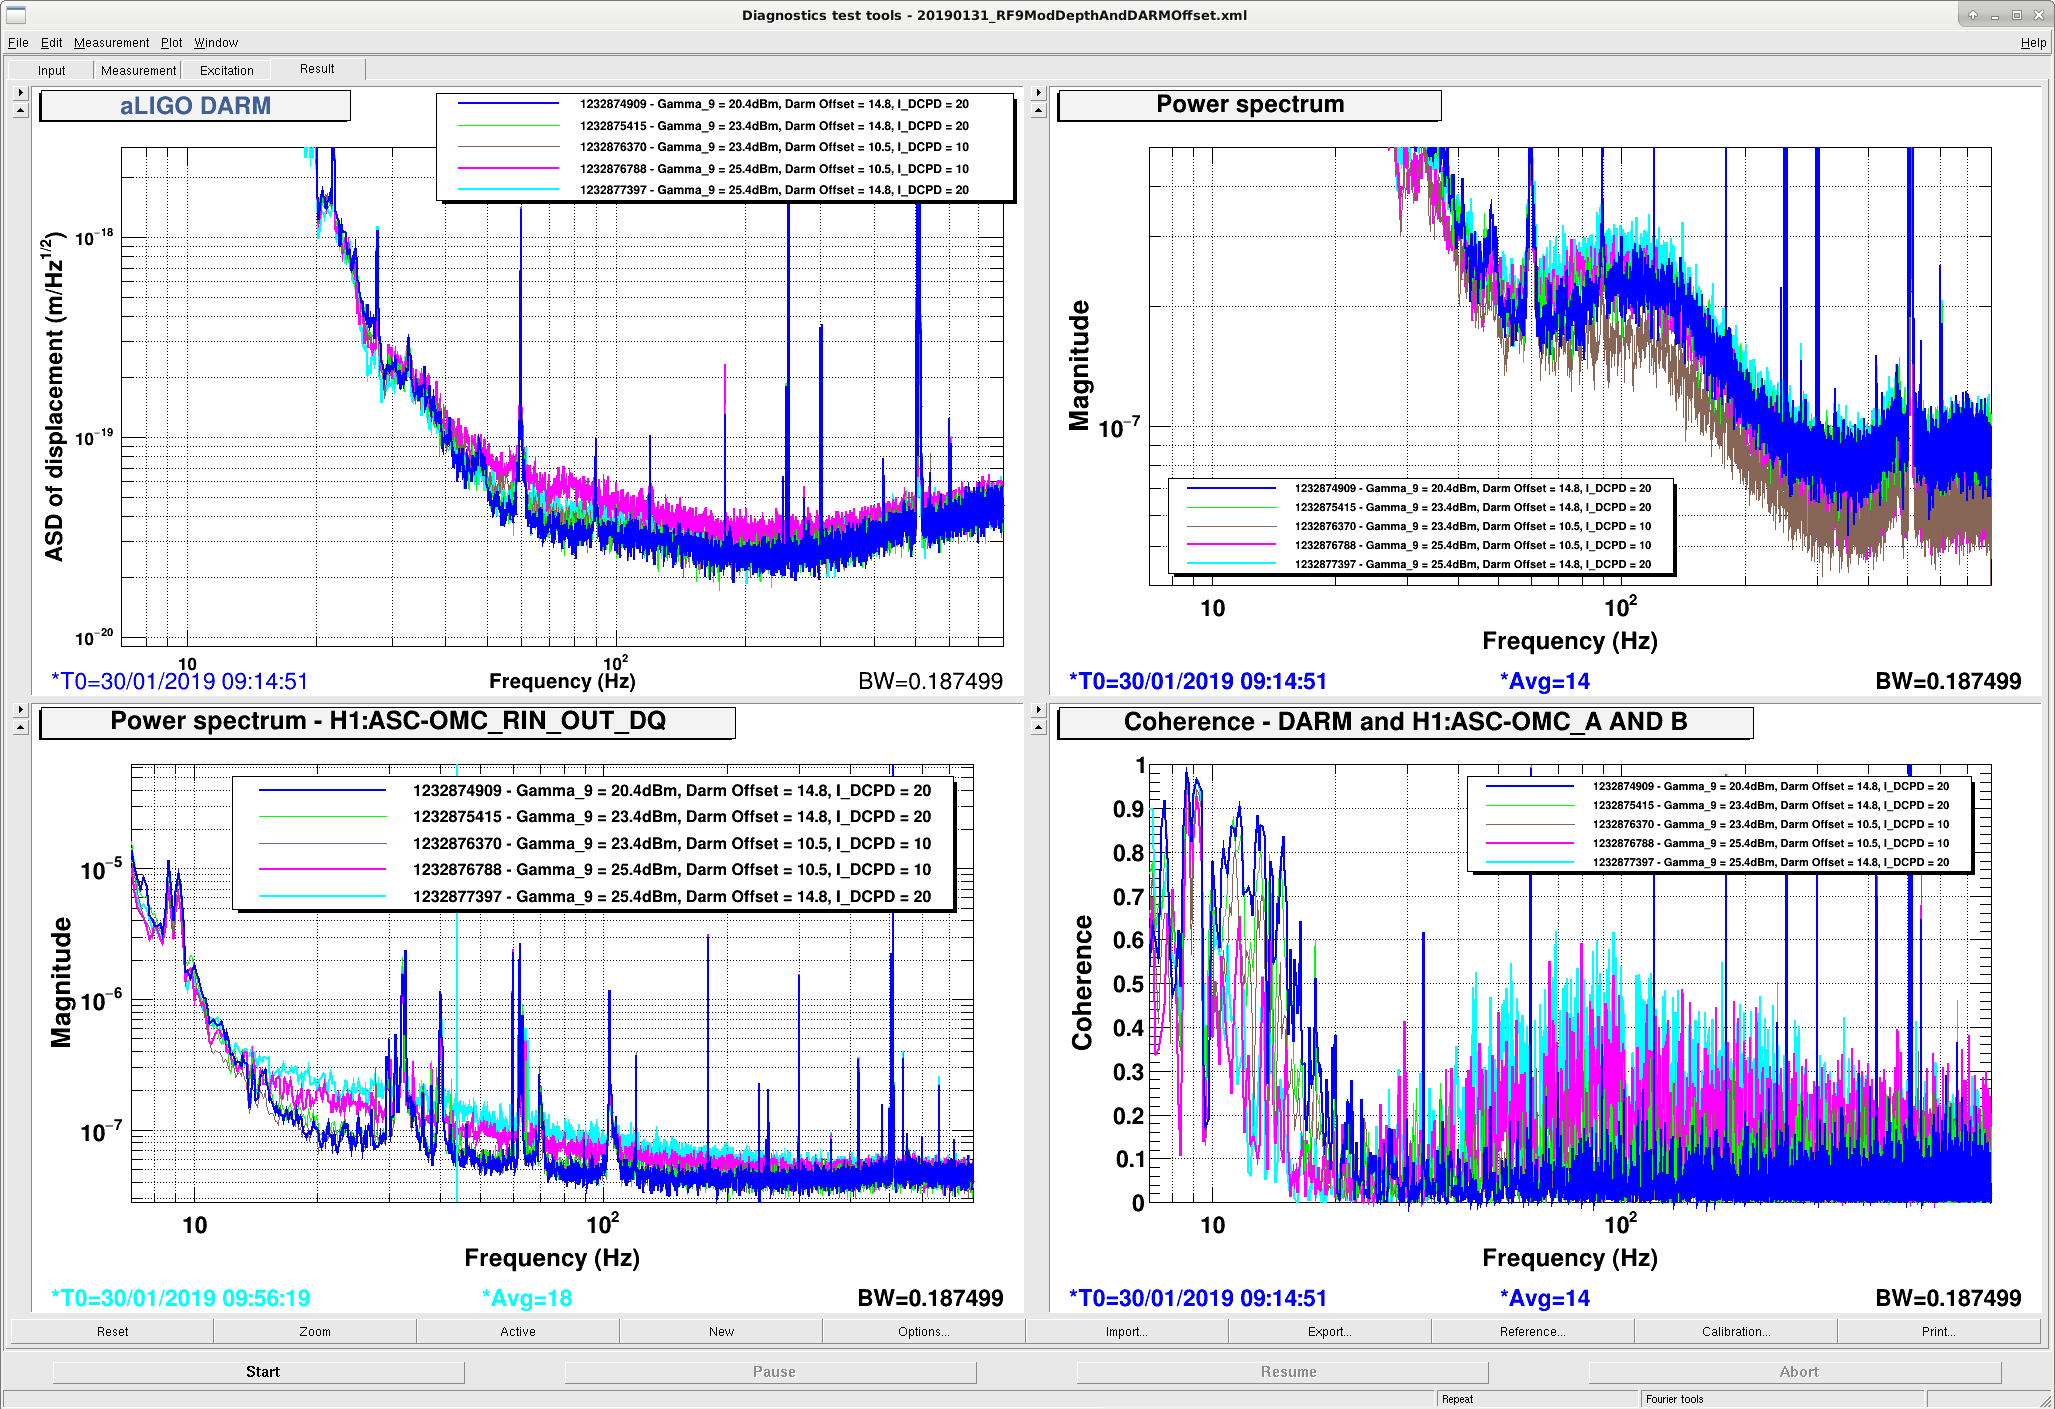
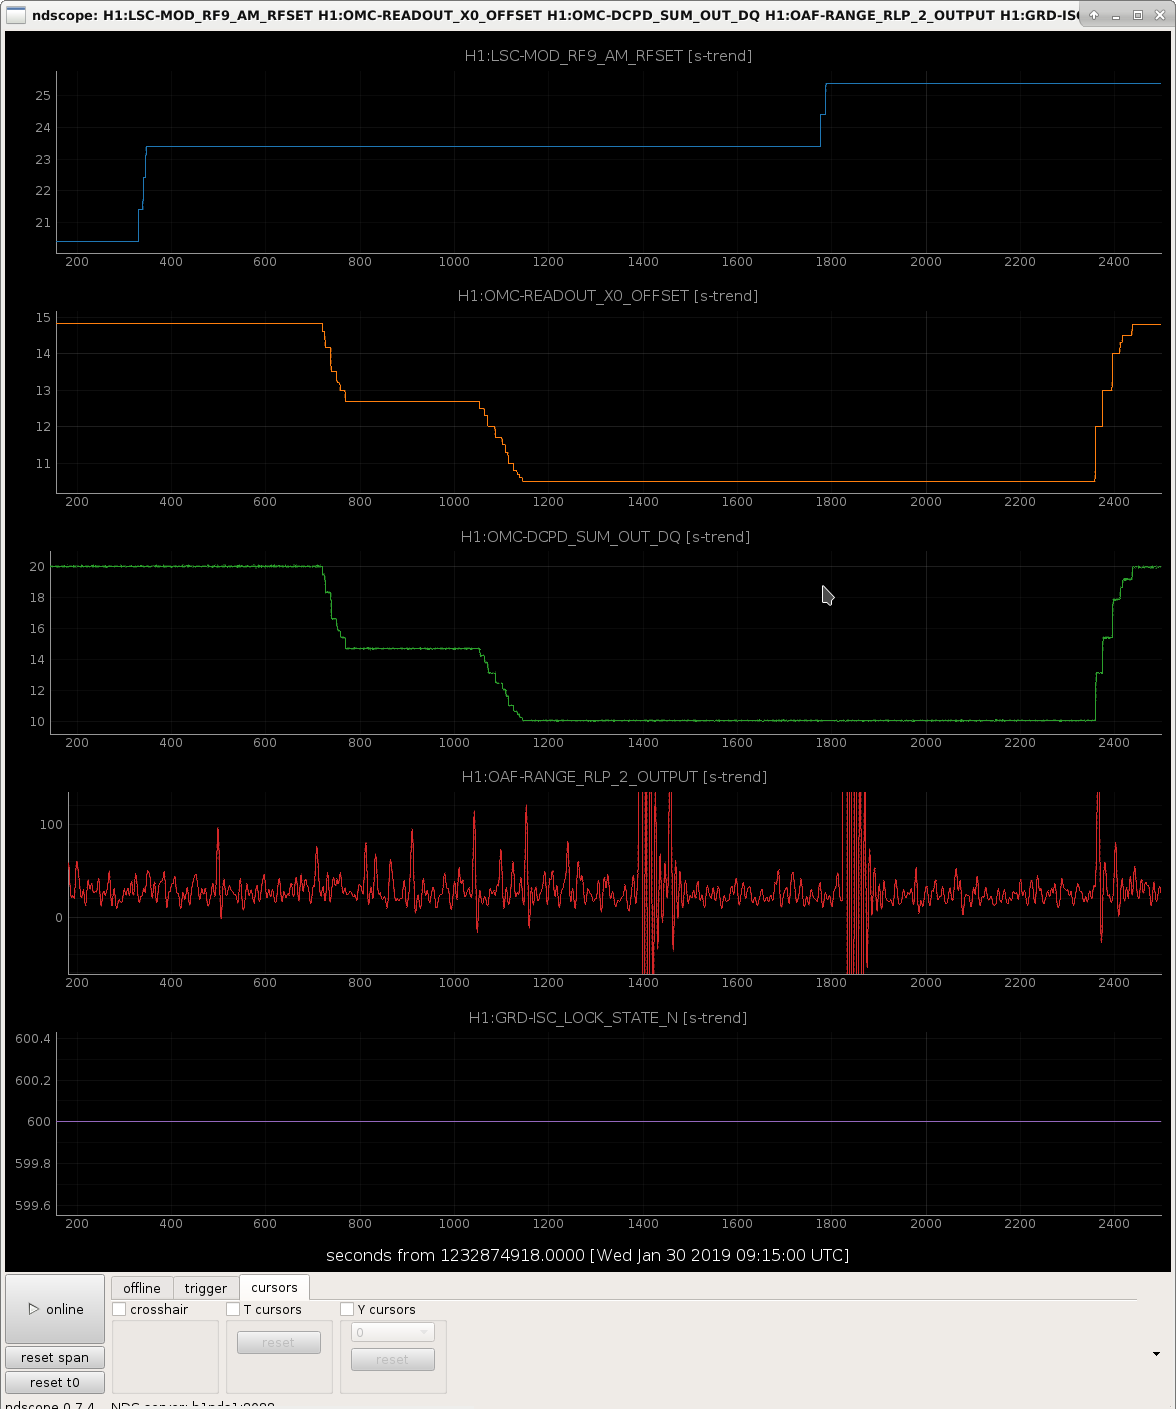
I had a look back at these times, and recorded the DARM spectrum, OMC QPD RIN, and coherence between the QPD RIN and DARM, as well as the DCPD sum channel. First attachment shows these spectra. Note the QPD RIN channel is a new addition which is the sum of the RINs of the two QPDs on the OMC breadboard. The second attachment is just the time series of the modulation depth (dBm), DARM offset, OMC DCPD sum, and the 20-29Hz DARM BLRMS so I can avoid glitchy times.
Things to note from figure 1:
When we first increased the modulation depth from 20 to 23 dBm there is no difference in DARM or the DARM coupling (compare blue and green traces)
When we reduce the DARM offset so that there is 10 mA on the DCPDs (compared to the usual 20 mA), there is still no increased coupling to DARM (brown trace), we see a reduction of noise in the DCPD spectrum which makes sense. There's no change in the QPD RIN. At 20 dBm modulation depth the relative contributions to the RIN are as reported in alog 46490. When we increase the modulation depth, these relative contributions change.
When we further increase the modulation depth to 25.4 dBm (fuchsia trace) we see a broadband increase in the QPD RIN and in DARM (but a decrease in the DCPD spectrum?). Note though that there might be a problem with saturations in the EOM when we increase the modulation depth above 24 dBm.
When we increase the DARM offset back to 20 mA (cyan trace), with this new high modulation depth, the DARM noise decreases (makes sense, less RF9 contribution at higher DARM offset), but the QPD RIN increases, as does the coherence between the QPD RIN and DARM.
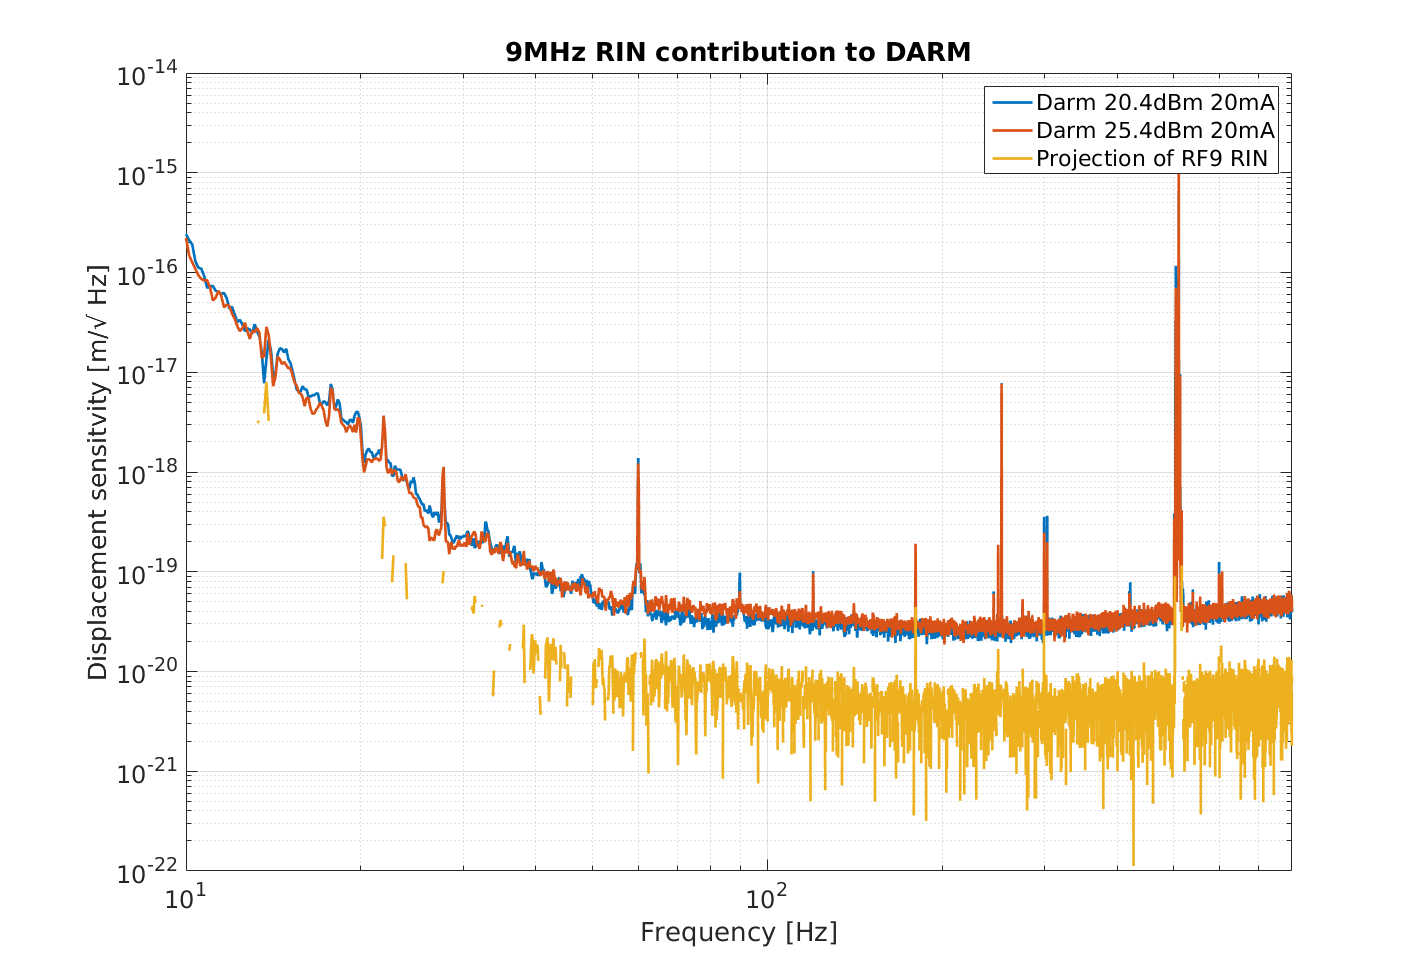
Assuming there's nothing strange going on when we increase the modulation depth by 5dB, we can use this data to make a noise projection. Third attachment shows an attempt at this. We did a quadrature subtraction of the normal (low modulation depth) DARM spectrum from DARM with the increased modulation depth, and then scaled this by the 5dB modulation depth change, which gives the yellow trace.