TJ, TVo, Danny
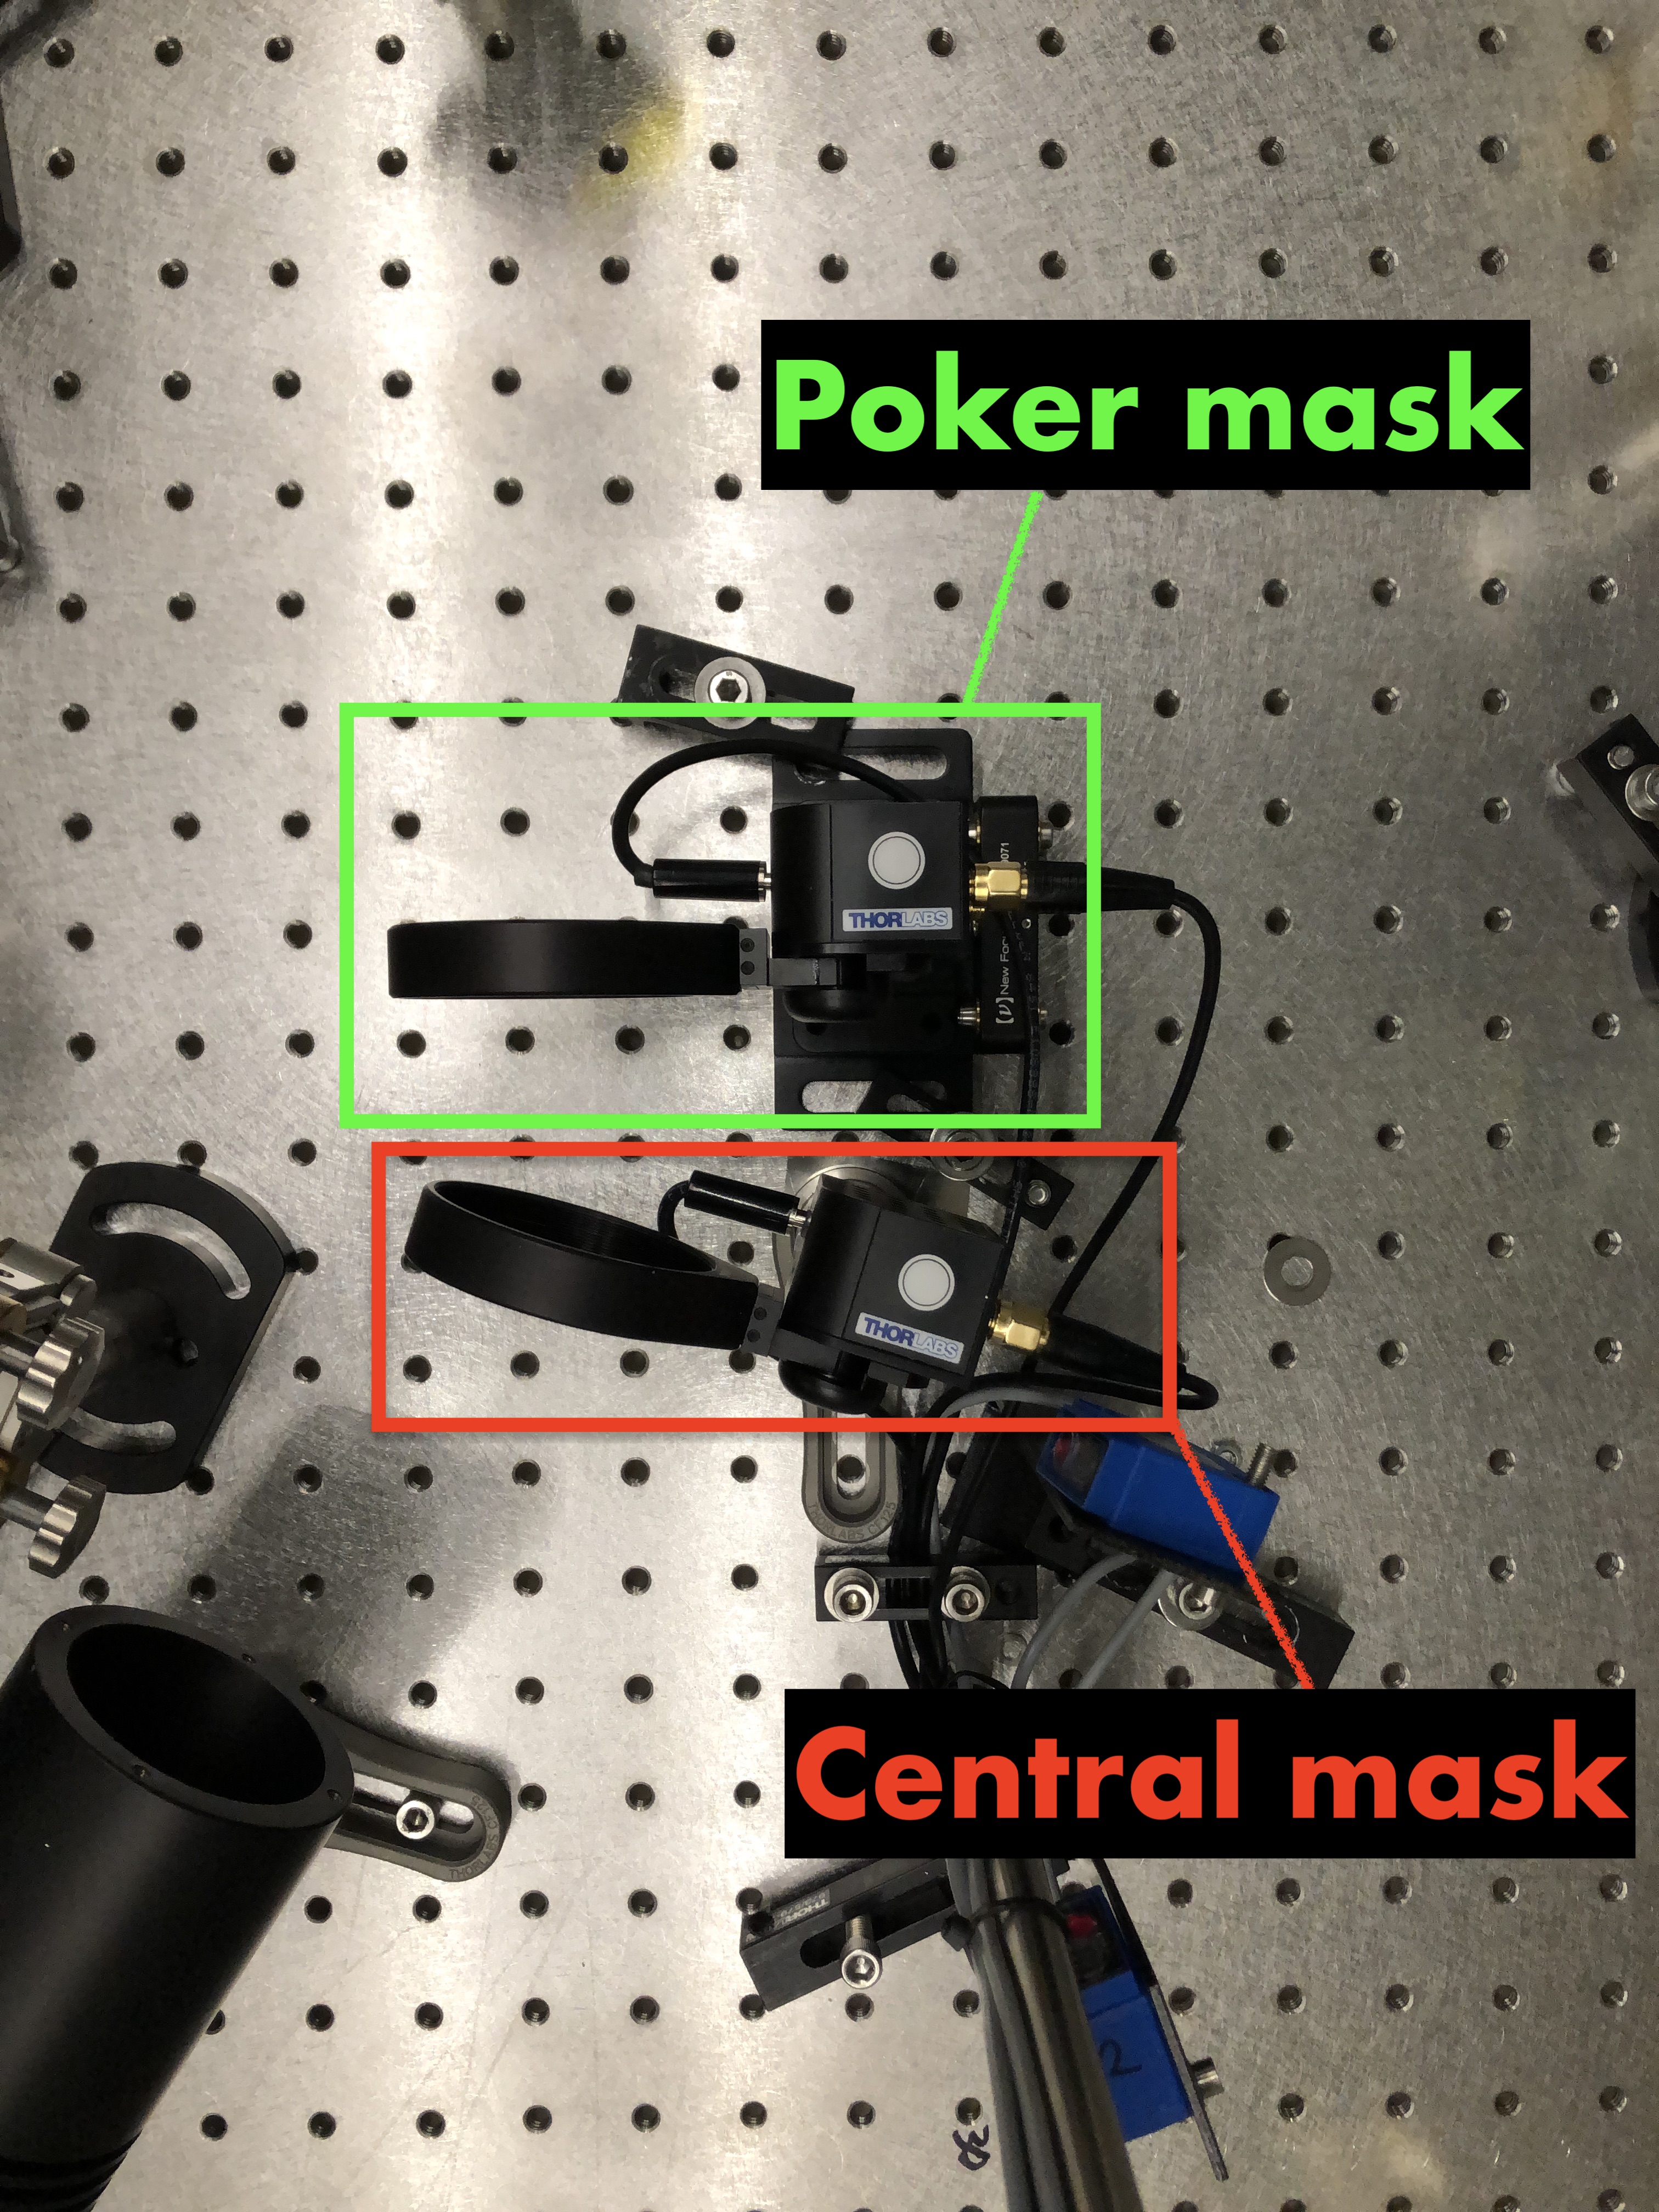
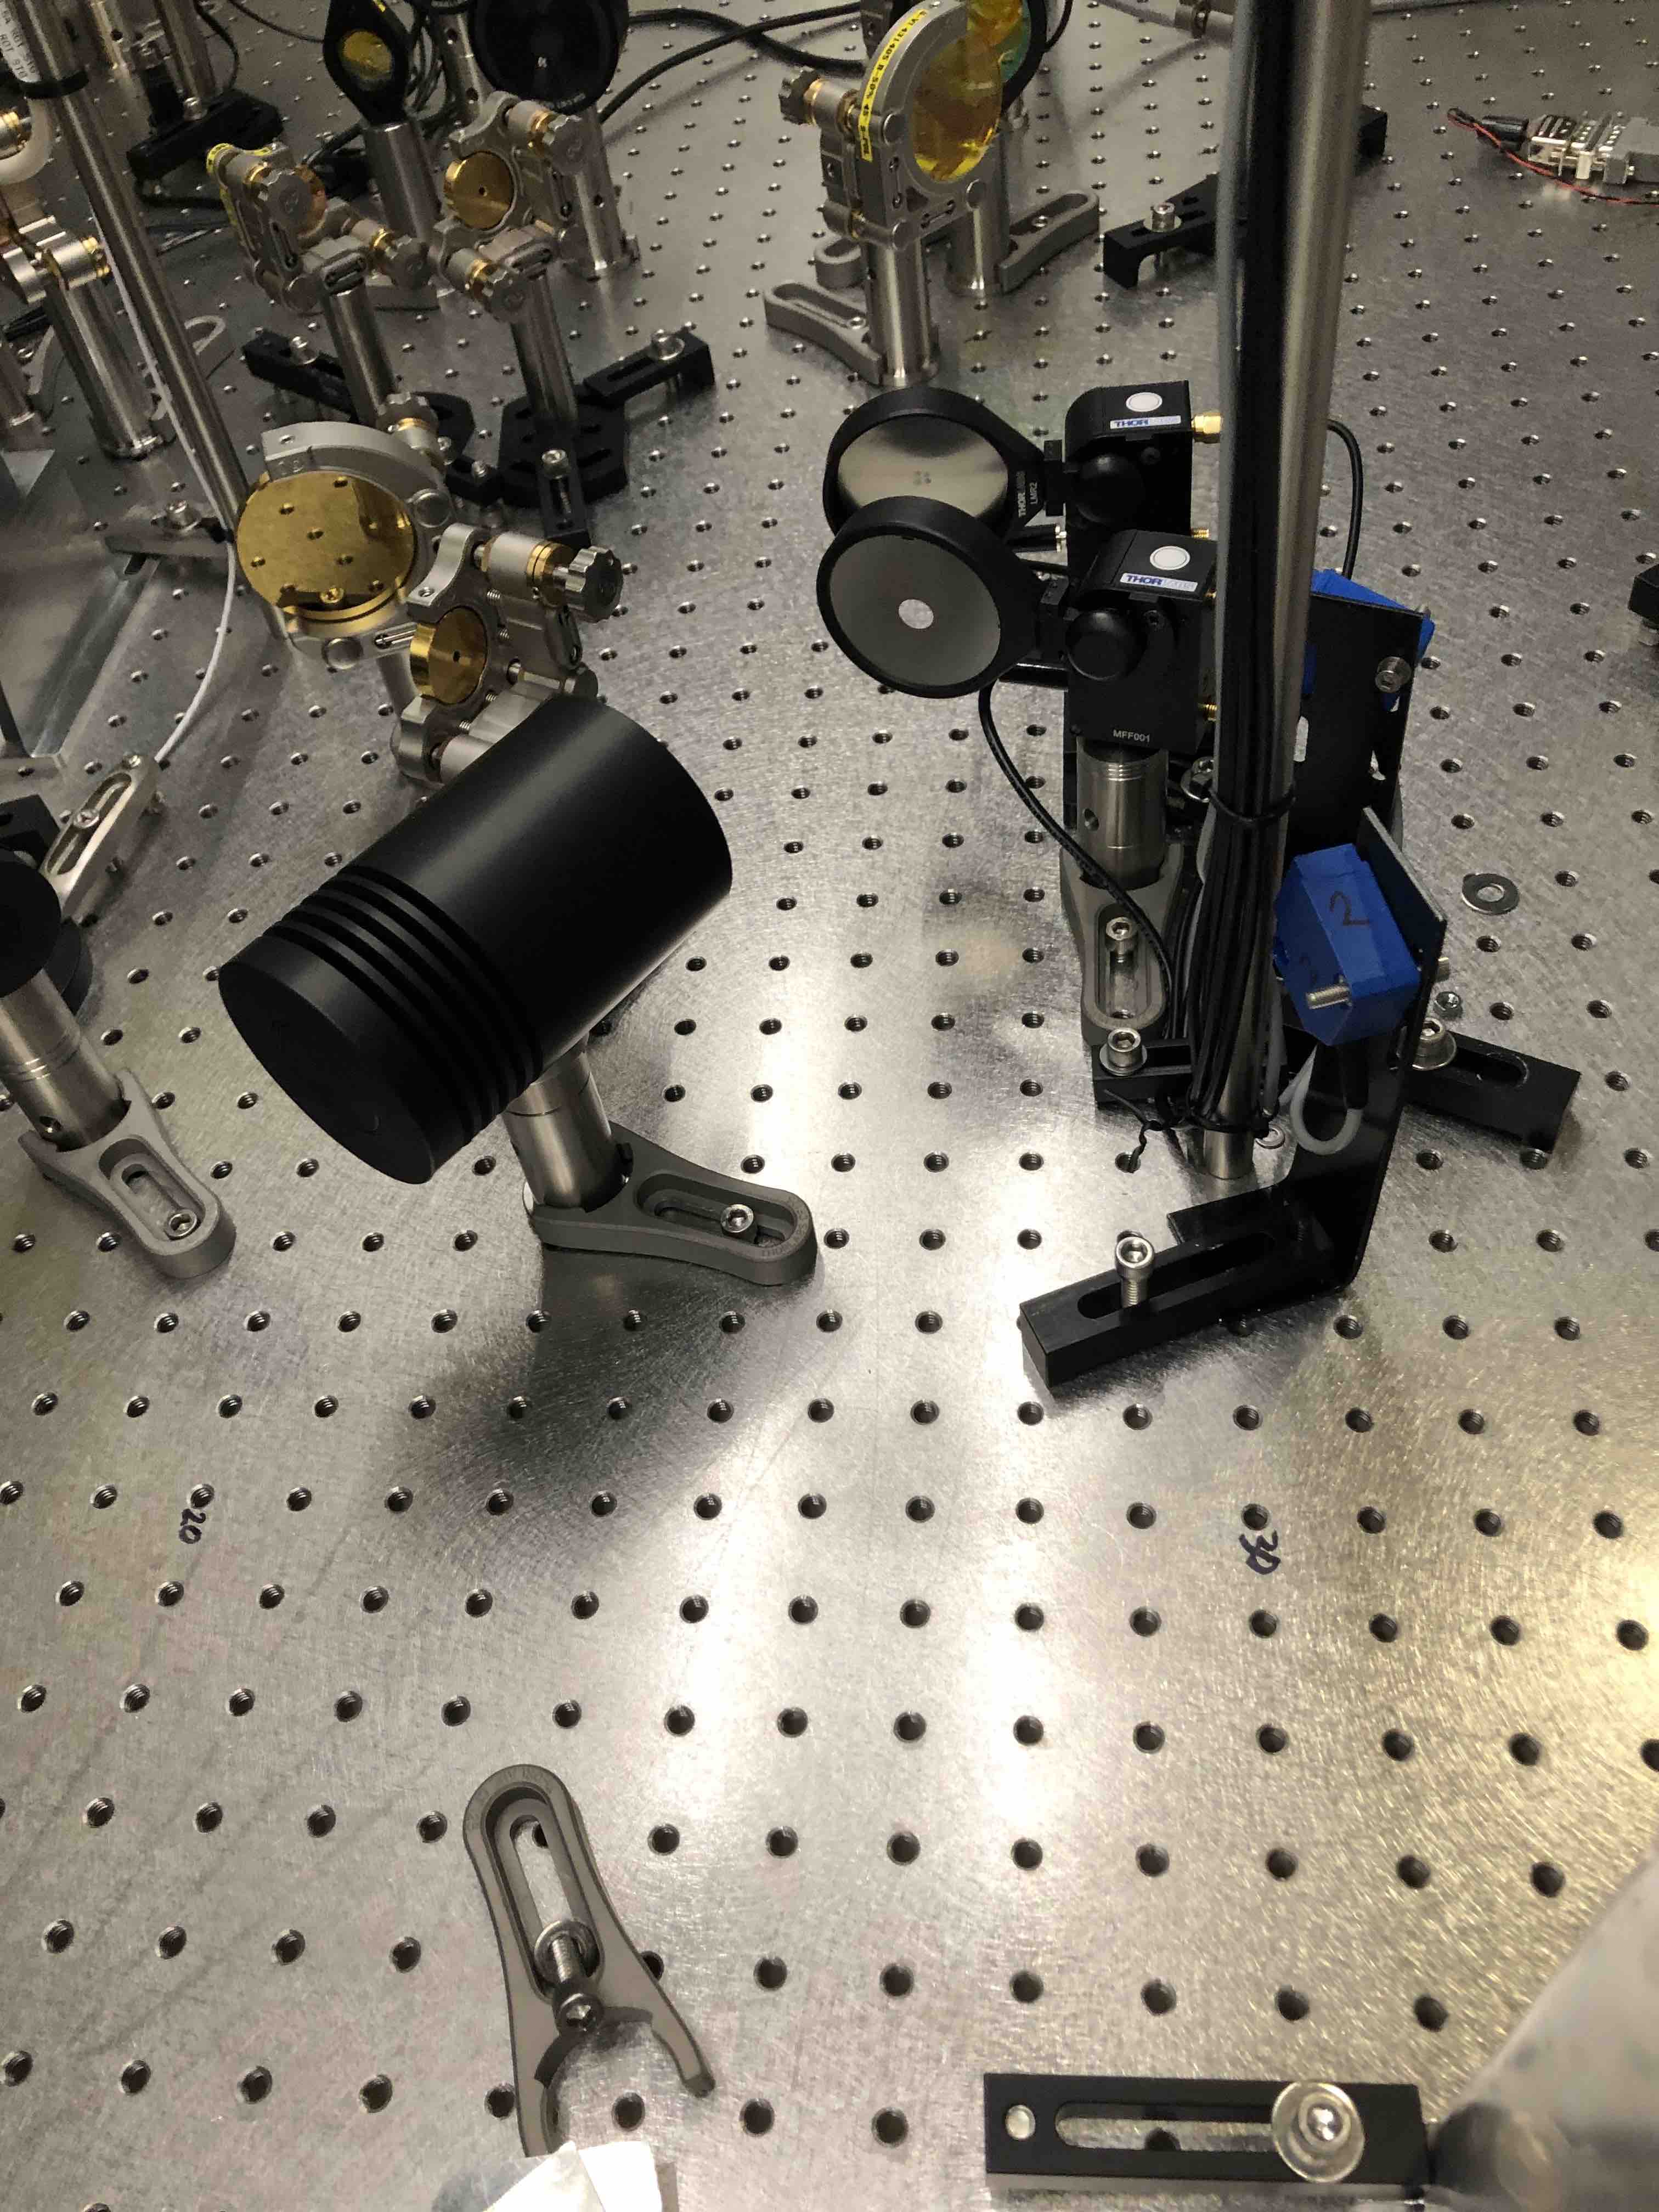
- Before today, we placed the translation stage with the poker mask approximately where the annular mask was once placed.
- Before proceeding with fine adjustments to the orientation mask we went through some initial checks as suggested in DCC T1900047.
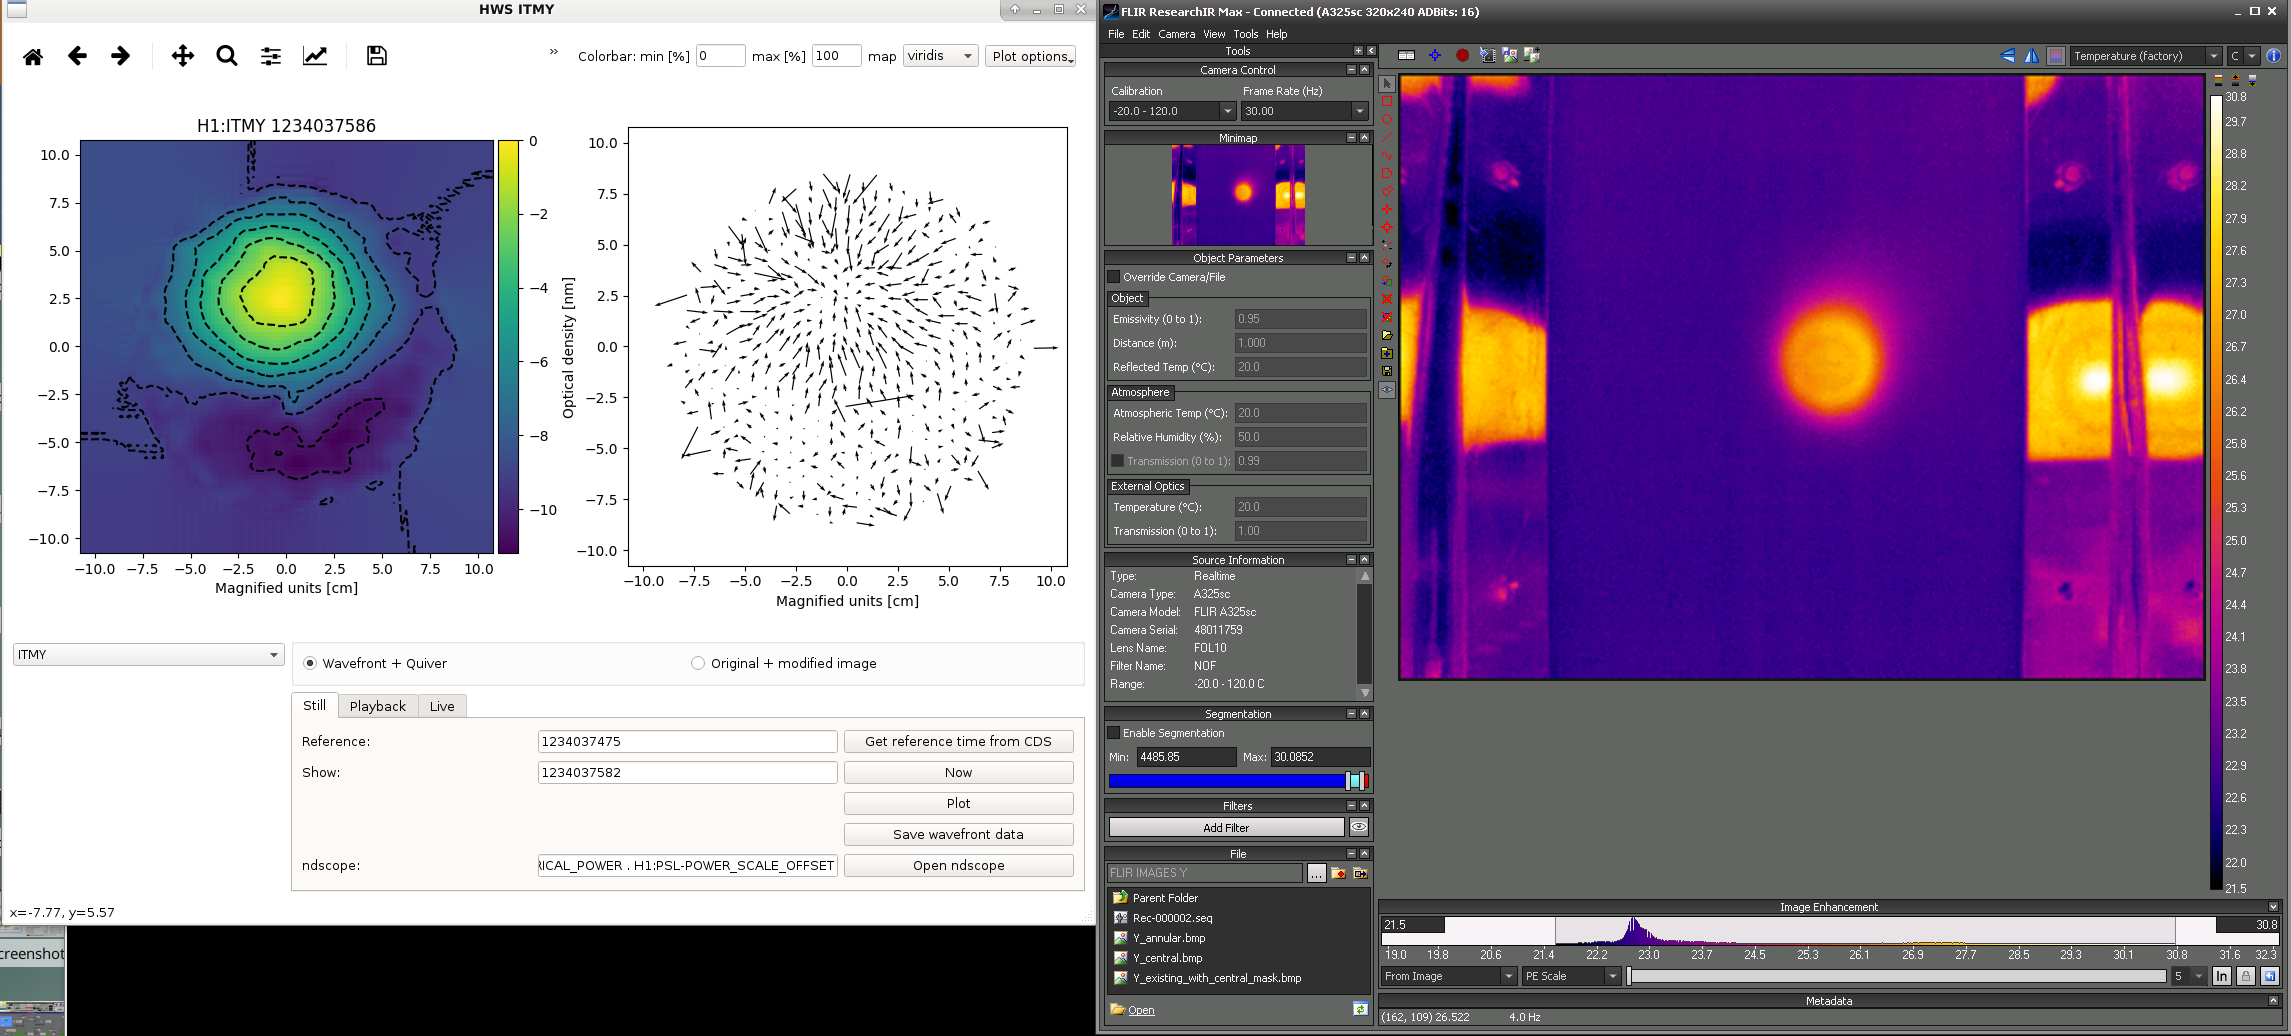
- Using a 3mm diameter aperture placed behind the central mask, we established how the center of the CO2Y beam on the FLIR camera correlates to the location and size of the optical path distortion on the ITMY HWS (please see first attached image). It suggests that the measured CO2 optical path distortion (OPD) we are seeing is ~25 mm off center in the vertical direction and <10mm off center in the horizontal direction. The 3mm diameter aperture correlates to a related OPD 100 mm in diameter (it's elliptical because the beam was entering the aperture at an angle).
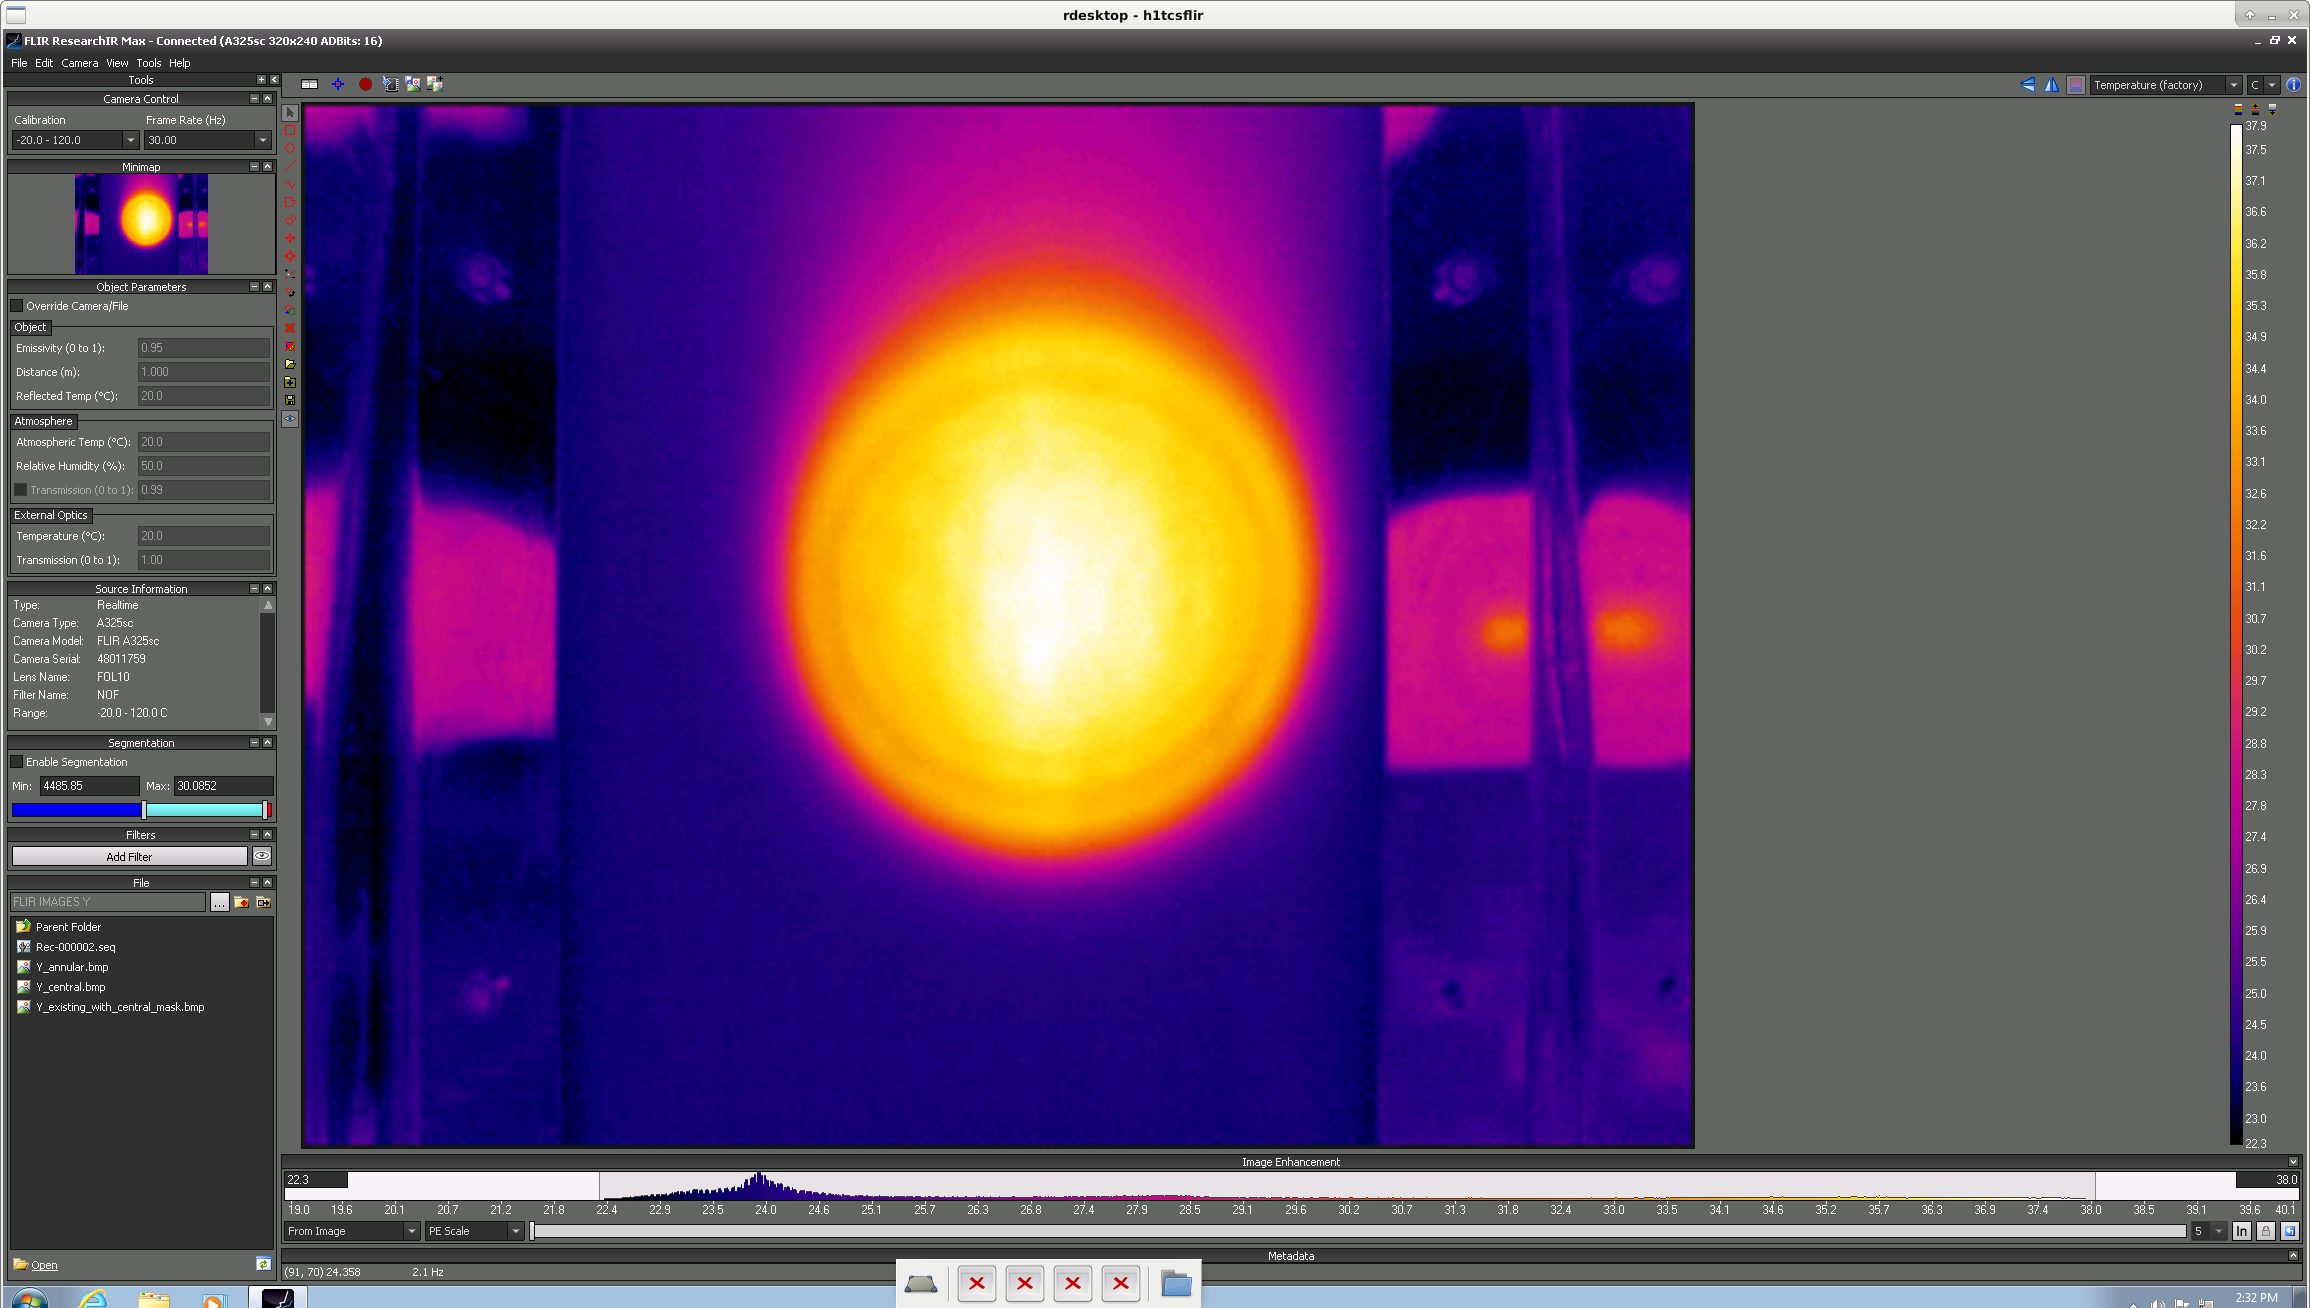
- The second attached image shows the FLIR camera image with only the central mask in the beam path
- Poker mask alignment:
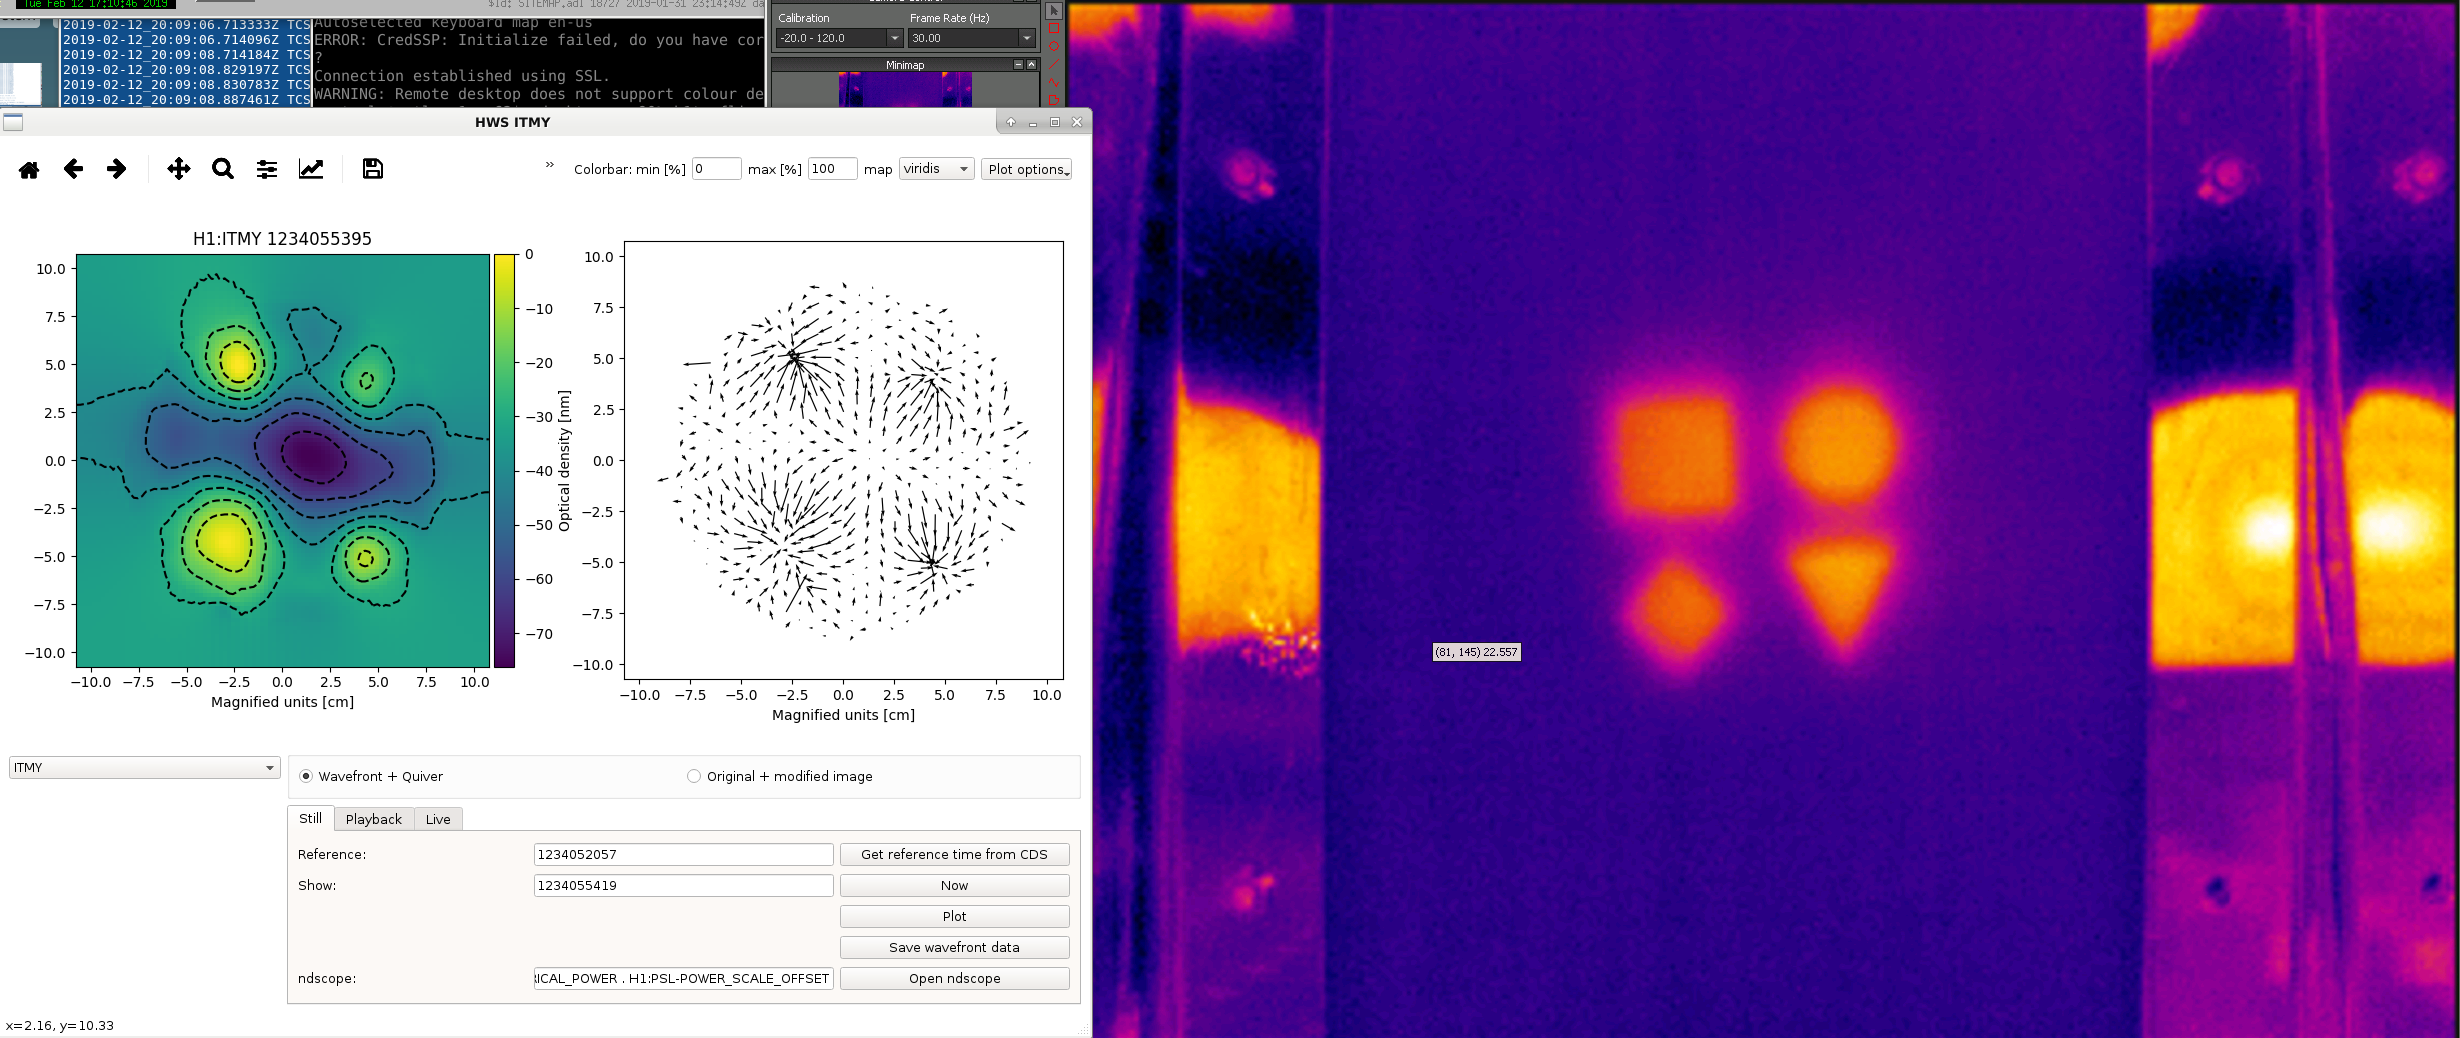
- The poker mask has 4 unique geometrical shapes intended to act as a guide when attempting to understand how the HWS probe beam will measure the correlated OPD from the CO2 passing through the mask onto the compensation plage.
- The goal was to get this poker mask centered on the HWS and get a better understanding of how the shapes are seen by the HWS so we can install the point absorber mask as intended.
- The third attached image shows the best centering achieved today.
- It was not obvious to TJ and myself which shapes were which from the gradient plot.
- We may not be seeing the entirety of the shapes on the HWS which may require us to do some translating of the mask along the beam path. This is to make sure these shapes are inscribed within the projected HWS beam on the compensation plate which will be required before installing the point absorber mask.
- While aligning the mask we developed a table describing how the movements of the mask correlated to the movement on the FLIR camera and movement of the measured OPD on the HWS:
-
Poker mask FLIR HWS Up Down Right Left Left Down Down Up Left Right Right Up
-
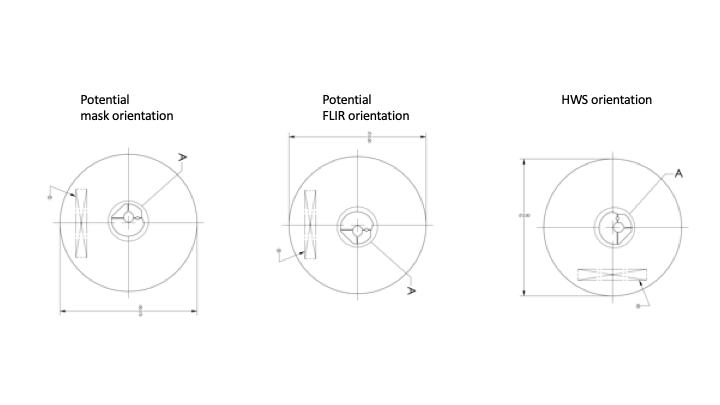
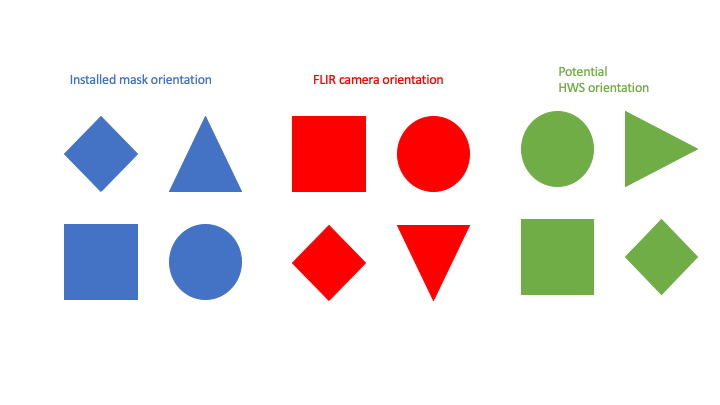
- The fourth attached image shows our best estimate of how the HWS may be seeing the distortion from the poker mask-filtered CO2 on the compensation plate given the information in the table as well as the orientation of the installed mask.
- If this HWS orientation is correct, we would want to install the mask as shown on the left in the fifth attached image.

I had a look at the data from yesterday. I had expected to see features as sharp as previously measured: 14714 (and reproduced here). The reality is a lot more thermal diffusion of the features over the time-scale of the measurement. Using a shorter time-scale turns out not to work because the SNR of the HWS isn't large enough on the scale of the measurement
There are two possible fixes to this:
- Increase the incident power on the mask (and hence onto the optic). This will increase the signal strength and allow measurements over a shorter time-scale
- Obscure one of the two smaller apertures to create an L-shape on the optic.

Ideally, we'd compare HWS measurements after one or two minutes rather than 60 to see the poker mask.
I tried adding the poker heat load map to a compensation plate in COMSOL to see what the induced optical depth change might be like. First plot shows the steady state solution for OPD, second the heat map I applied to the surface, scaling of OPD will be way off as I just guessed intensities. In order of OPD depth you'd probably see on the HWS largest to smallest: square, circle, triangle, diamond. So looks like your fourth plot is probably correct!


I overlaid the FLIR images of the central heating iris and the poker card. Then I found the center of the heat pattern and thermal lens of the central heating and circled that heat distribution and thermal lens on the poker card images. The upper left of the thermal lens image corresponds to the upper right of the FLIR image. Coupled with the large thermal lens in the lower left of the thermal lens image, this supports the hypothesis that the HWS image is the FLIR image rotated by 90 degrees counter-clockwise.

Correction on the fifth figure attached to this log post: The FLIR orientation and the mask orientation should be switched. Attached is a png with the correct orientations.