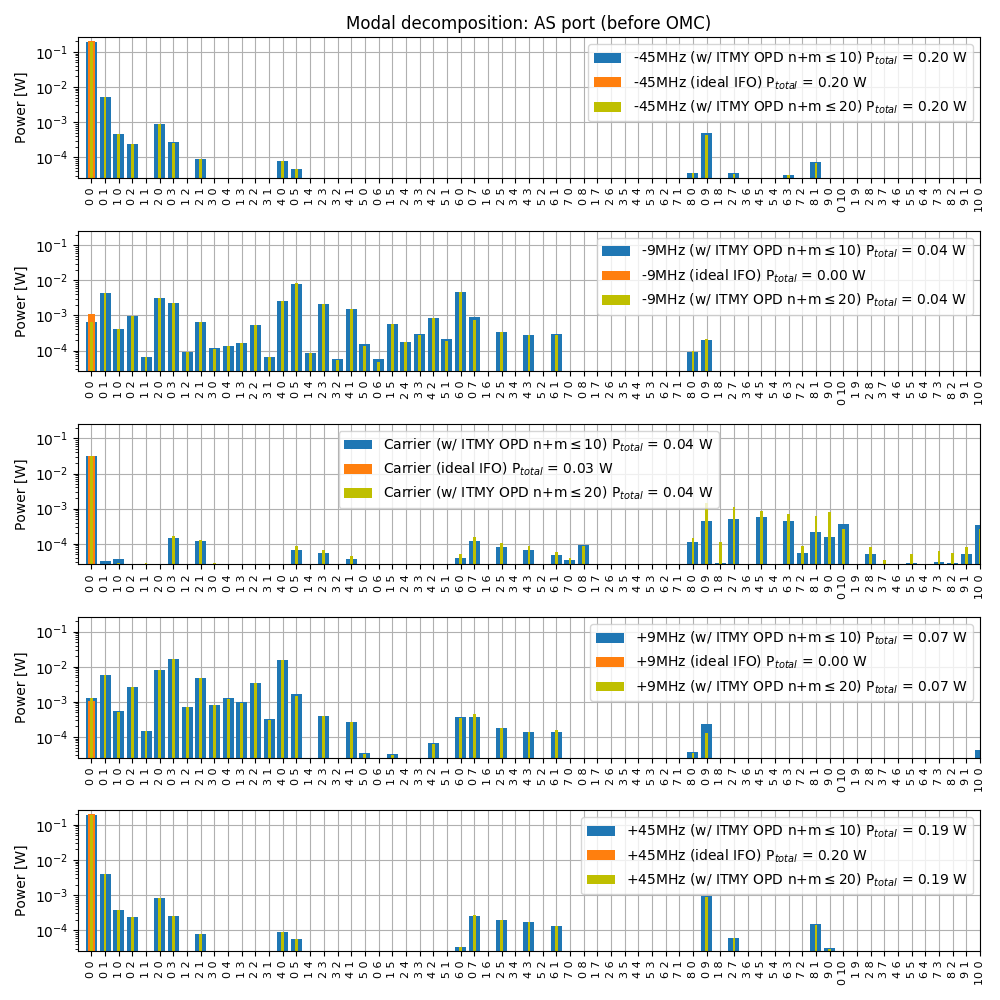
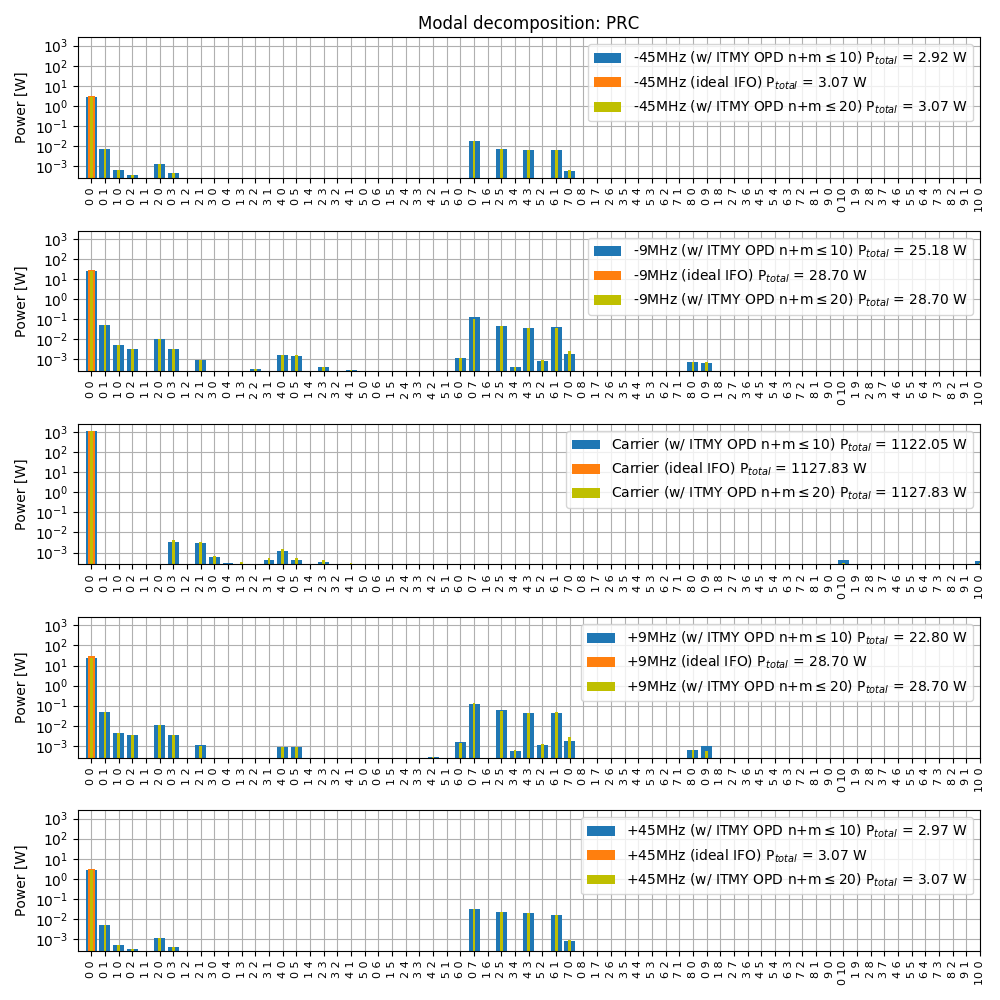
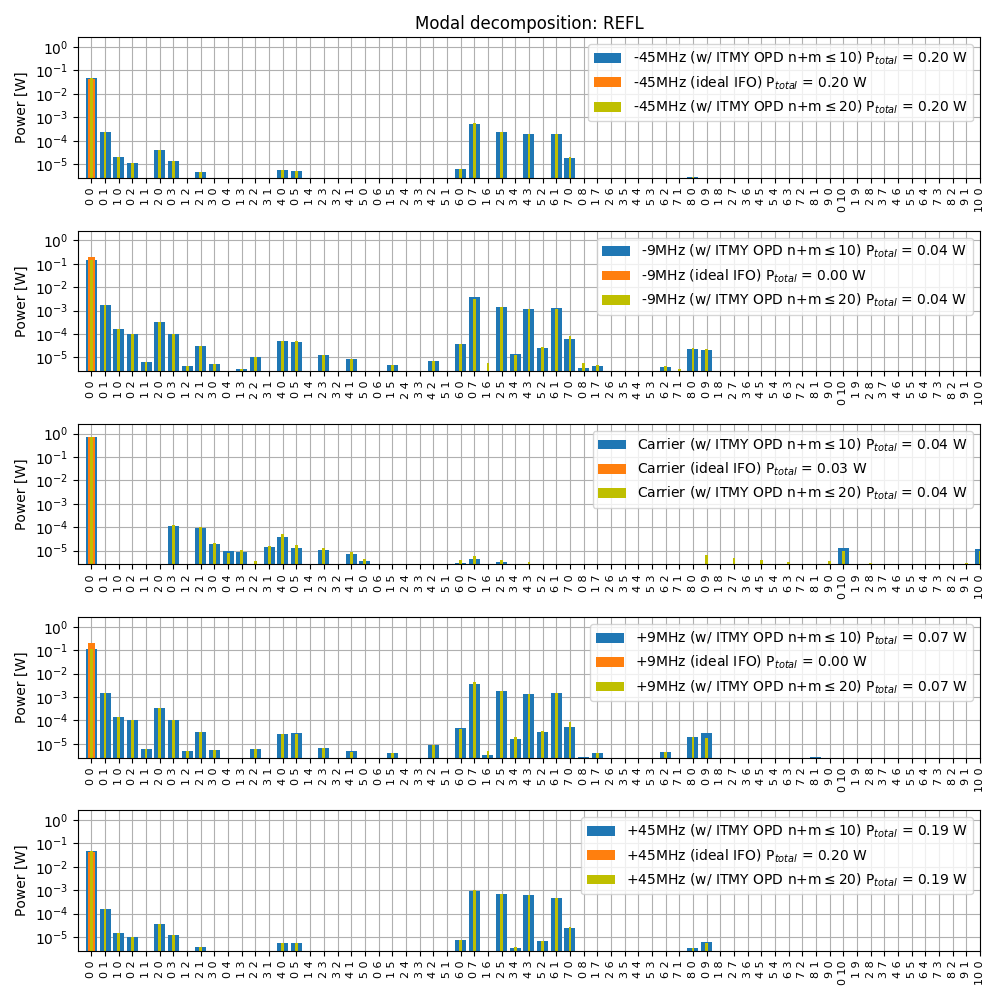
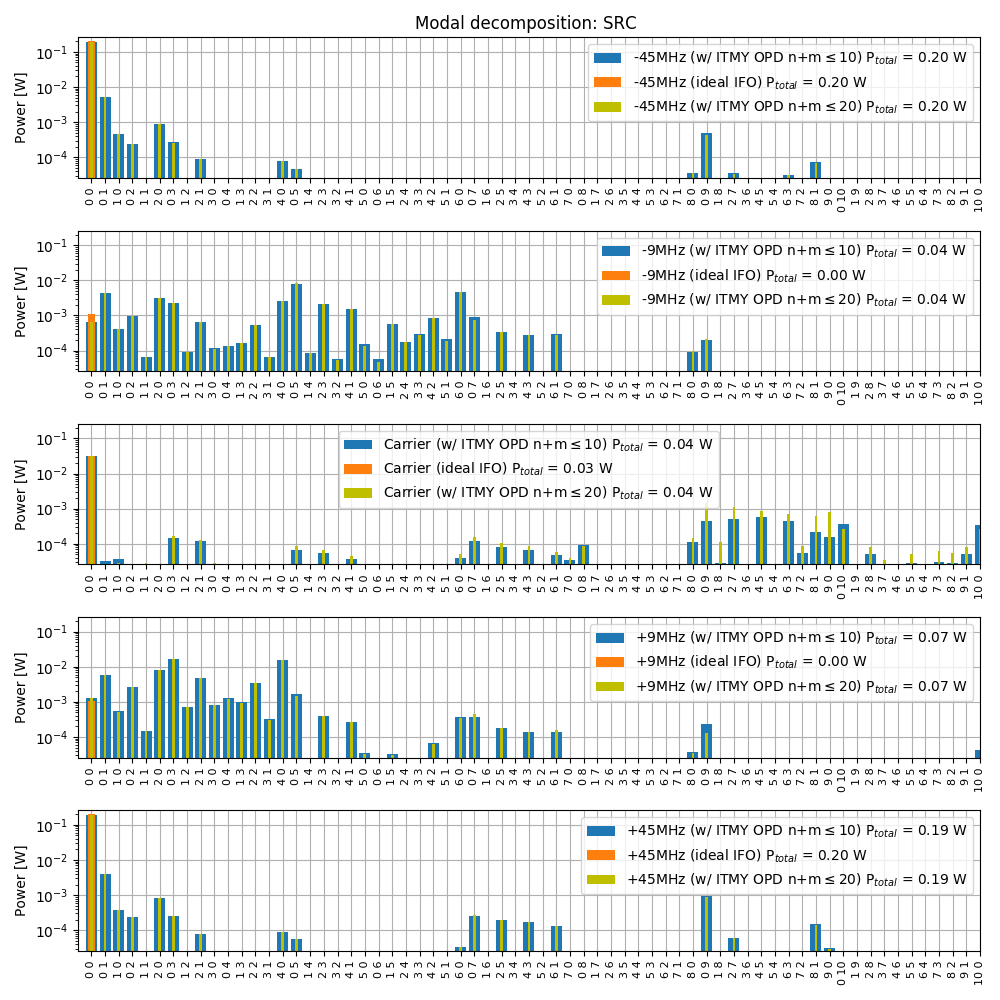
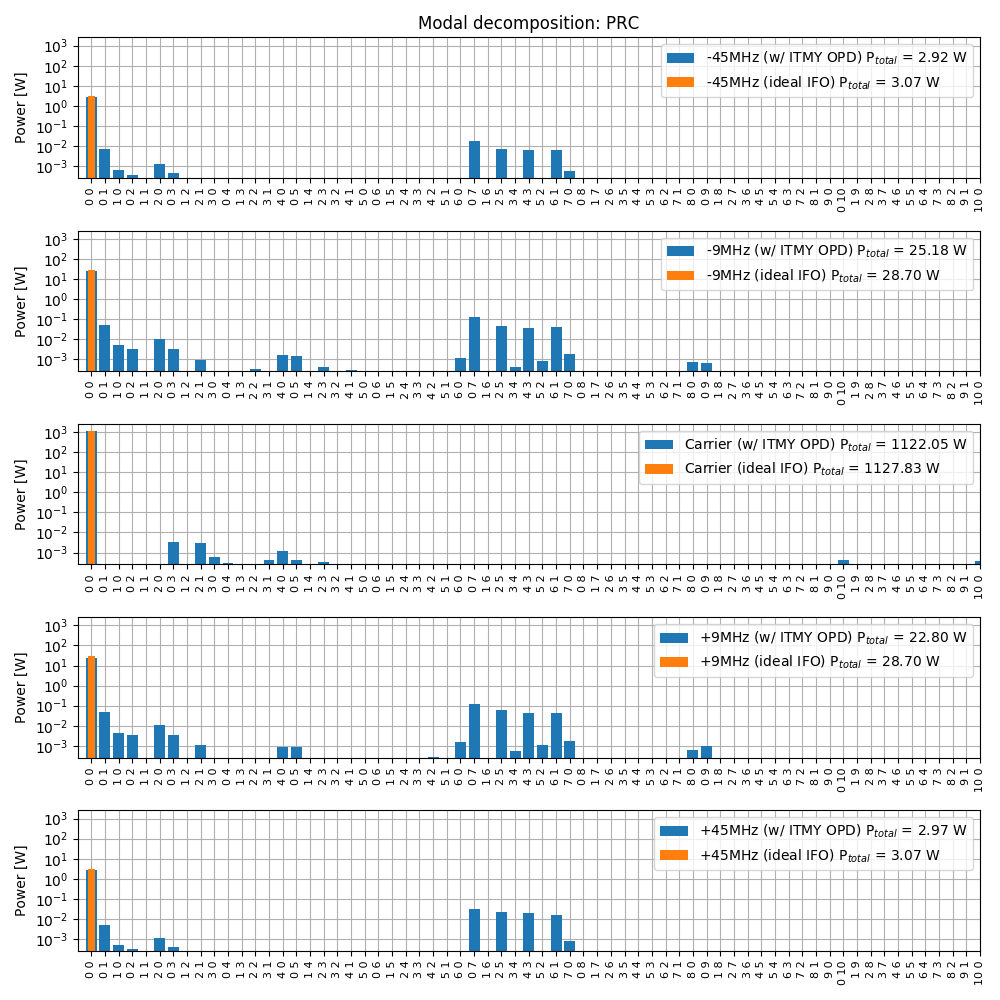
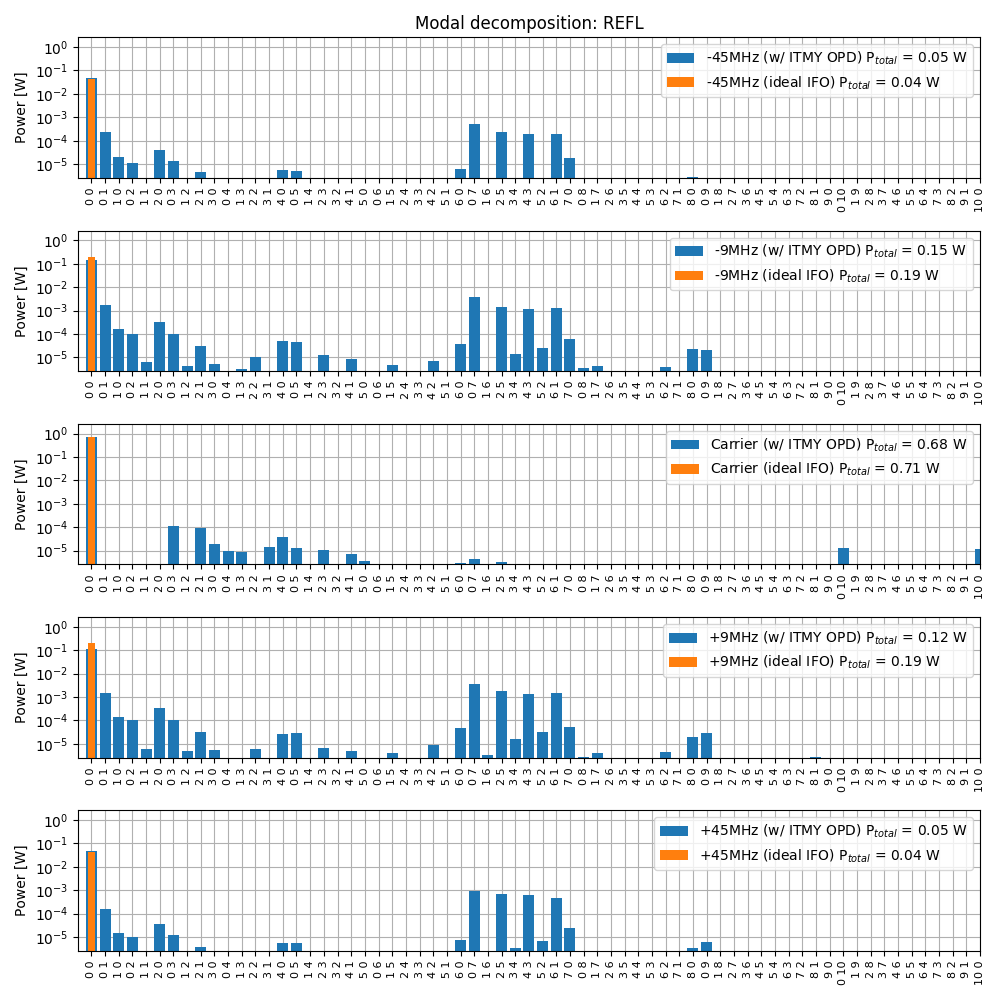
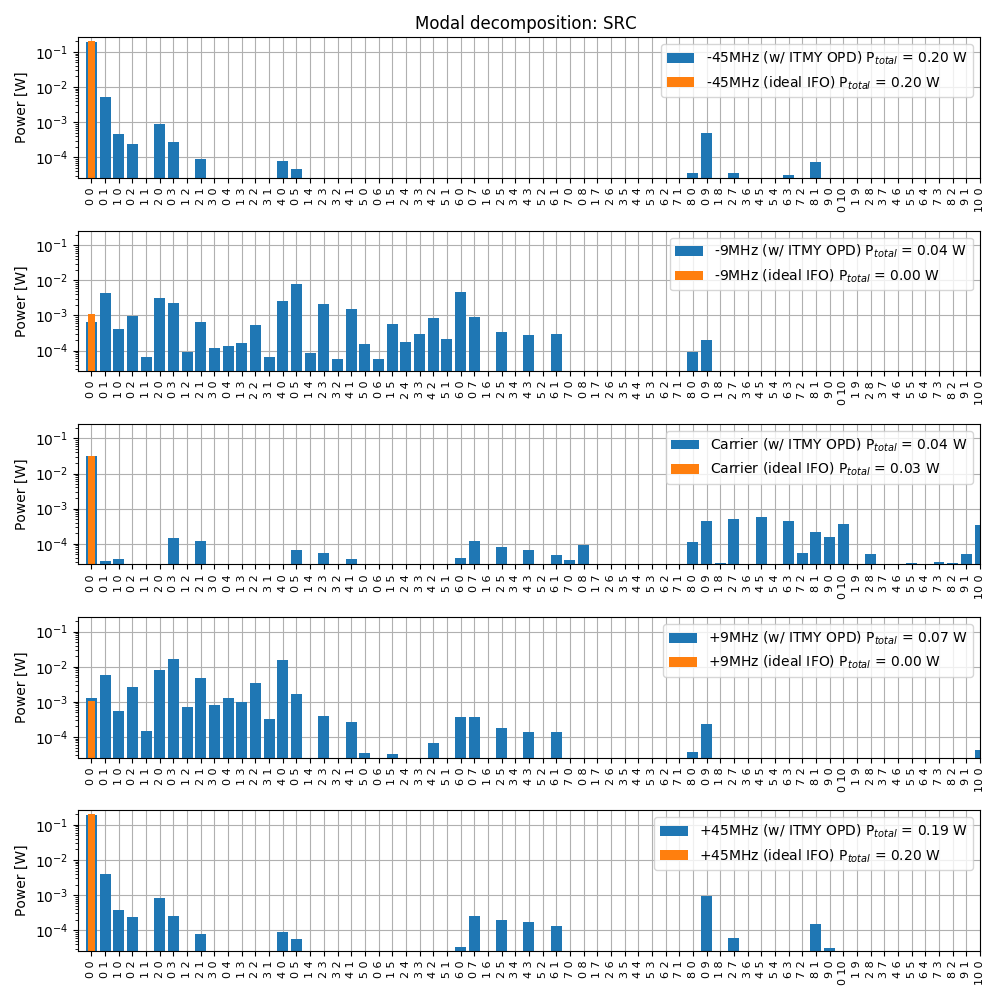
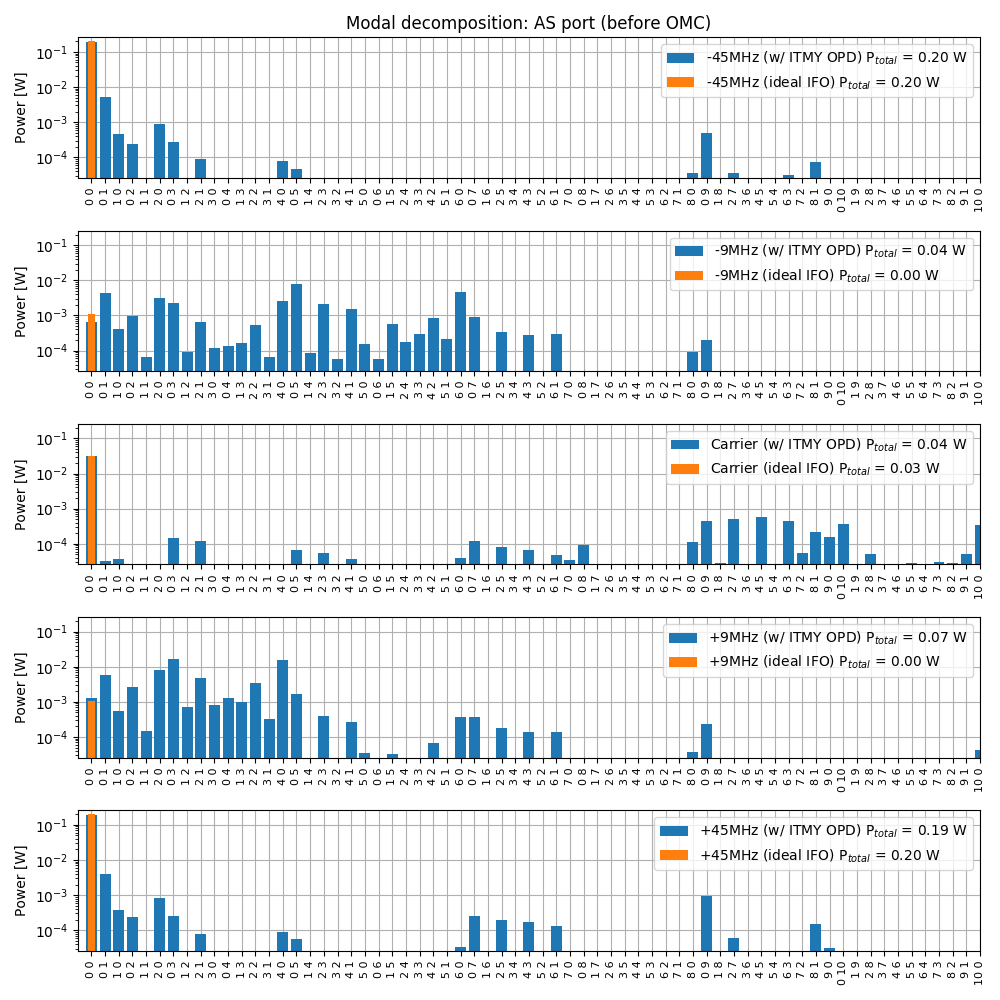
Using the optical path distortion measured by the HWS (provided by Aidan, see also 46127 and 46888) I simulated the mode content at various ports in a dual recycled Fabry-Perot Michelson interferometer. The simulation is done with MIST, using Hermite Gauss modes up to order 10, and locking the interferometer using simulated error signals.
Only the optical path distortion in the ITM is included, there is no deformation of the HR surface.
Each of the attached plots show the distribution of power into each modes, assuming 26 W of input power, 60ppm or round trip losses per arm. The orange traces are there for comparison, to show that in a ideal IFO, all power is in the fundamental TEM00 mode.
Interestingly, the point absorber seems to create some 9MHz sideband power in modes of order 9 at the AS port, which we believe are the culprit for the high RF9 modulation noise coupling.
Nice.
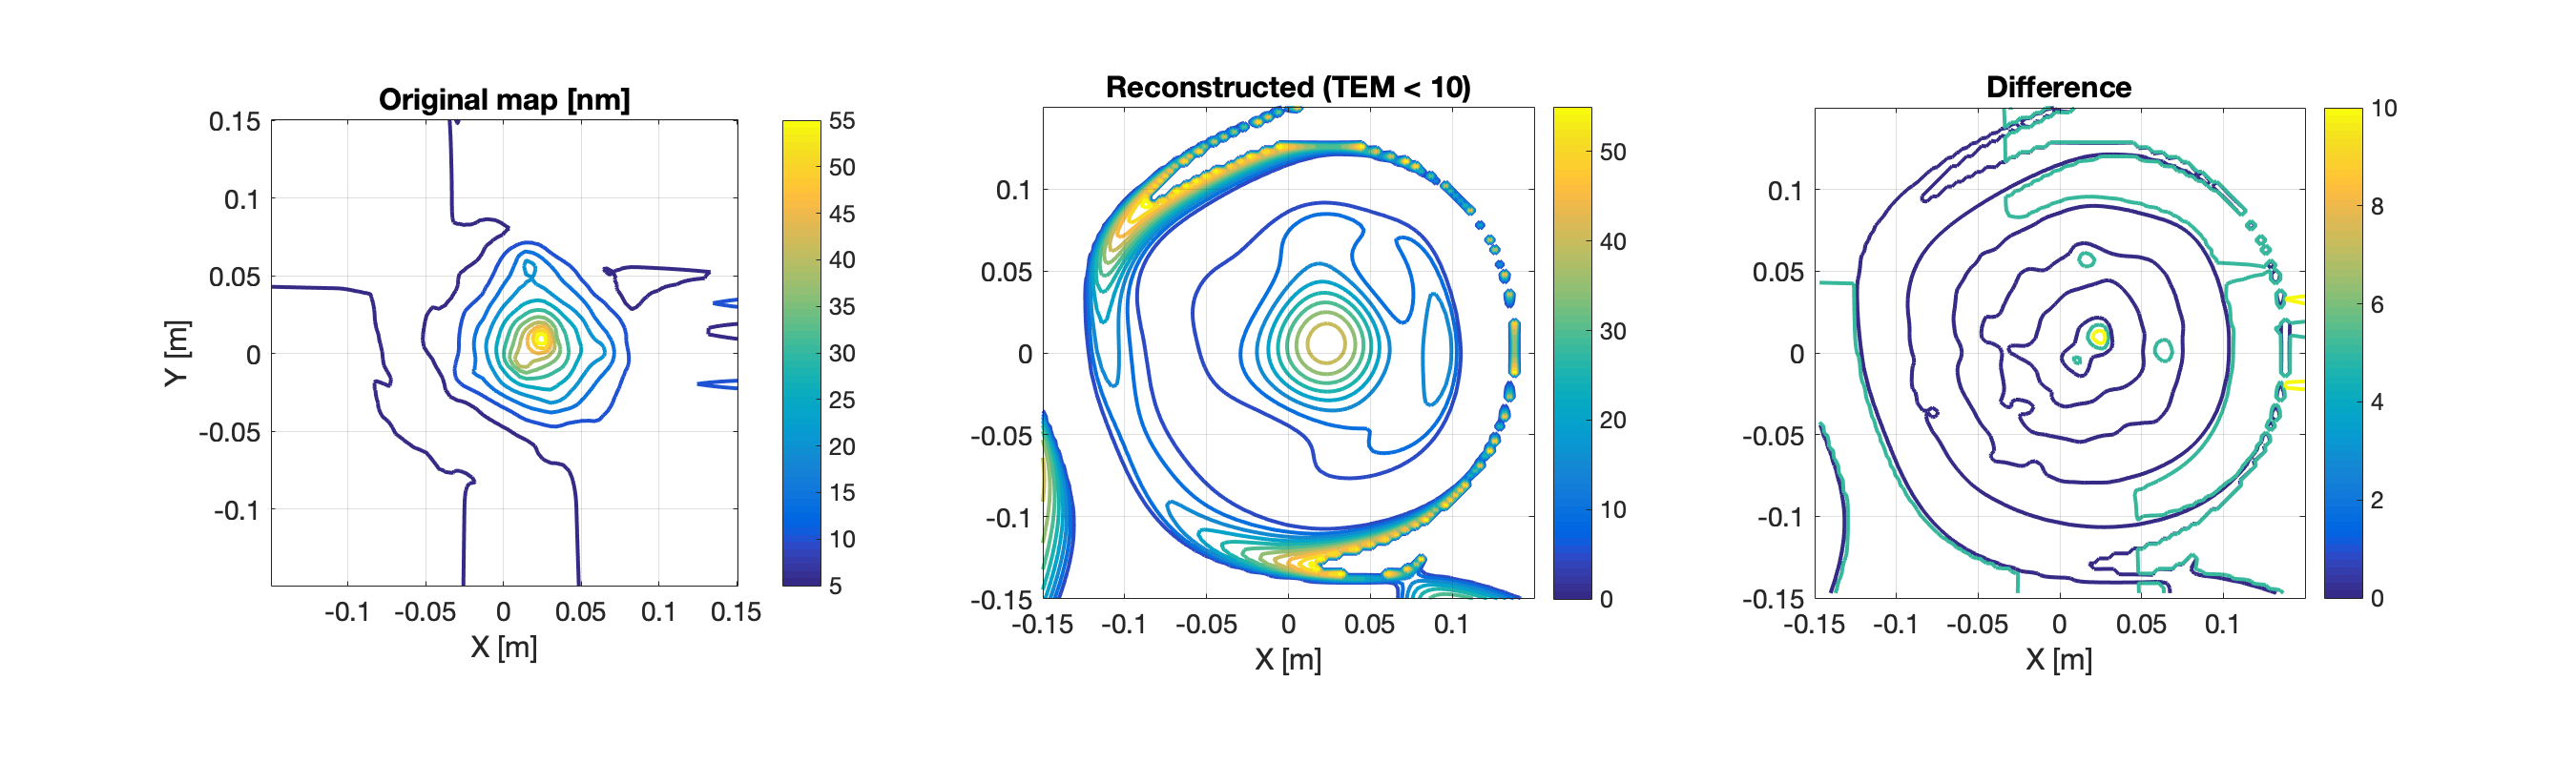
Can you post a comparison of the original wavefront distortion, the 10-th order reconstruction with HG modes and the difference between them?
Aidan, there it is. Left the original single pass map, in nm. Center the map reconstructed from the simulation (take the ratio of the beam transmitted by the substrate over the beam at the input of the substrate, then take the phase, rescale with lambda/2/pi). Right the difference. Clearly the reconstructed map is no good for radii larger than 7-8 cm, since there is no significant laser power there.
The difference shows also that Hermite Gauss modes up to n+m<=10 are not quite enough to really capture the high spatial frequency feature at the absorber (since there's a residual peak there).

FYI.
Wavefront maps are available here: https://ldas-jobs.ligo.caltech.edu/~aidan.brooks/
They're not yet calibrated for the incident power but the general shape is clear and the GPS times are included.
Same comparison of maps as above, this time with TEM Hermite Gauss modes up to order 20.
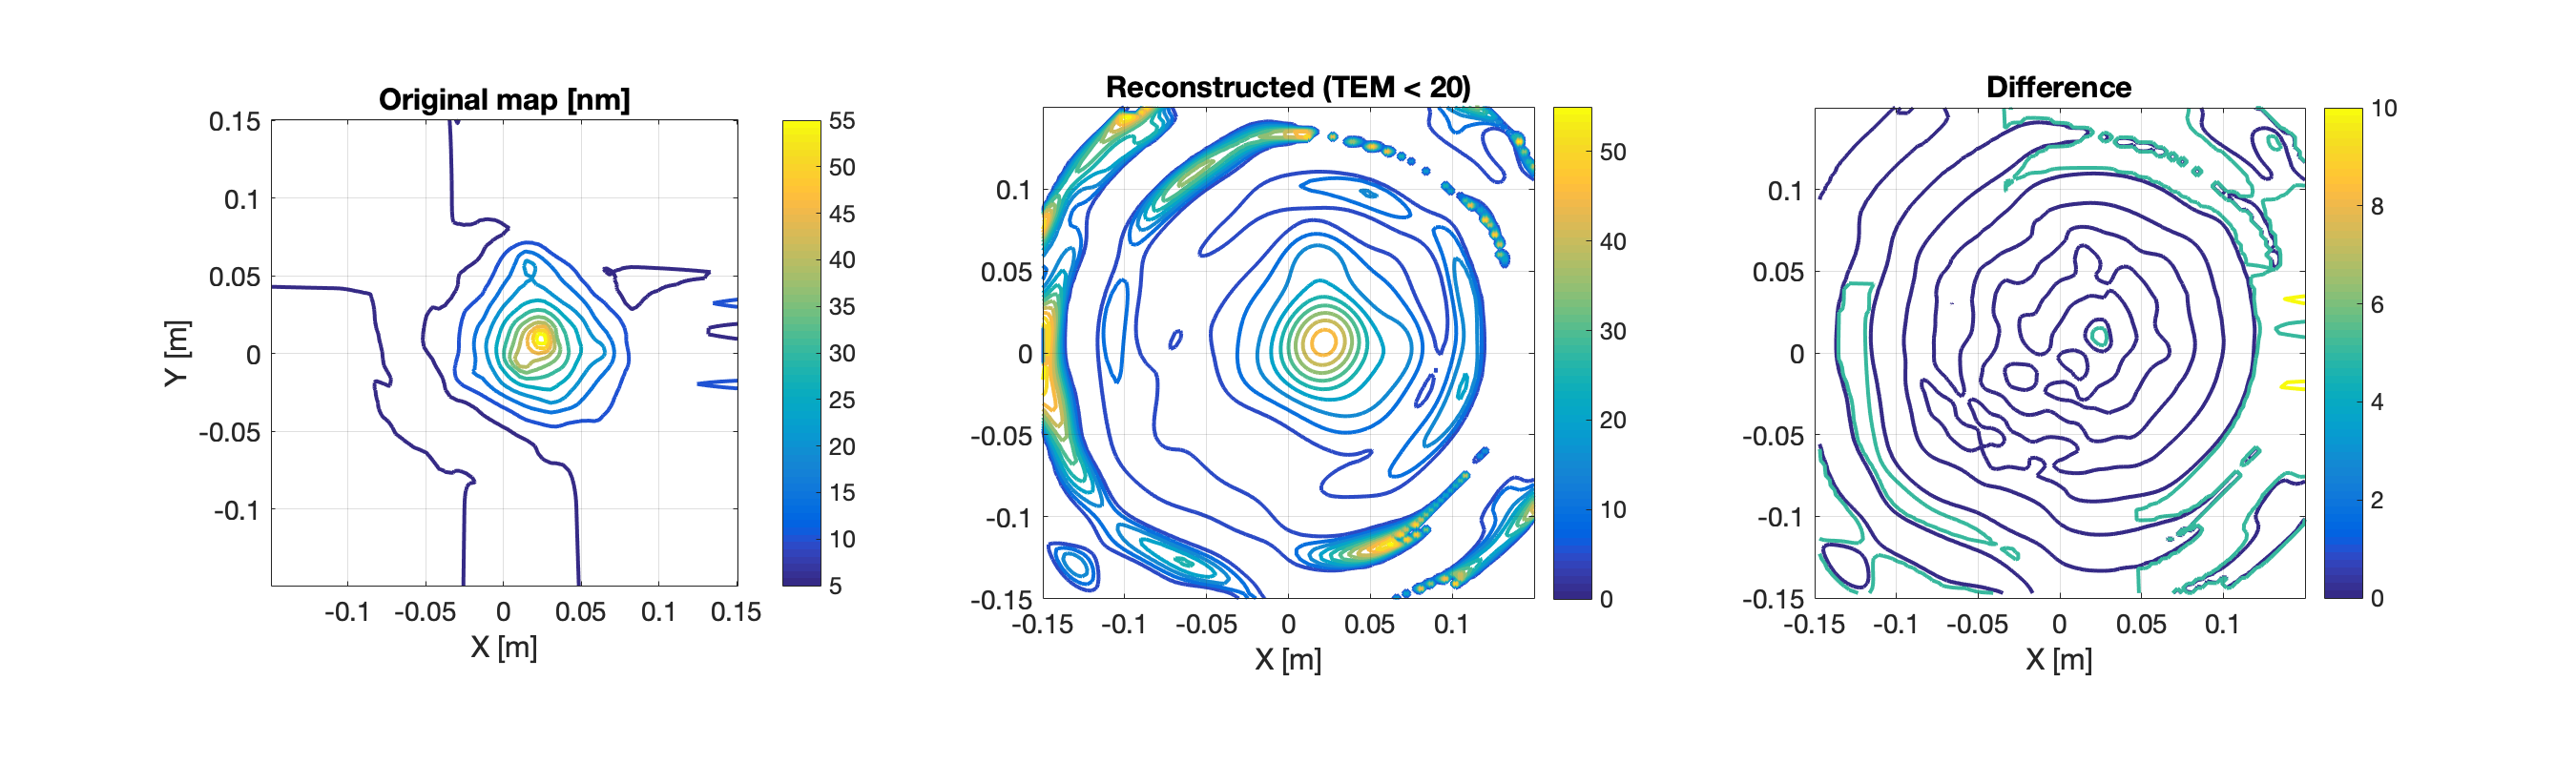
Using Hermite Gauss modes up to n+m<=20 do not change significantly the mode content for the sidebands. There is however a larger amount of carrier power at the AS port for modes of order 8-10.