[Paul, Giacomo]
After moving the HAUX on the HAM table, we observed an overall reduction in OSEMs open light values (OLV), with relative changes spanning from a few % increase to up to almost 30% decrease (see entry 4603). This triggered the need for some debigging, that is summarized here.
First of all, we discovered that there was an error in the out of vacuum connections: as a results, different electronics channels were reading different OSEMs, making the measurement not directly comparable with the ones taken chamber-side (channels and OSEMs have all different "gains", so when you change the pairing...).
Once proper connections were restored we took a series of OLV measurements in which each OSEM of a single HAUX was read by each of the same HAUX's electronic channels. Nothing magic in this particular combination, just a way of having an "OSEM vs channels" matrix to use for some statistics. We obtained a matrix like the following for each suspension:
| UL OSEM | LL OSEM | UR OSEM | LR OSEM | |
| UL CH | ||||
| LL CH | ||||
| UR CH | ||||
| LR CH |
As we wanted to calculate a sort of "gain" for each OSEM, independent from the channel it was connected to, we proceeded as follows:
- took the OLV reading of UL_OSEM with UL_CH, and divided it by the average OLV read by UL_CH on all 4 OSEMs (same row)
- repeated the above calculation using UL_OSEM and LL_CH, UR_CH and LR_CH
- averaged these 4 values (same columns) to obtain the "gain" for the UL_OSEM
We repeated the exact procedure for all 4 OSEMs of a single suspension.
We then calculated a "gain" for each channel as well, using the exact same procedere but swapping rows with columns. The following table reports the OSEMs and channels "gains" calculated this way (the full set of data is available in the attached pdf):
| UL OSEM | LL OSEM | UR OSEM | LR OSEM | UL CH | LL CH | UR CH | LR CH | ||
| IM1 | 1.078 | 1.003 | 0.826 | 1.093 | 1.013 | 0.989 | 0.989 | 1.014 | |
| IM2 | 0.957 | 1.083 | 0.959 | 1.001 | 0.993 | 0.969 | 0.996 | 1.042 | |
| IM3 | 1.010 | 1.031 | 1.055 | 0.904 | 1.006 | 1.006 | 1.009 | 0.979 | |
| IM4 | 0.981 | 1.056 | 1.006 | 0.958 | 0.999 | 1.003 | 1.000 | 0.999 |
From this table, the channels seems to have very consistent "gains" (to within a few percent). The OSEMs show somehow more variability, as probably expected. particularly "bad" is the spread in the IM1 OSEMs...
As of now, the OLVs are as follows (with the "Aug-12" column reporting the values read in august during chamber-side testing):
| Aug-12 | Nov-12 | Change | ||
| IM1 | UL | 29075 | 27637 | -4.94% |
| LL | 27325 | 25614 | -6.26% | |
| UR | 26650 | 22636 | -15.06% | |
| LR | 29380 | 28125 | -4.27% | |
| IM2 | UL | 25155 | 23480 | -6.66% |
| LL | 29040 | 27816 | -4.22% | |
| UR | 26220 | 25102 | -4.27% | |
| LR | 28165 | 25690 | -8.79% | |
| IM3 | UL | 25440 | 24174 | -4.98% |
| LL | 26175 | 24416 | -6.72% | |
| UR | 26940 | 25144 | -6.67% | |
| LR | 26870 | 22569 | -16.01% | |
| IM4 | UL | 27790 | 25763 | -7.29% |
| LL | 29485 | 27886 | -5.42% | |
| UR | 27765 | 26393 | -4.94% | |
| LR | 26990 | 24959 | -7.52% |
Overall, there is a reduction in the 5-10% range, maybe due to increase resisitance in the new cables (as observed by Jeff in entry 4541); I don't have the data for the previous and current lenght and/or resistance of the cables, so I cannot confirm this.
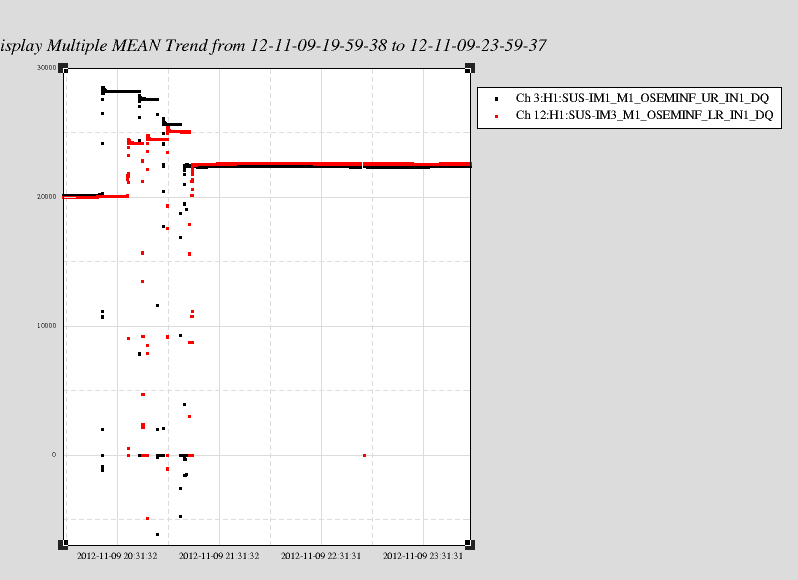
In addition, IM1_UR and IM3_LR both show a reduction significantly bigger than the others (and the lowest absolute OLV values); also, for some reason they were reading even lower values (by about 10-15%) during the OLV matrix measurements than reported in the above table. A closer look at the recorded data (see attached png) shows that the change happened "during" the OLV matrix measurements: they were both reading about 20k before the OLV matrix measurement (also taken as the first value for the diagonal elements in that measurement); after being disconnected and reconnected several times, they were put back in their original positions and the readings increased to about 22k. The reason for this is unclear and may require further investigation.