
Looking at the range plot in the summary pages, there was a clear degradation of the sensitivity over time during the last long lock.

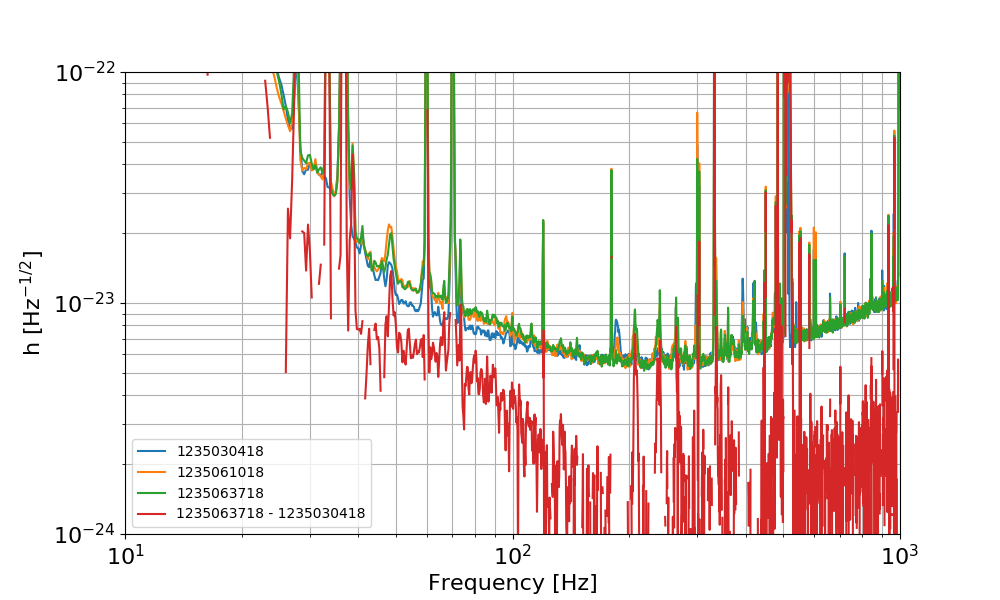
I picked the three times highlighted with the arrows and compared the sensitivity spectra. In the plot below the GDS-CALIB_STRAIN spectrum is shown for the three times, as well as the quadrature difference of the last and first spectra (the worst and the best).
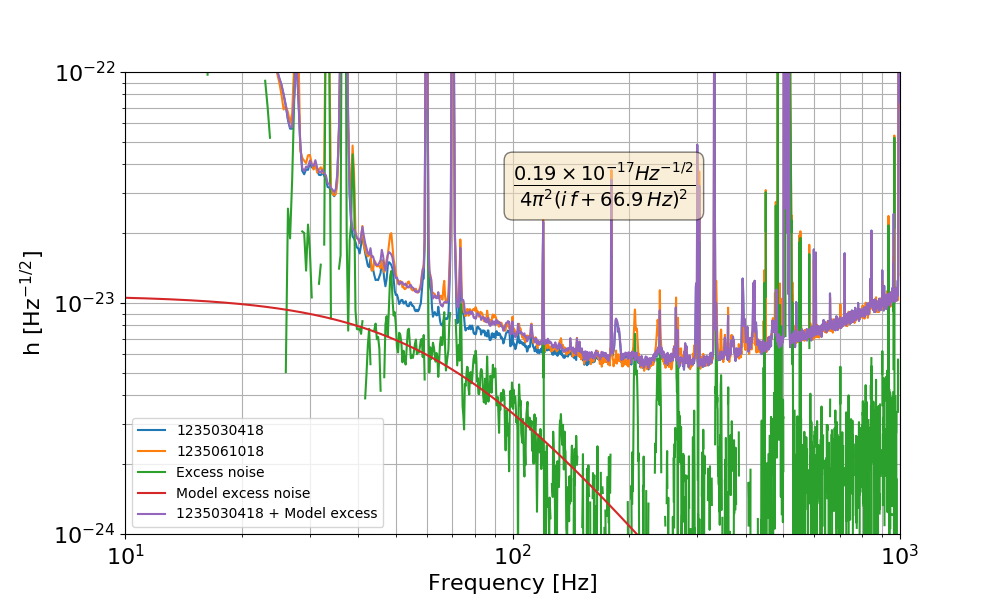
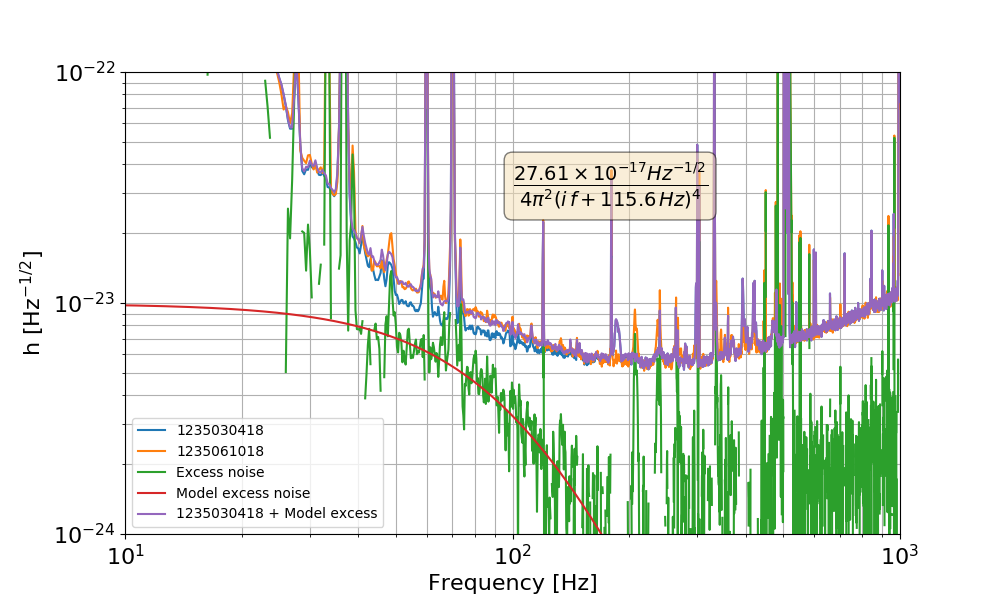
I tried to see what kind of noise is needed to explain the sensitivity worsening. I modeled the excess noise as a double real pole and fit it to the data. The result is shown below: the excess noise is quite well described by a double real pole at about 67 Hz. Note: the optimal fit parameters are obtained by minimizing the difference between the worst PSD and the best PSD + excess noise, summing over all frequencies between 40 and 200 Hz. However, the noise can be similarly be described by any function with a steep enough cut-off at 50-100 Hz. For example, using four simple poles at about 120 Hz. maybe scattered light? That's a process that can give steep roll-offs like this. No strong evidence.
BruCo scans of the first two periods are in progress.
BruCo scans for "good" and "bad" times are ready:
Good: https://ldas-jobs.ligo.caltech.edu/~gabriele.vajente/bruco_lho_1235030418/
Bad: https://ldas-jobs.ligo.caltech.edu/~gabriele.vajente/bruco_lho_1235061018/
Nothing has significantly more coherence in the bad times than in the good times...