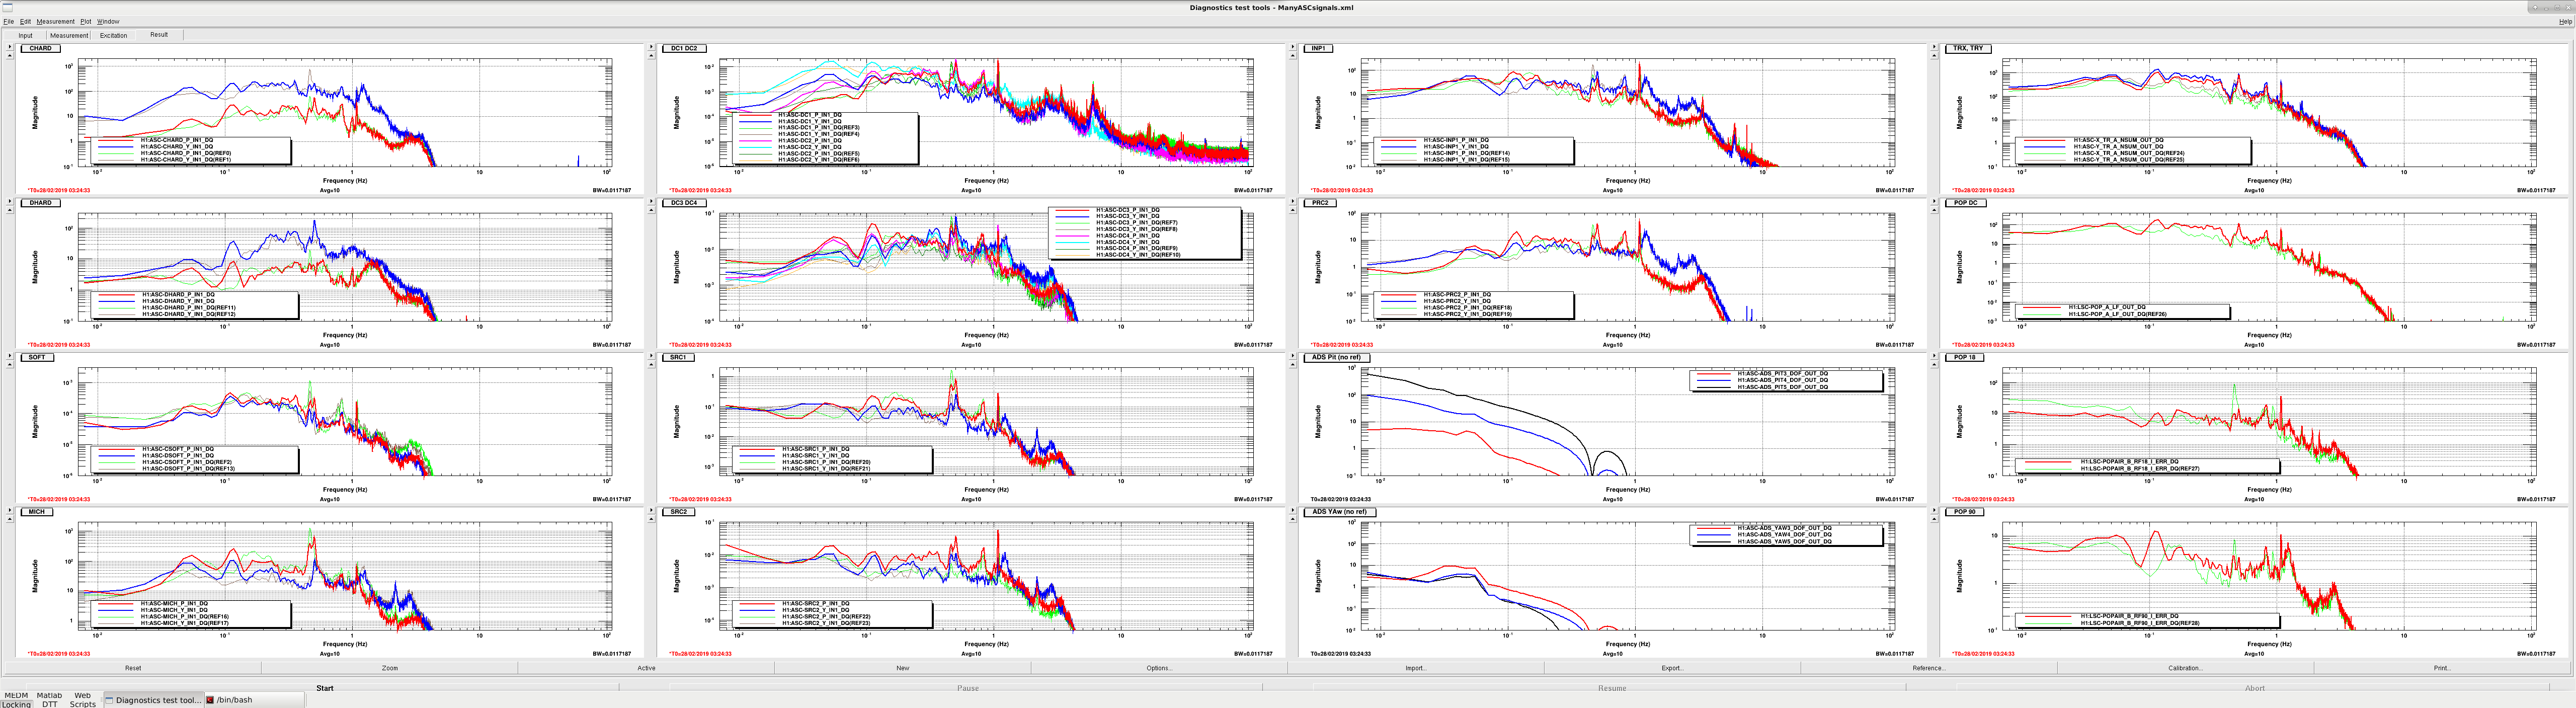
With the new spot positions that we're using to avoid hitting too strongly on the ITMY point absorber, we seem to see that the circulating powers on our time series plots look a bit noisier than they used to. Attached is a plot where the references are from the 'improved spectrum' alog time (47011) which was with the old spots, and the 'live' traces are from this evening, with the new spot positions and higher circulating powers. None of these traces are calibrated, sorry.
The angular traces (left 3 columns) don't really see a lot more noise than the references, and in some cases seem to see a bit less (I'm not taking ground motion into account here). The exceptions are SRC2 (2nd column, bottom row), and PRC2 (3rd column, 2nd row). However, the powers (right hand column) shows a fair amount more motion. We may need to tighten our SRC2 ASC loop, as well as look at some of our length loops to see if they need to be tightened up.
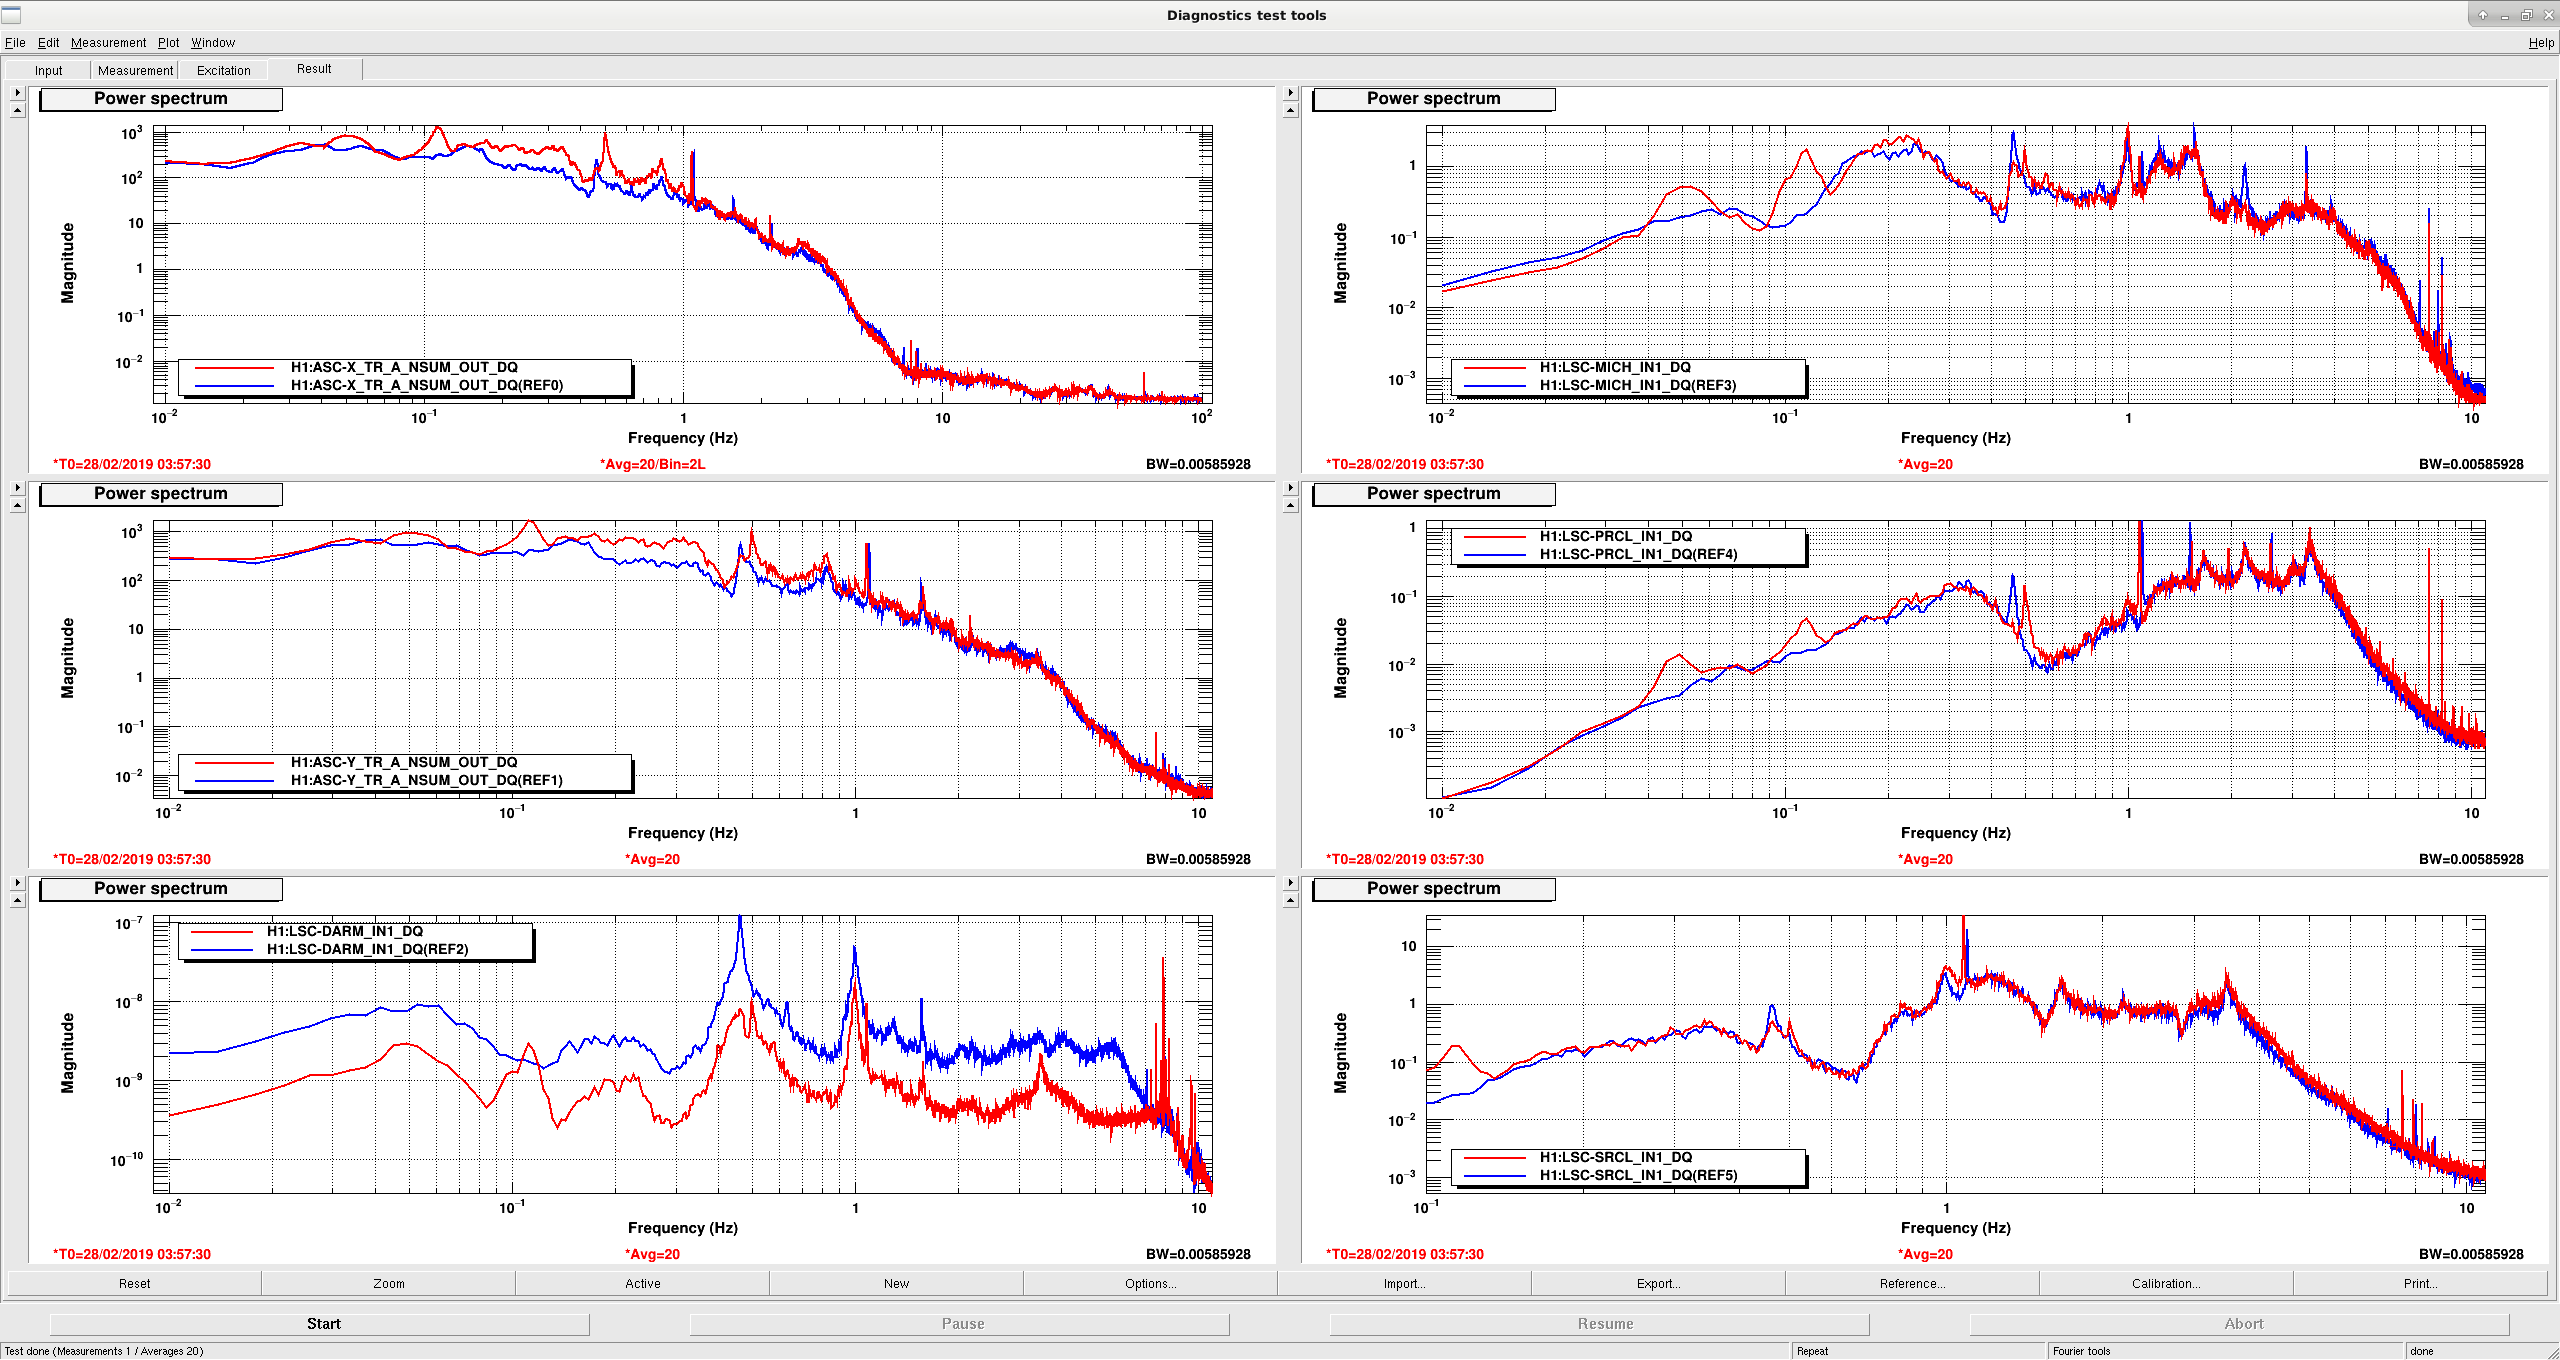
Looking at the LSC signals for the same time periods, it looks like the new peaks in the circulating power at 0.005, 0.1, 0.5 Hz are from PRCL/MICH.