Nutsinee, Stefan
We designed a squeezing monitor BLRMS bank into H1:OAF-RANGE_RBP_7 (band-pass) and H1:OAF-RANGE_RLP_7 (low pass or the squared signal).
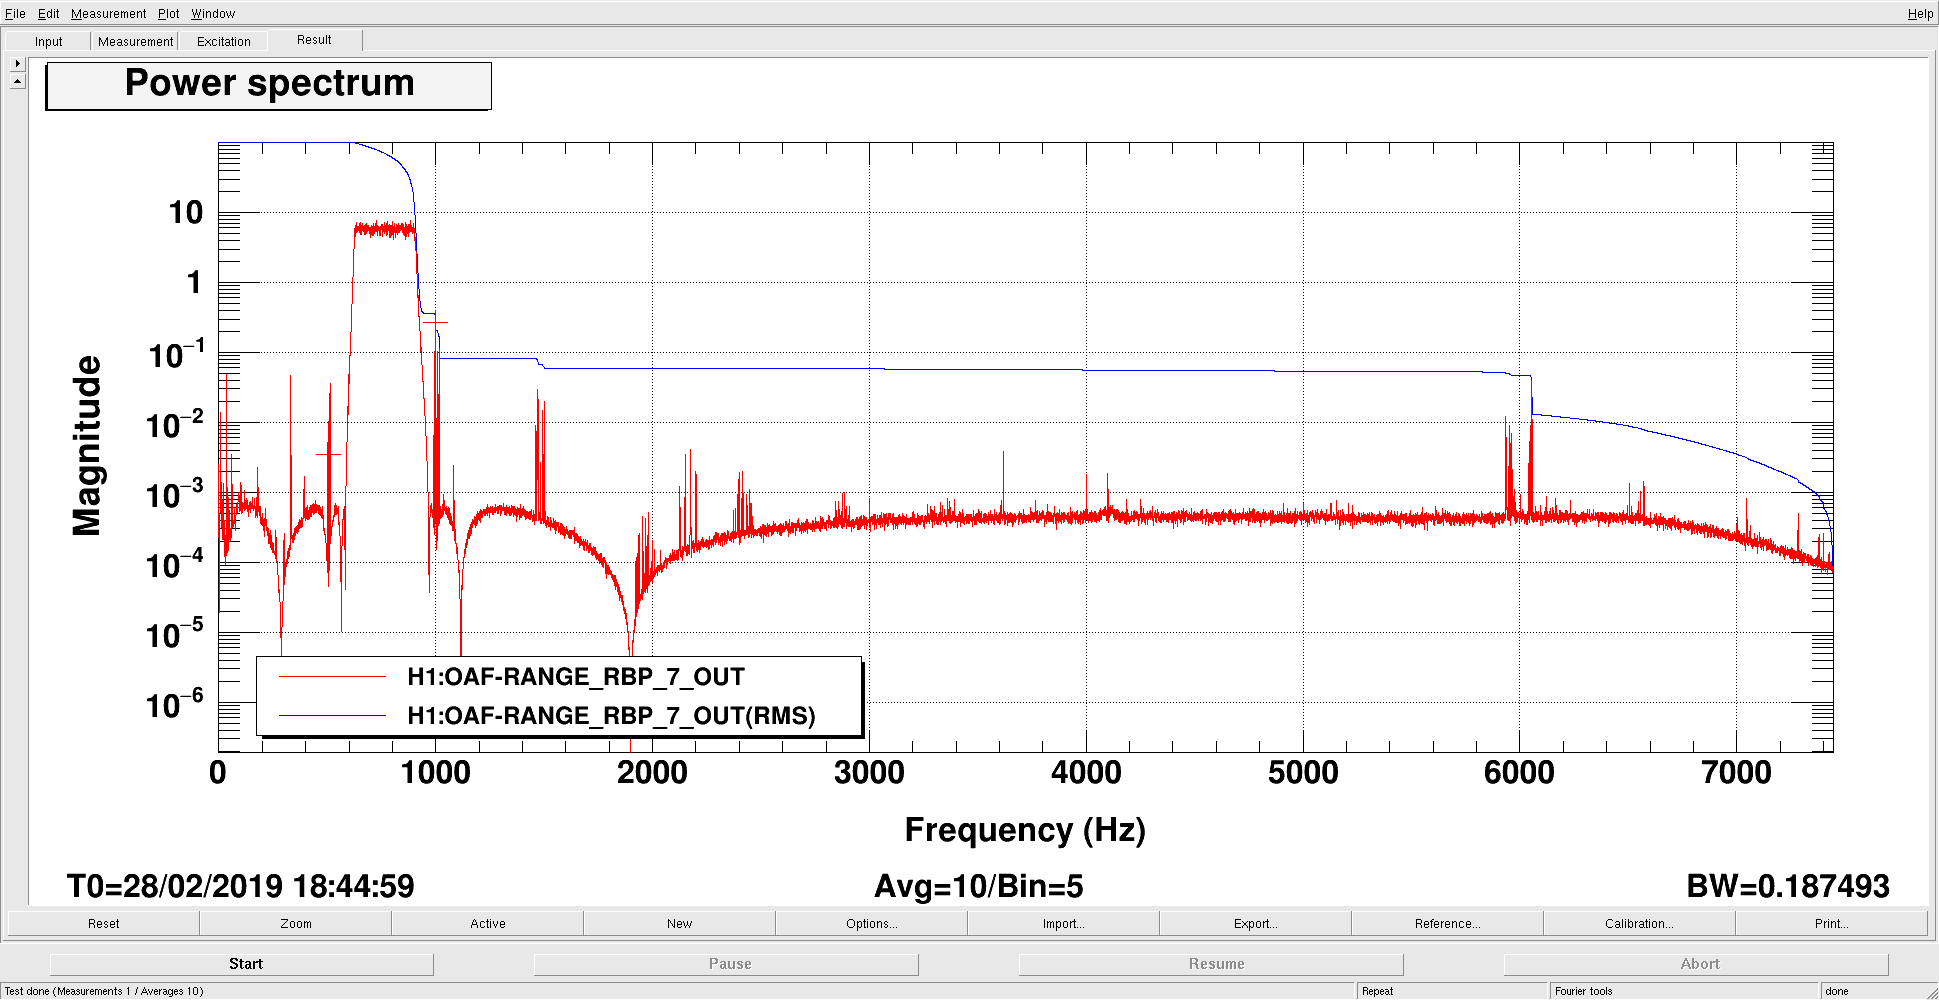
Band pass: ellip("BandPass",8,0.1,80,628,900) zpk([0;0;0],[100;100;100],0.000001,"n") (figure 1) (This focuses on the clean region between 628Hz and 900Hz, carefully placing the notches of the elliptic bandstop on the violin modes.
RMS low-pass: 0.02Hz pole
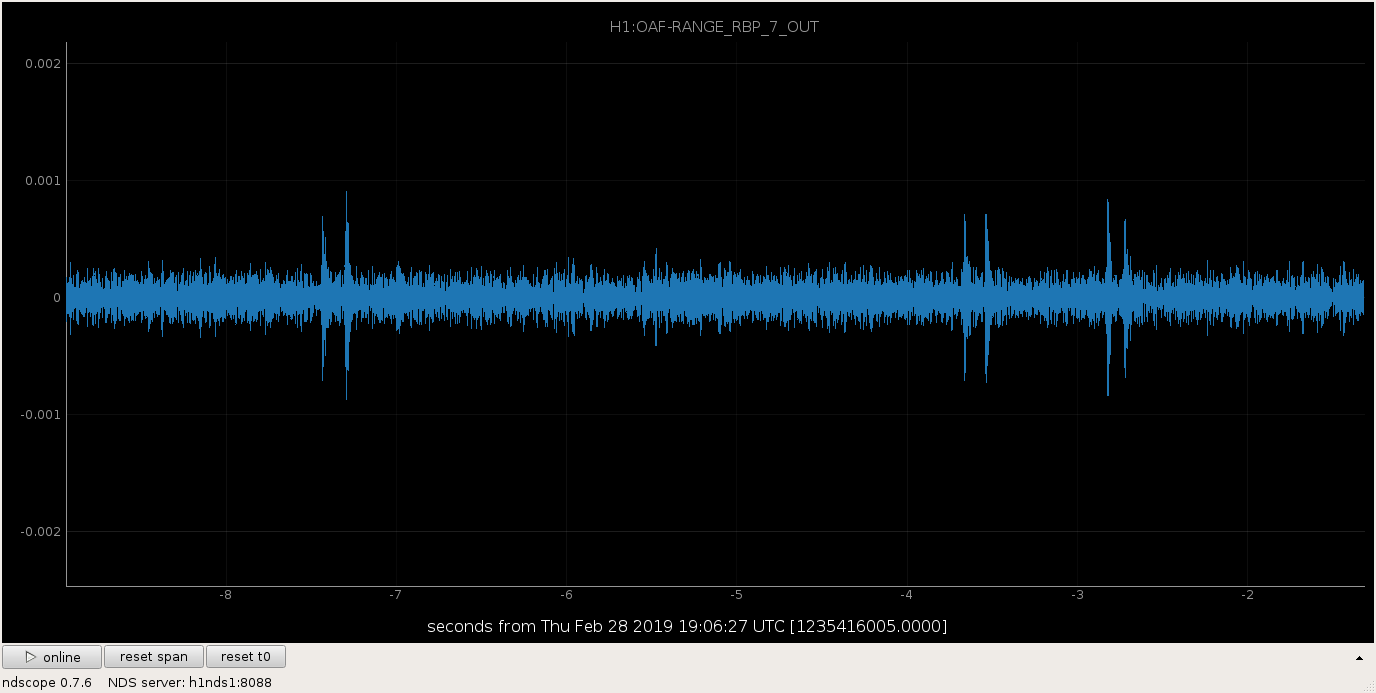
To our surprise, we notices very frequent (~all 5 secs or so) transients that actually dominate the background shot noise level by maybe a dB or so, figure(2).
We could use detchar help to track those things down.
The measurement was done with the squeezer on, but the glitches persist without squeezer.
Tagging DetChar
Hi Stefan and Nutsinee,
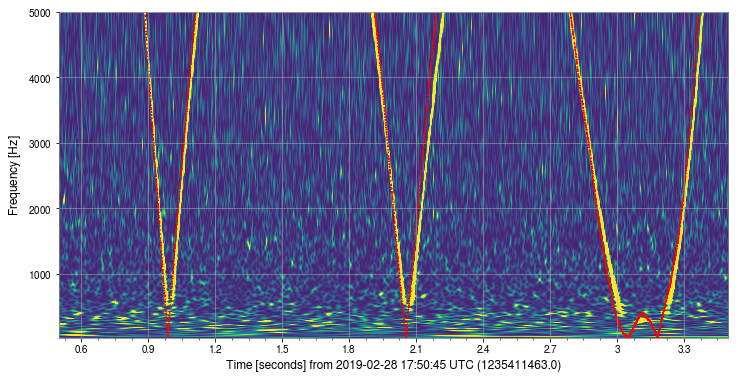
What you’ve got there is some RF whistles. They’ve been less rare in H1 this year. Here’s (building) a scan of your time. Plot attached too.
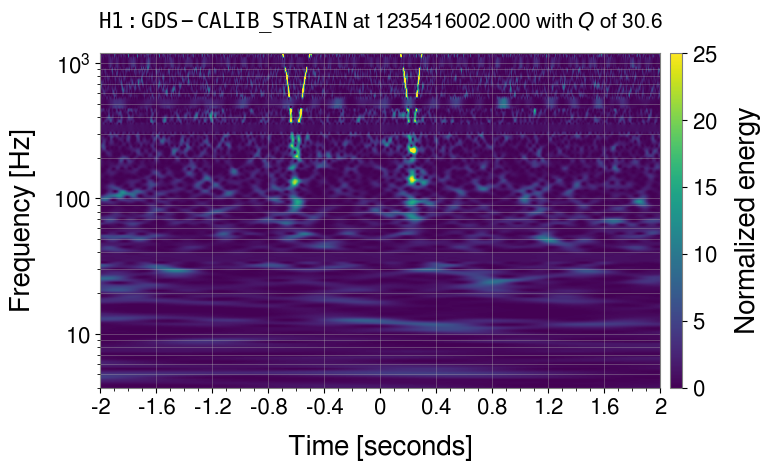
Thanks Josh. We definitely need to fix them - right now they add about a dB of short noise on average.
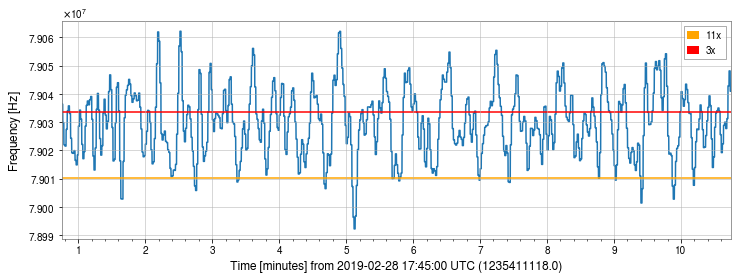
I've fit the whistles to find what VCO frequencies produce them. I find two crossings in the time I've looked at: 79.0103 MHz and 79.0334 MHz.

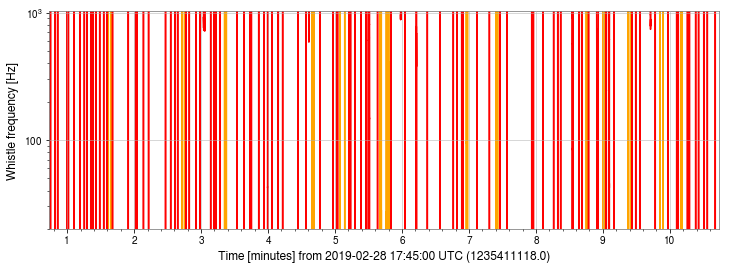
In the few minutes I've looked at, whistles always and only occur when the VCO crosses one of these two frequencies. The whistle track very closely fits a multiple of the difference between the VCO and the stationary frequency. The first line is an 11th or 12th multiple of the beat frequency, while the second is 3 times it.

The first plot is a prediction for three of the whistles, to demonstrate how the method works and showing the quality of the fit. The second is the movement of the VCO frequency over 10 minutes, and the third the predicted tracks of the whistles in DARM during that time.

It might be worth trying to shift the VCO frequency up to 79.06 MHz to see if that region is any quieter.