Sheila, Georgia
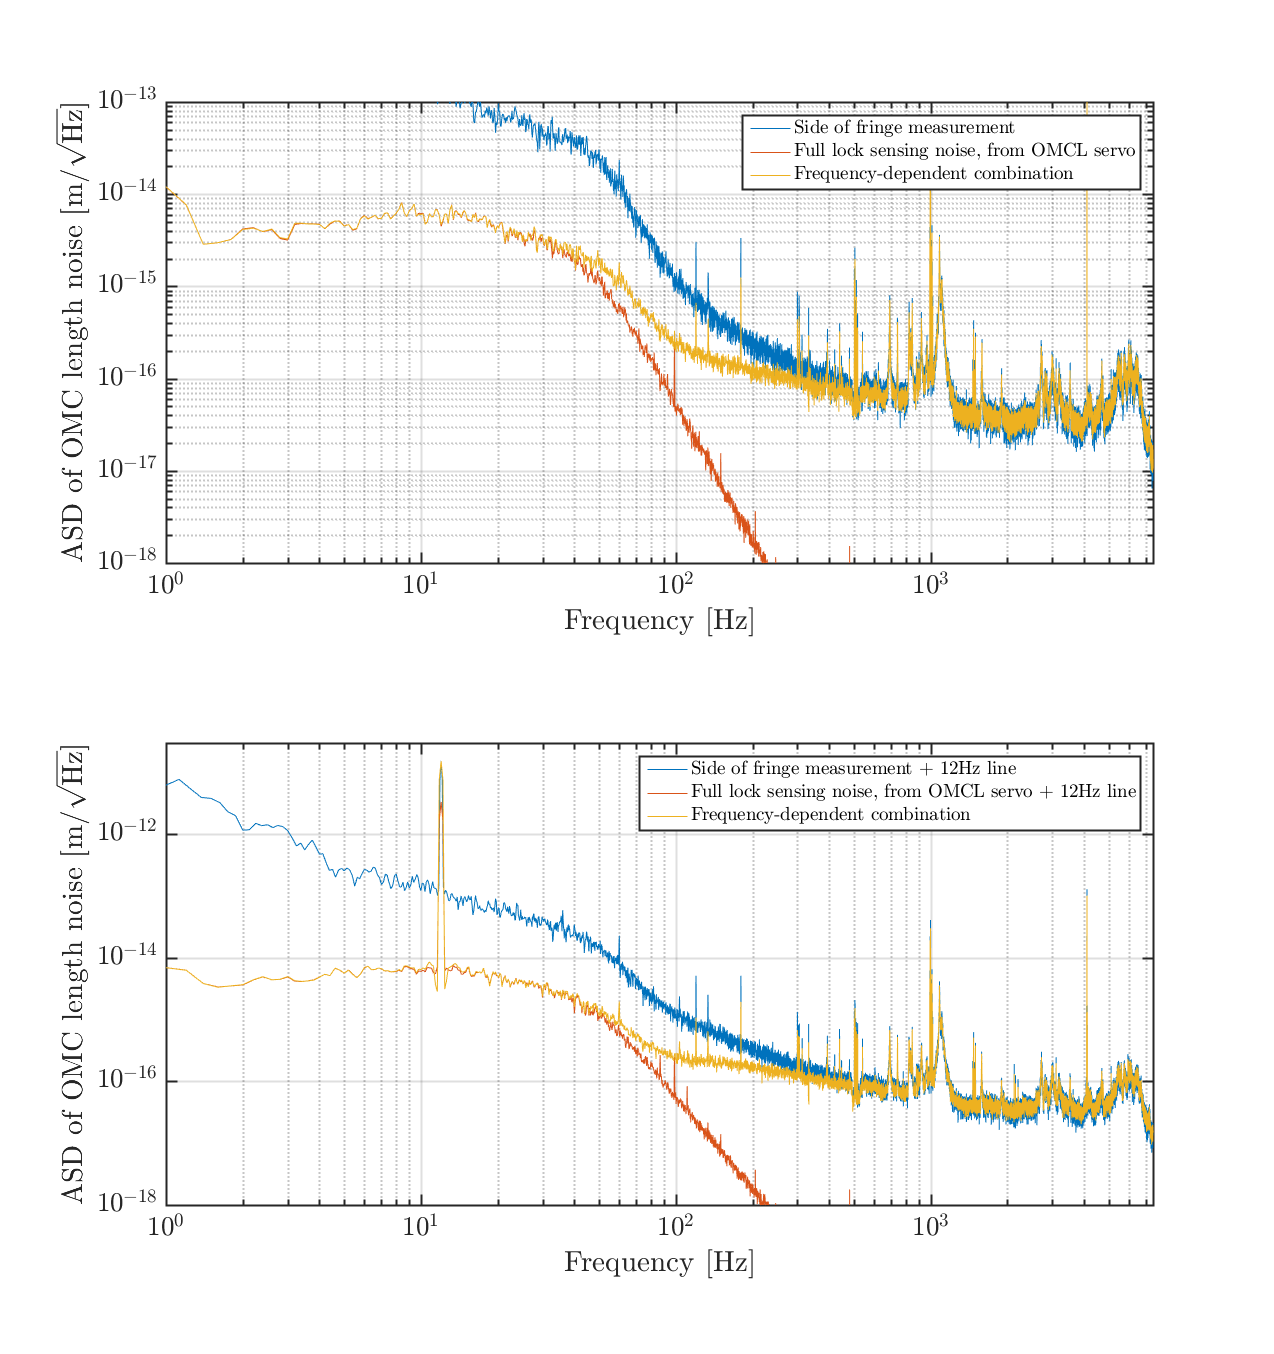
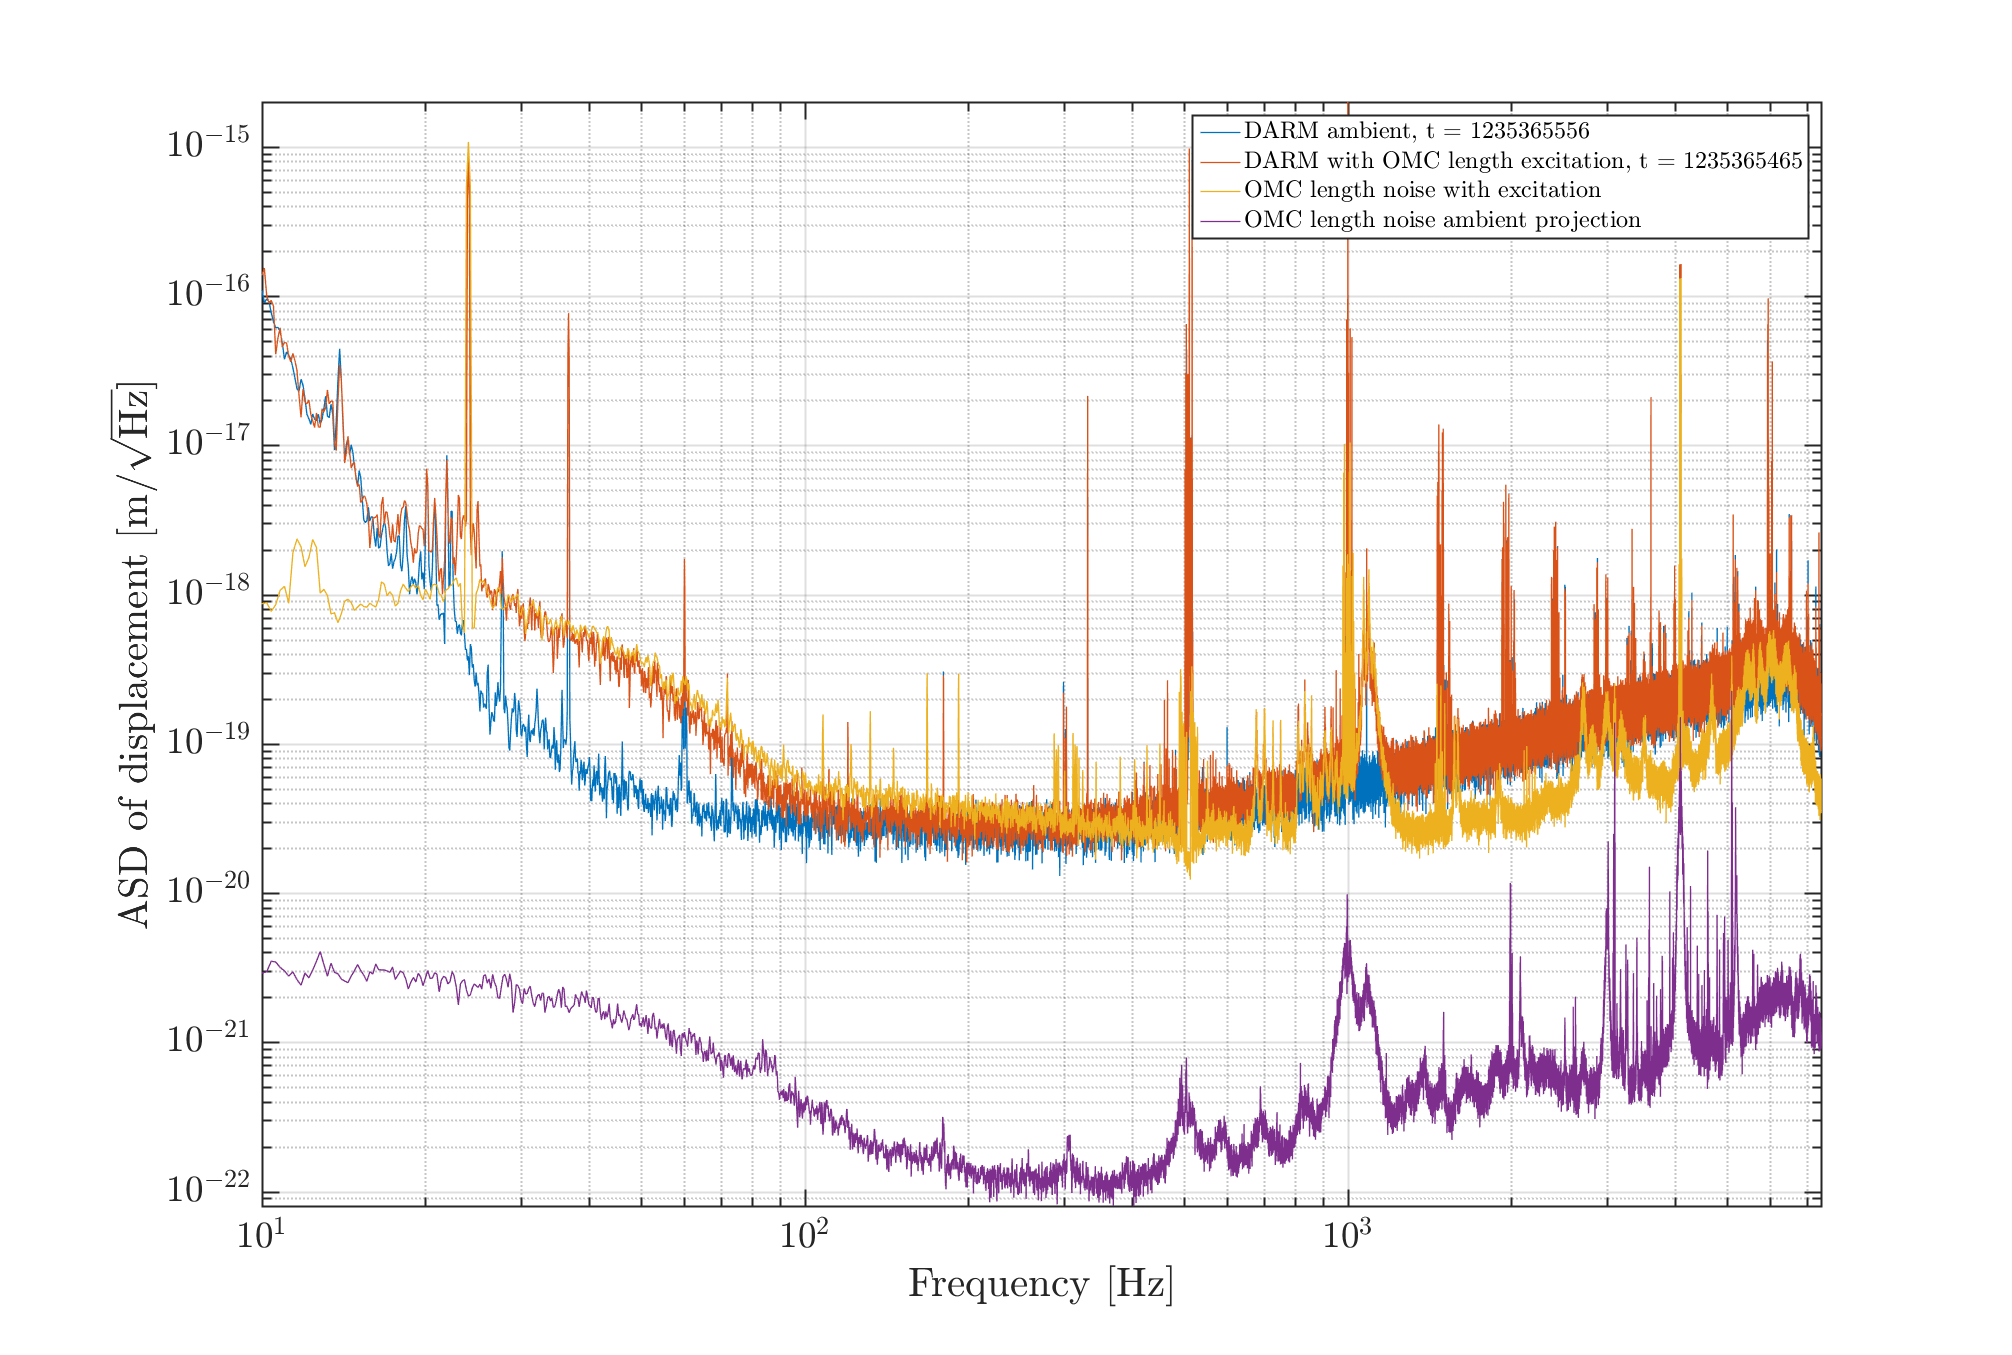
We have taken measurements of the OMC length noise - the top plot of the first attachment shows the length noise ASD in yellow - and projected it to be a factor of 30 below DARM at its closest point (second attachment). In the second attachment the blue and purple curves are DARM and the OMC length noise projection with no excitation. The red and yellow traces are taken when a 12 Hz line is injected at OMC PZT2, causing a 24 Hz line in DARM (OMC length to power on the DCPDs is a quadratic coupling), and additional broadband length noise below 100 Hz, and around the 1080 Hz resonance in HAM6. The prediction of length noise to DARM around 100Hz is a little off but this isn't unexpected given the way we have combined to witnesses of length noise, details below.
---
This measurement is a bit convoluted. When the OMC is on resonance the coupling from change of cavity length to power on the transmission DCPDs is quadratic (figure 1 in Dan Hoak's alog (19212) about exactly this measurement taken 2 years ago). To make a linear coupling from change in length to power on the DCPDs we can lock the OMC with an offset in the servo, i.e. on the side of a fringe. From the noise on the DCPDs while locked on the side of the fringe, and knowledge of how far off resonance we are, we can work out the change in OMC length this corresponds to. The maths for this conversion is summarised in the pdf attached to Sheila's alog (30510) about this measurement in 2016, and the script I used to make this projection is in:
/ligo/home/sheila.dwyer/Noise/OMC_LENGTH/2019/calibrate_DCPD_spectra_750_blend_servo.m
When we lock on the side of the fringe, above a few hundred Hz we see length noise. However around the dither line which the OMC length is locked to (4100 kHz), there is extra noise which then gets down-converted. This extra noise limits this measurement at low frequency (extra noise below a few hundred Hz in the blue trace in the first attachment). To see below this noise we can look instead at the in-loop error signal when in full lock, as Sheila did in the previous length noise measurement. The red trace of first attachment shows this error signal filtered by the closed loop gain of the OMC length loop. We also tried looking at the drive signal to the OMC PZT2, but this was too noisy. So the actual OMC length noise projection is made by combining the low frequency component of the in-loop error signal, and the high frequency component of the side-of-fringe measurement, shown in yellow in the first attachment. The top plot in the first attachment shows the length noise with no excitations to OMC length, and the bottom plot shows the length noise with a 12 Hz line injected, which we'll use later as a sanity check when projecting to DARM. The combination of length noise witnesses is a bit of a guess in the 50-300 Hz region, which is why I'm not surprised out projection doesn't line up perfectly with DARM in this region.
We next convert the length noise in m into the DCPD RIN (using equation 1 of the pdf attached to alog 30510). Multiplying this by the full lock DCPD current and adding the DARM calibration in m/mA (and the cavity pole and optical gain), we can convert this projection into meters of DARM displacement. This gives the yellow and purple traces in the second attachment.
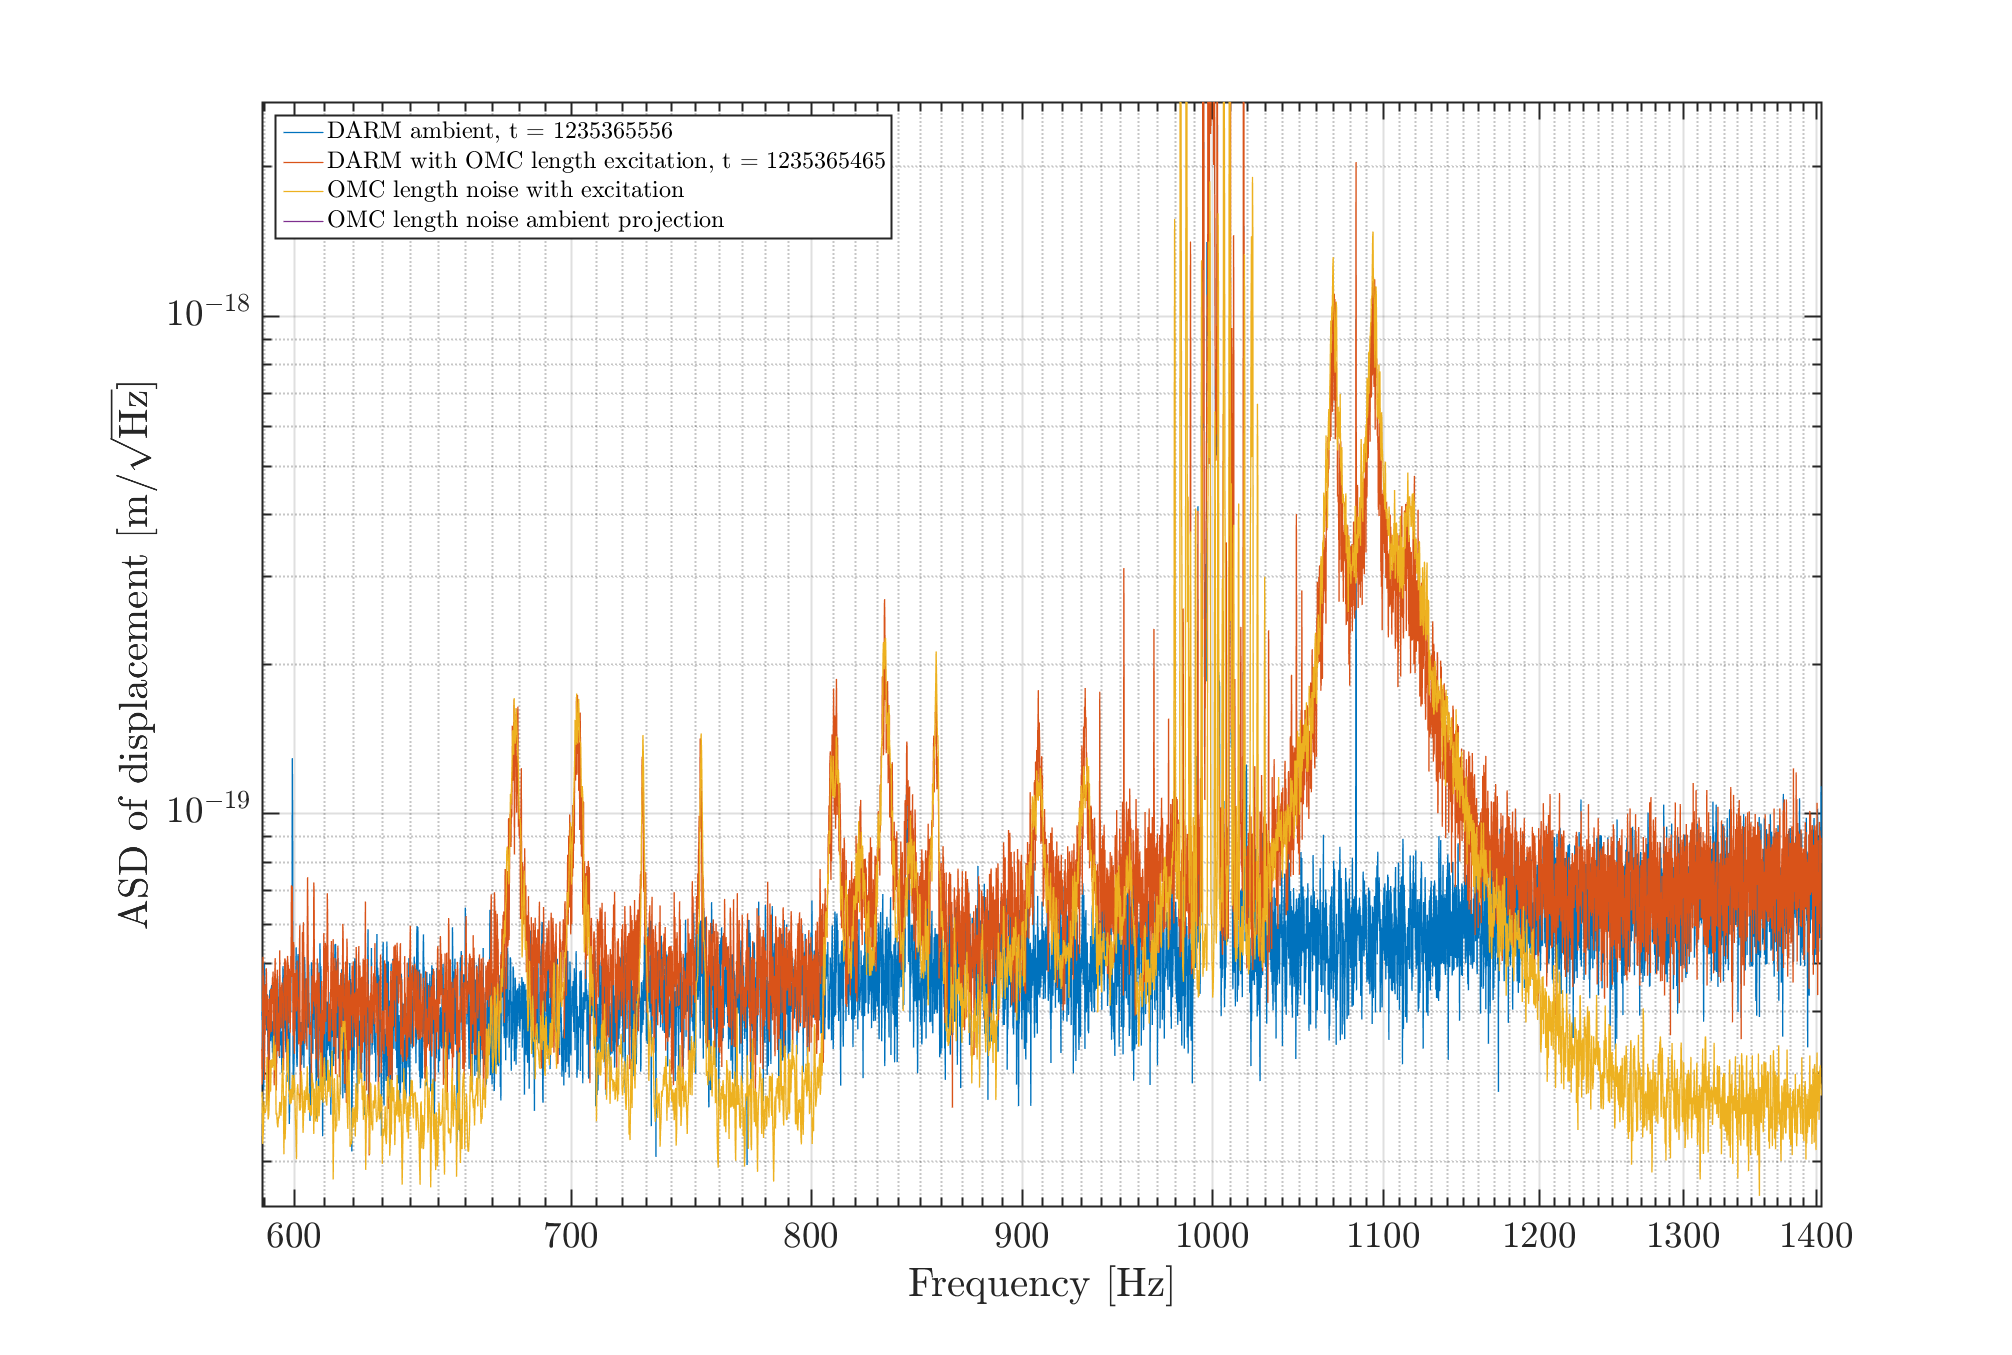
As a sanity check we inject a 12 Hz line into the OMC length (A=0.3, applied to PZT2) while locked on the side of fringe, and while in full lock. We can compare DARM and OMCL at the line frequency, the extra length noise around it, and the extra broadband noise around the 1083 Hz resonance (3rd attachment), it agrees well.
Some things to note:
- This projection doesn't tell us anything about the shoulders on the 60 Hz line, both the side-of-fringe and in-loop error signal don't have anything much at 60 Hz.
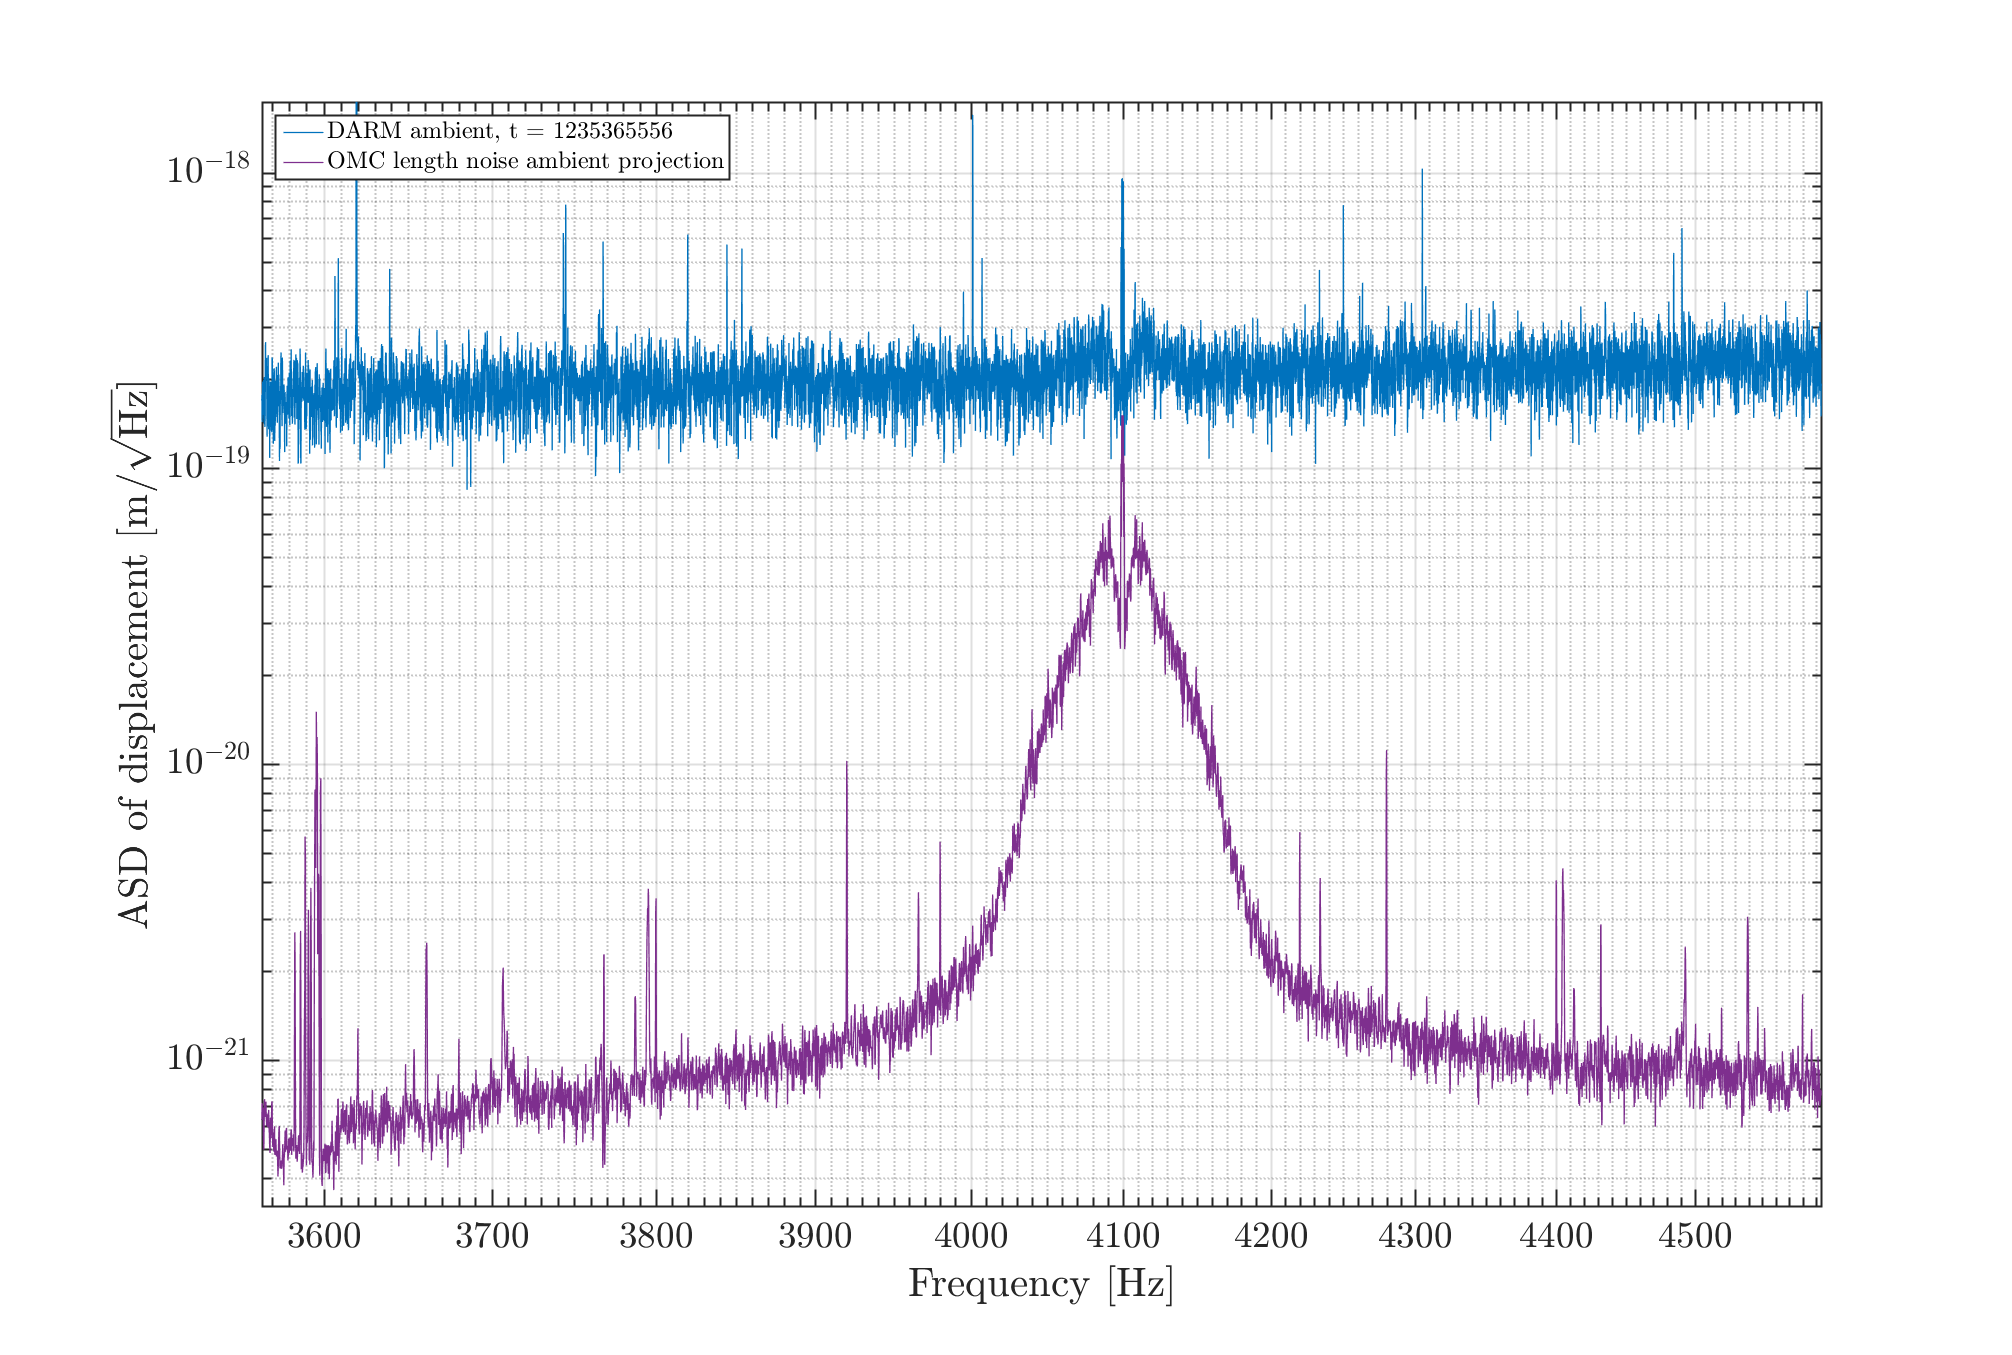
- The ambient OMC length noise projection and the shoulders around that (4th attachment), underestimating them by a factor of ~6.