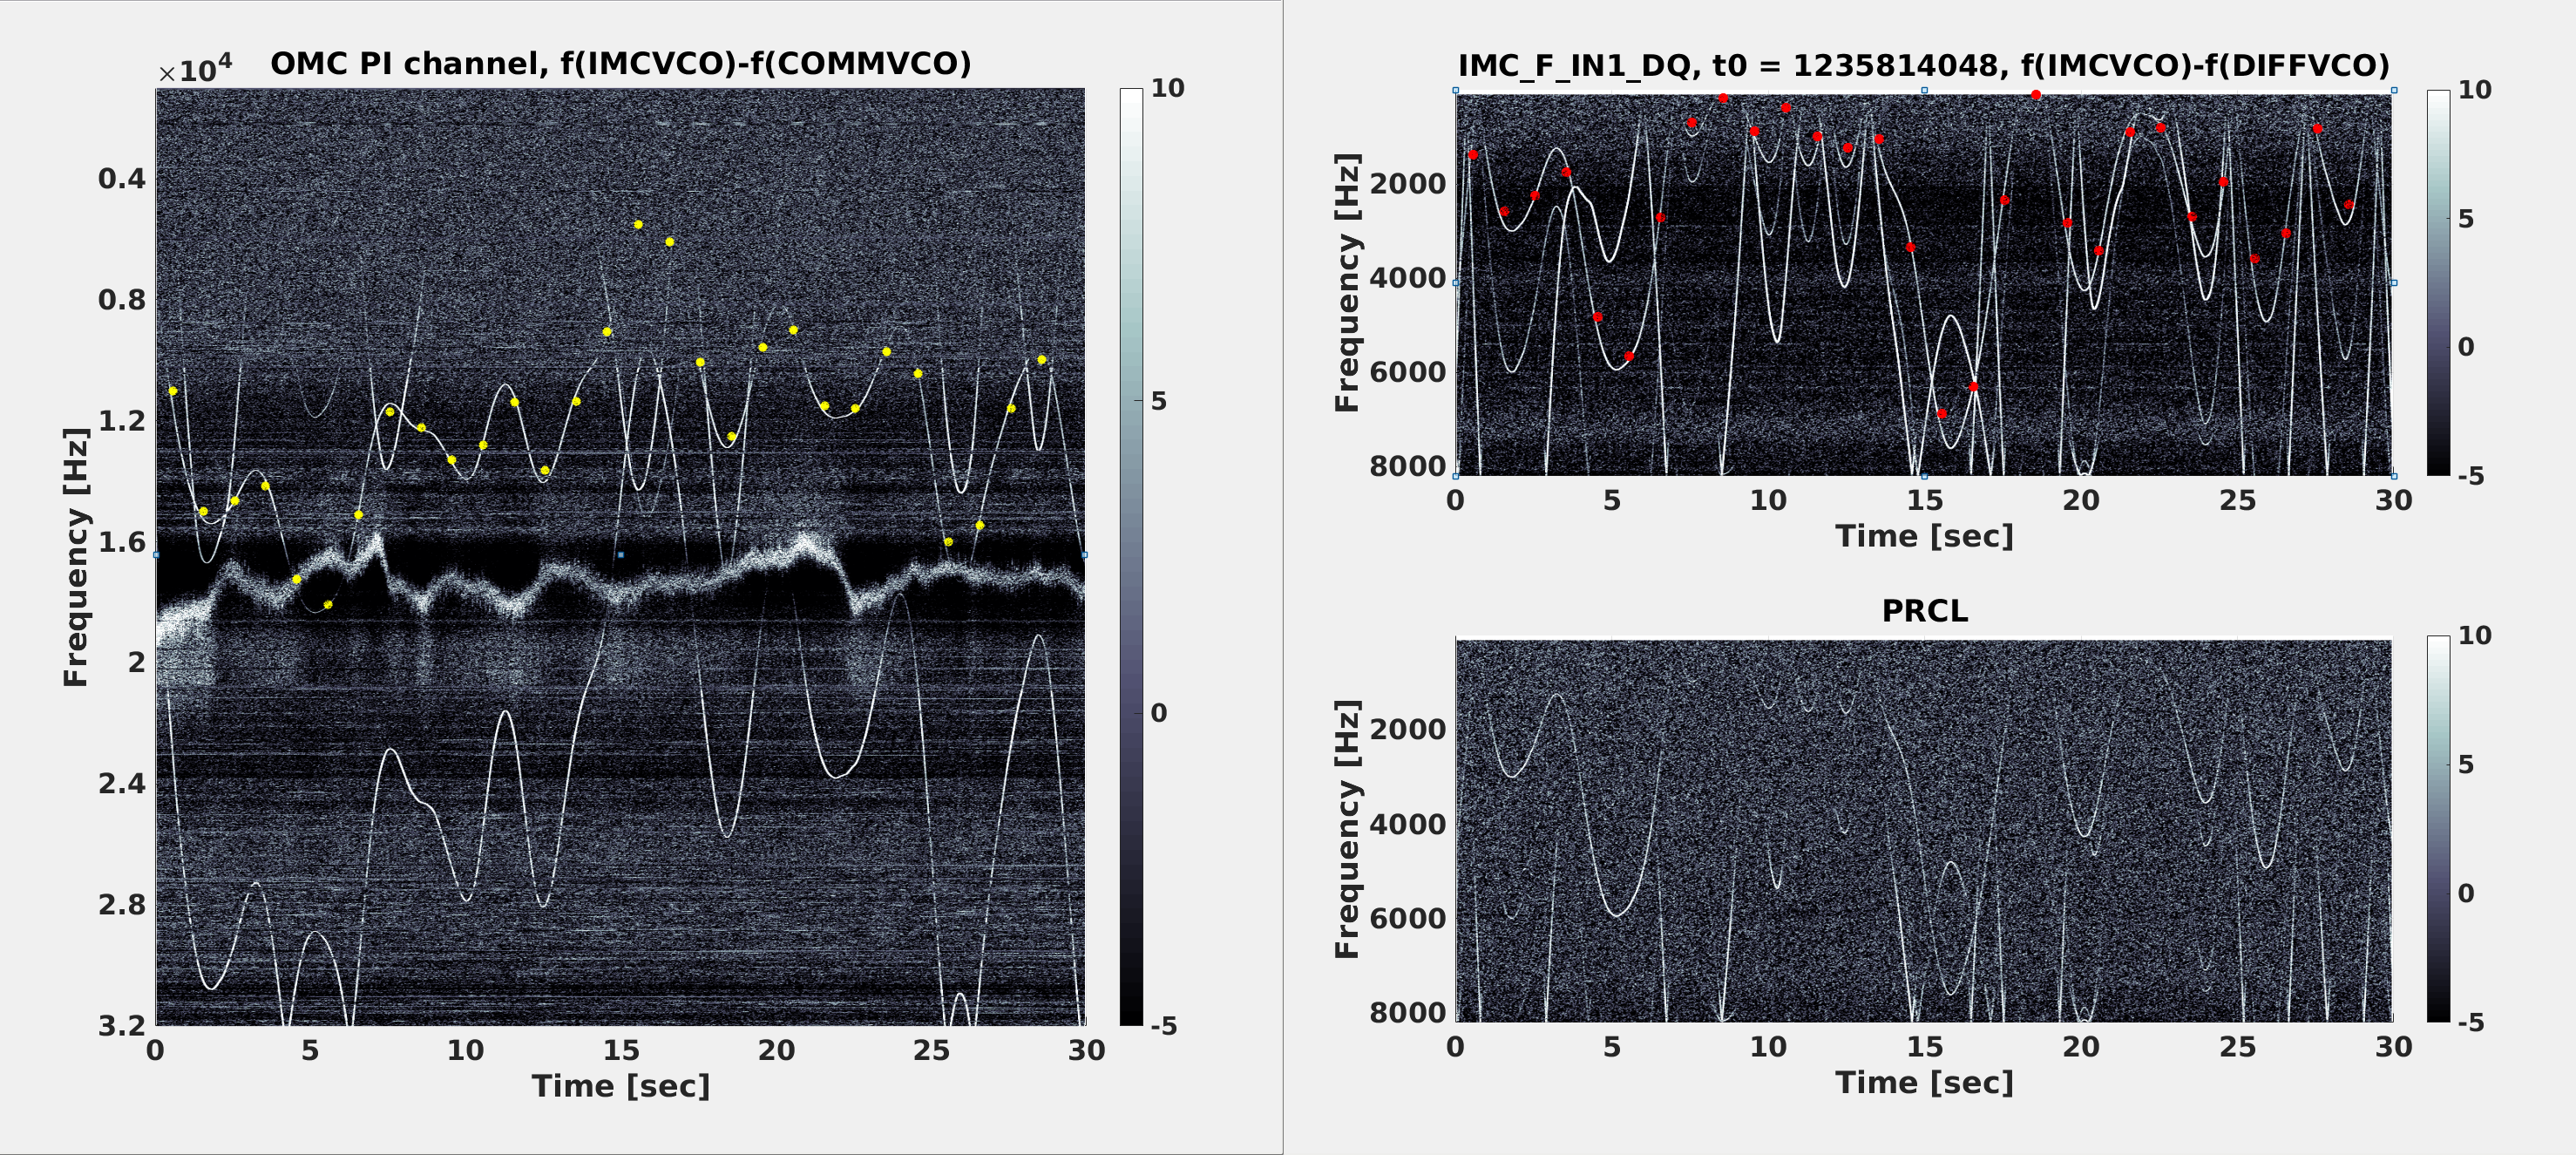
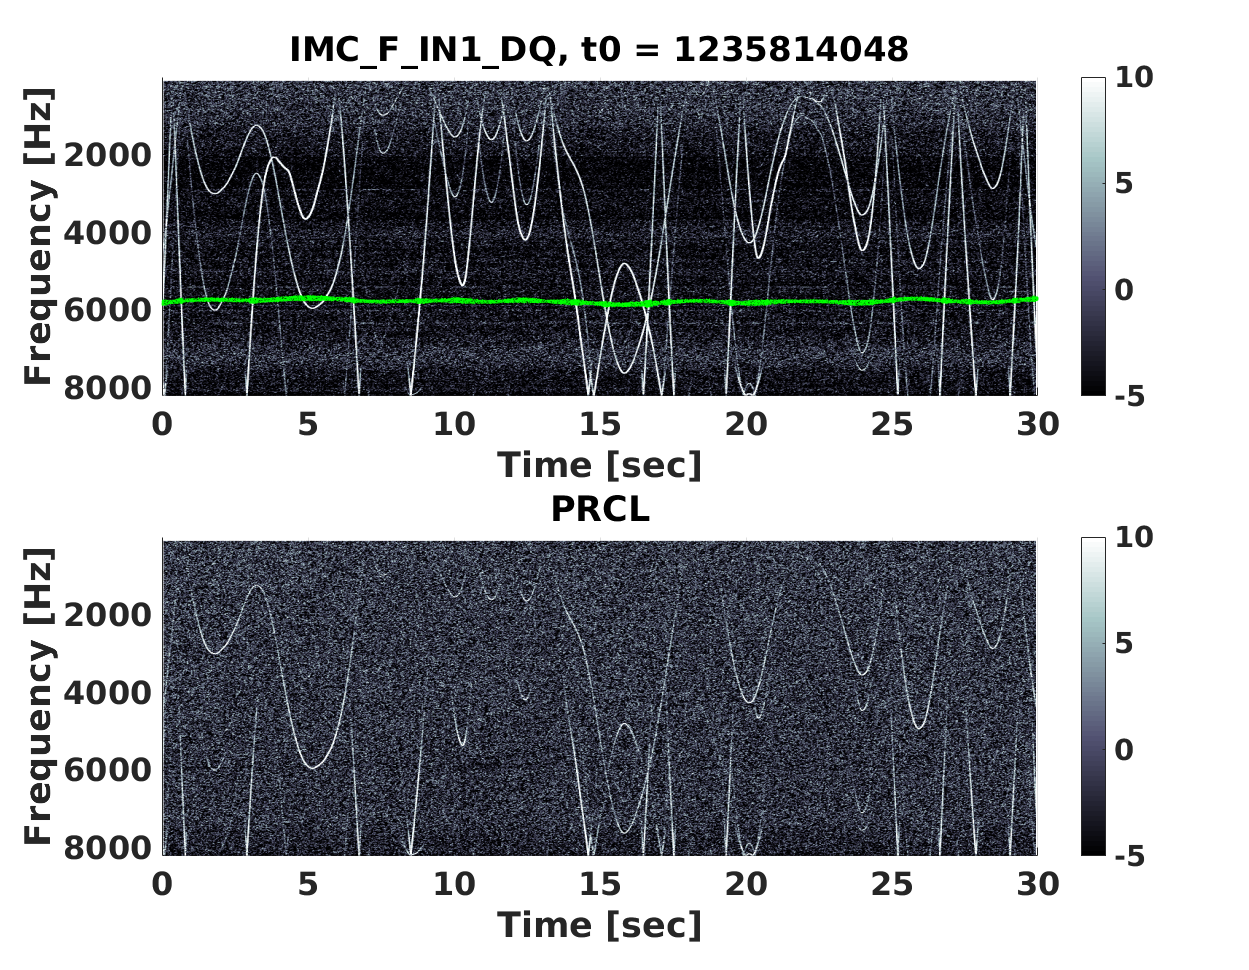
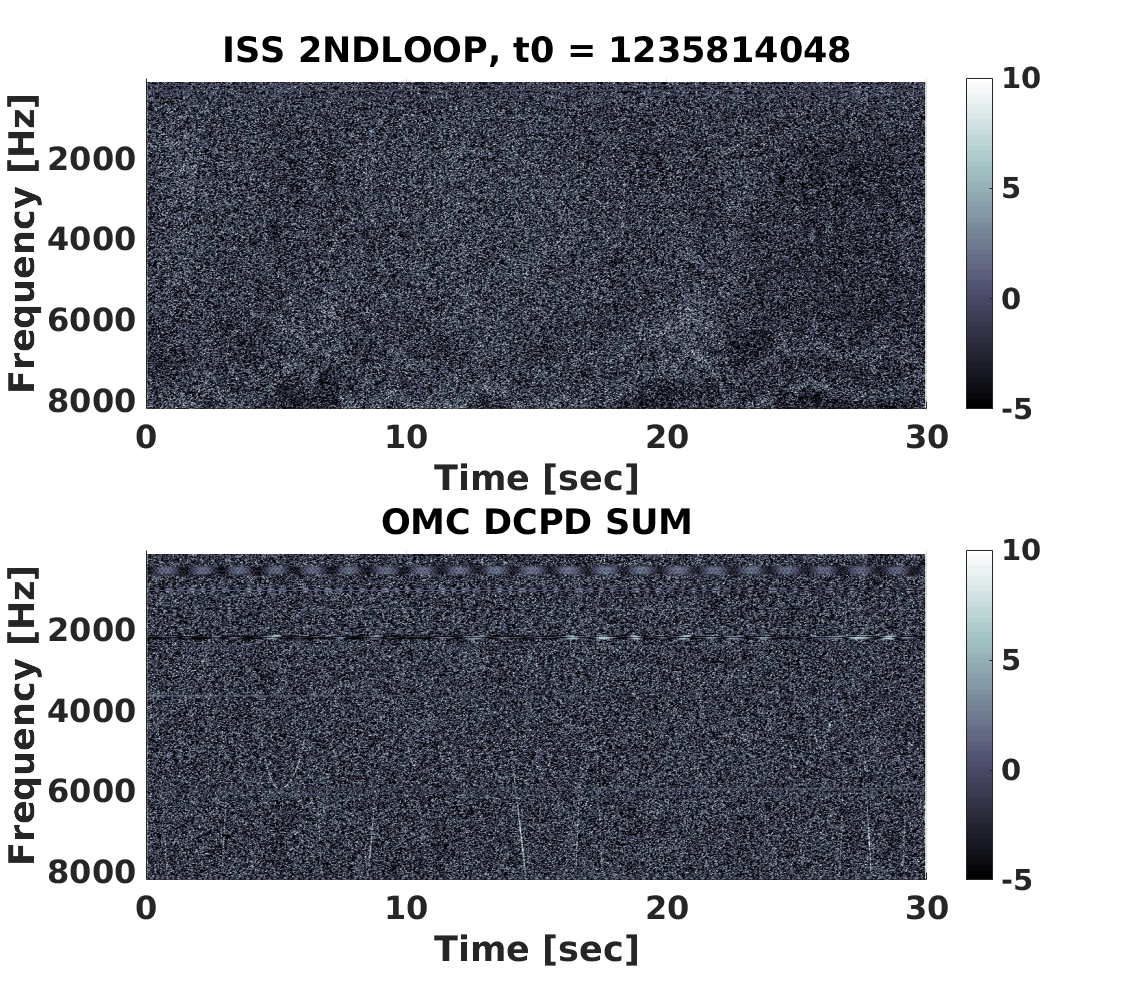
To aid the diagnosis of RF whistles (aka arches), I tried a matlab script that LLO has been using. It essentially just makes normalized spectrograms of channels that are good witnesses of the whistles. The attached plots are the outputs from running this script on data from last night's lock, around 10:00:00 UTC. The whistles/arches are clearly visible in the OMC PI (parametric instability) readout channel up to 32 kHz; they're also quite visible in IMC_F and PRCL (8 kHz and below). At this time the IMC VCO frequency was between 78.781 MHz and 78.794 MHz.
The script is 'look_for_arches.m', and is in: /ligo/home/peter.fritschel/Whistles/
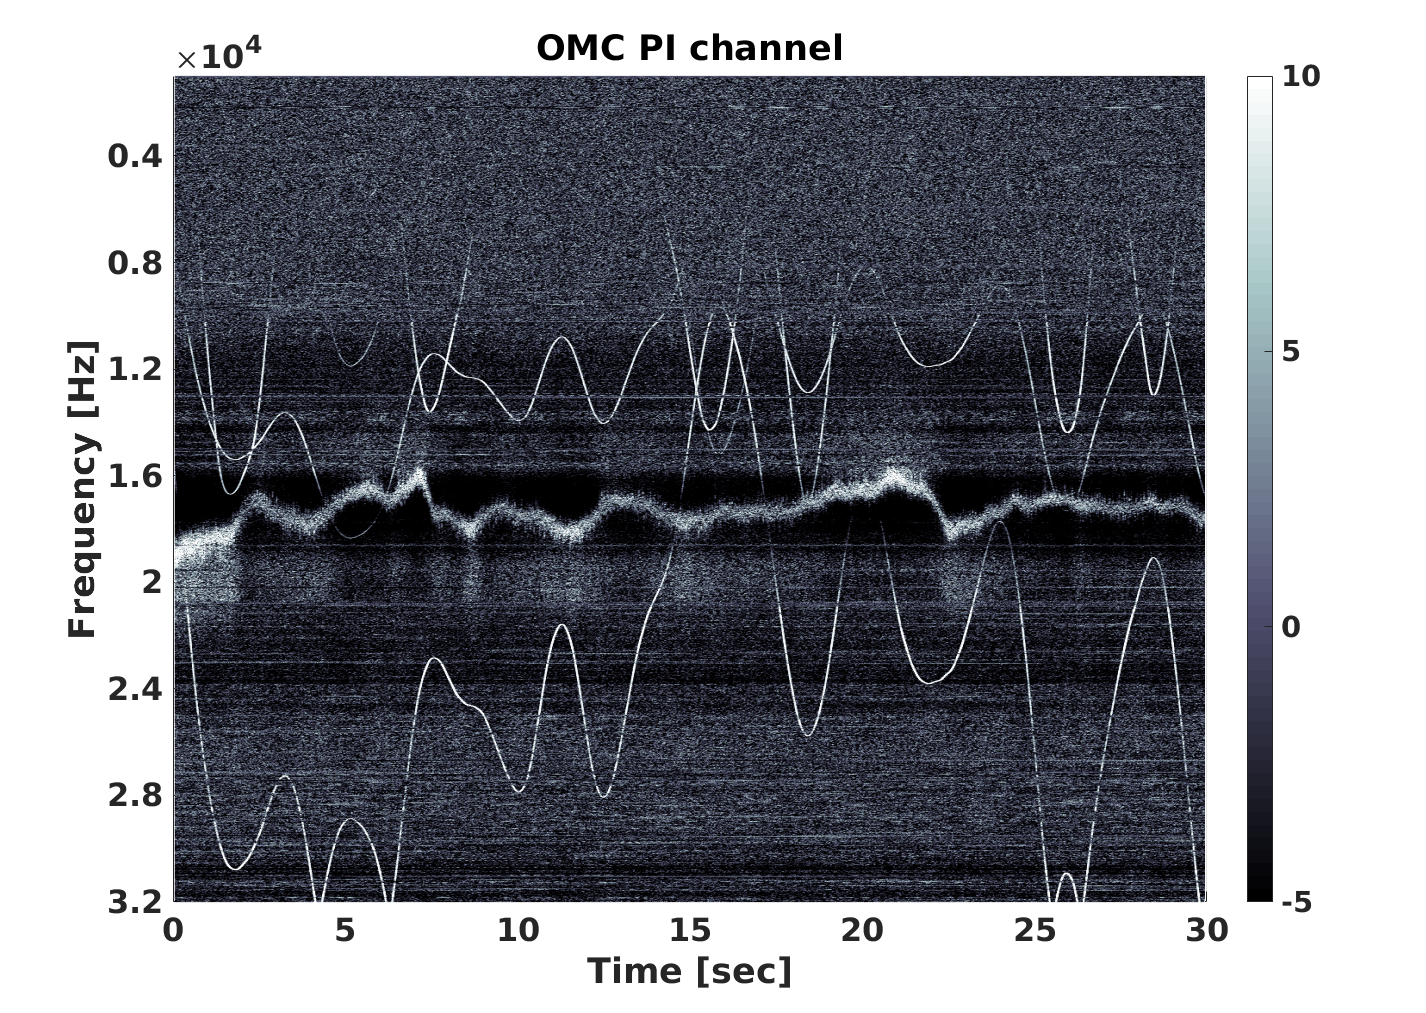
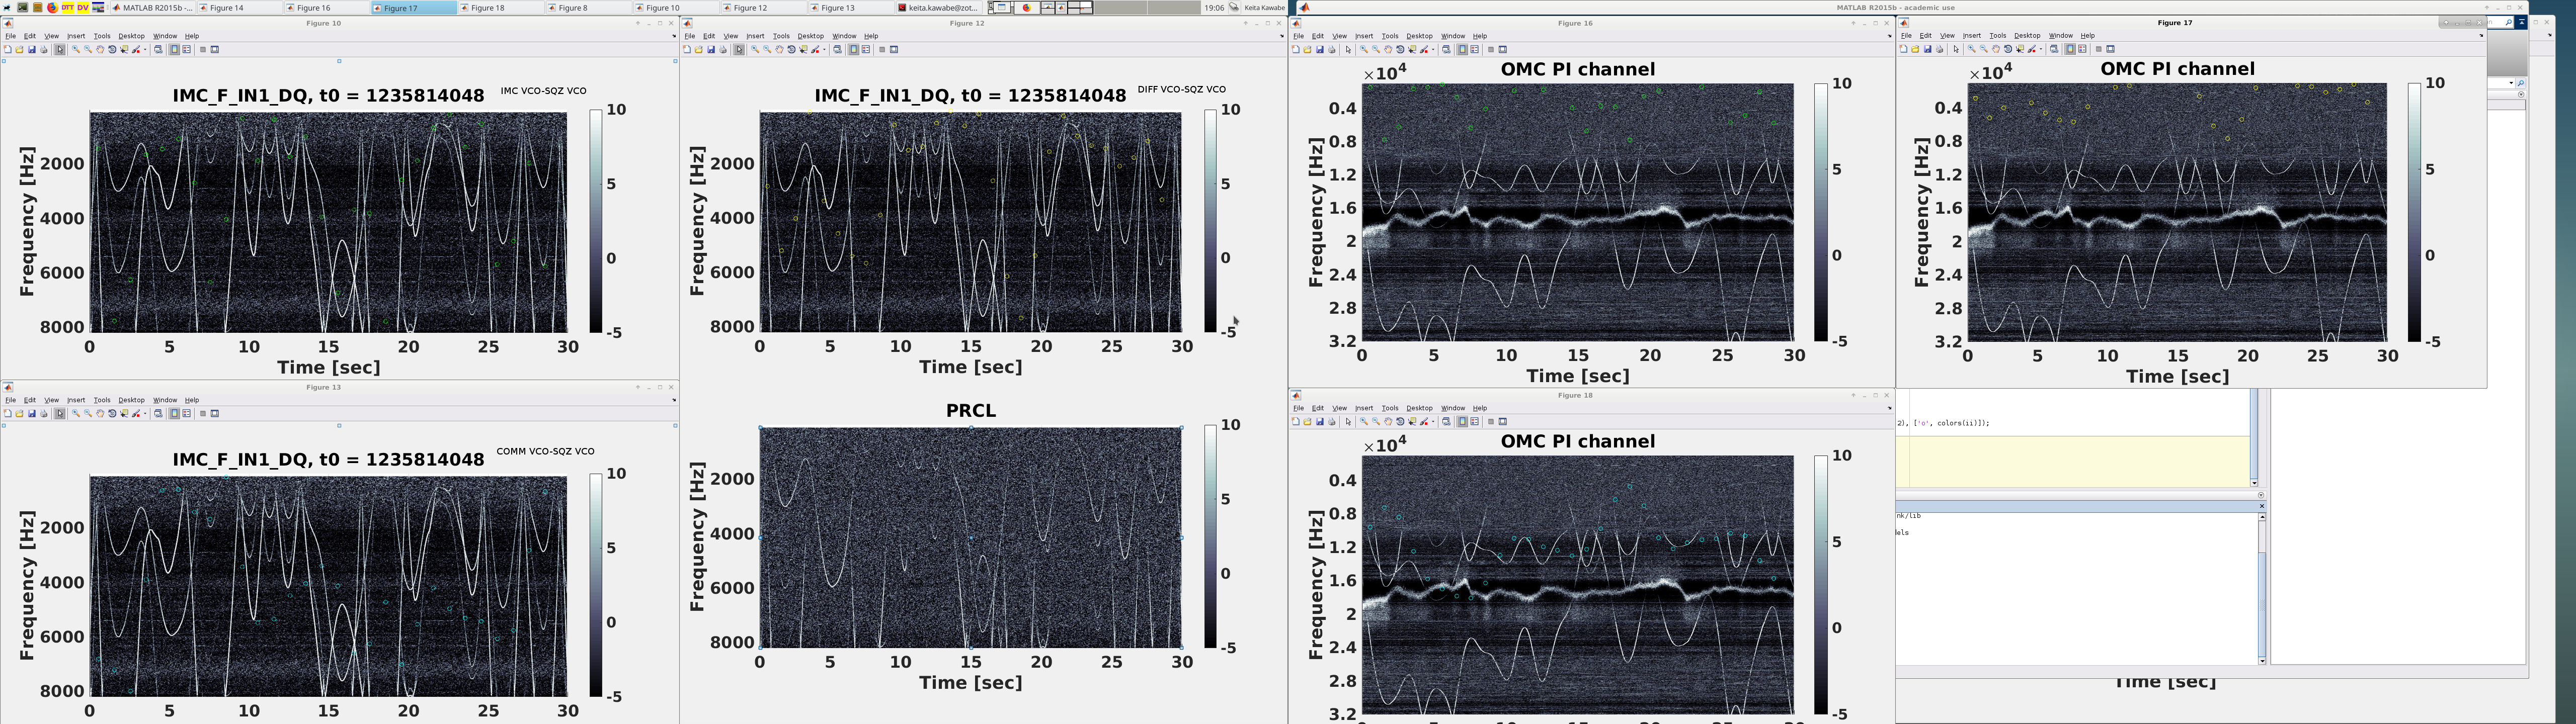
In the first attachment, left panel is the frequency difference between IMC VCO and COMM VCO (which is mostly higher than 8kHz) plotted on top of OMC PI channel spectrogram, and right panel is the difference between IMC VCO and DIFF VCO (lower than 8kHz) plotted on top of IMC_F spectrogram.
The agreement with one of the whistle trace is pretty good.
In the second attachment, IMCVCO - SQZVCO (green), diffVCO-SQZVCO (yellow) and commVCO-SQZVCO (cyan) might be correlated to weaker whistles in IMC_F but it's not as clear as IMC VCO and COMM or DIFF. These guys didn't look good on OMC PI channel.
What was done:
I took all available RF oscillator frequencies in the timing system and made differences between them. I discarded combinations that doesn't produce anything lower than 24kHz.
Anything larger than 8192Hz is aliased in the plotting on IMC_F, using 16384Hz sampling rate (but the only thing that was aliased is IMC-COMM).
Frequency counter measures the frequency once per second even though the channels are updated at 16Hz, so I just took the time stamp of the first updated value as the representative of the averaged frequency for the previous 1 second. Time axis was shifted by 0.5 sec due to this.