travis.sadecki@LIGO.ORG - posted 08:44, Monday 11 March 2019 (47422)
Optical Lever 7 Day Trends
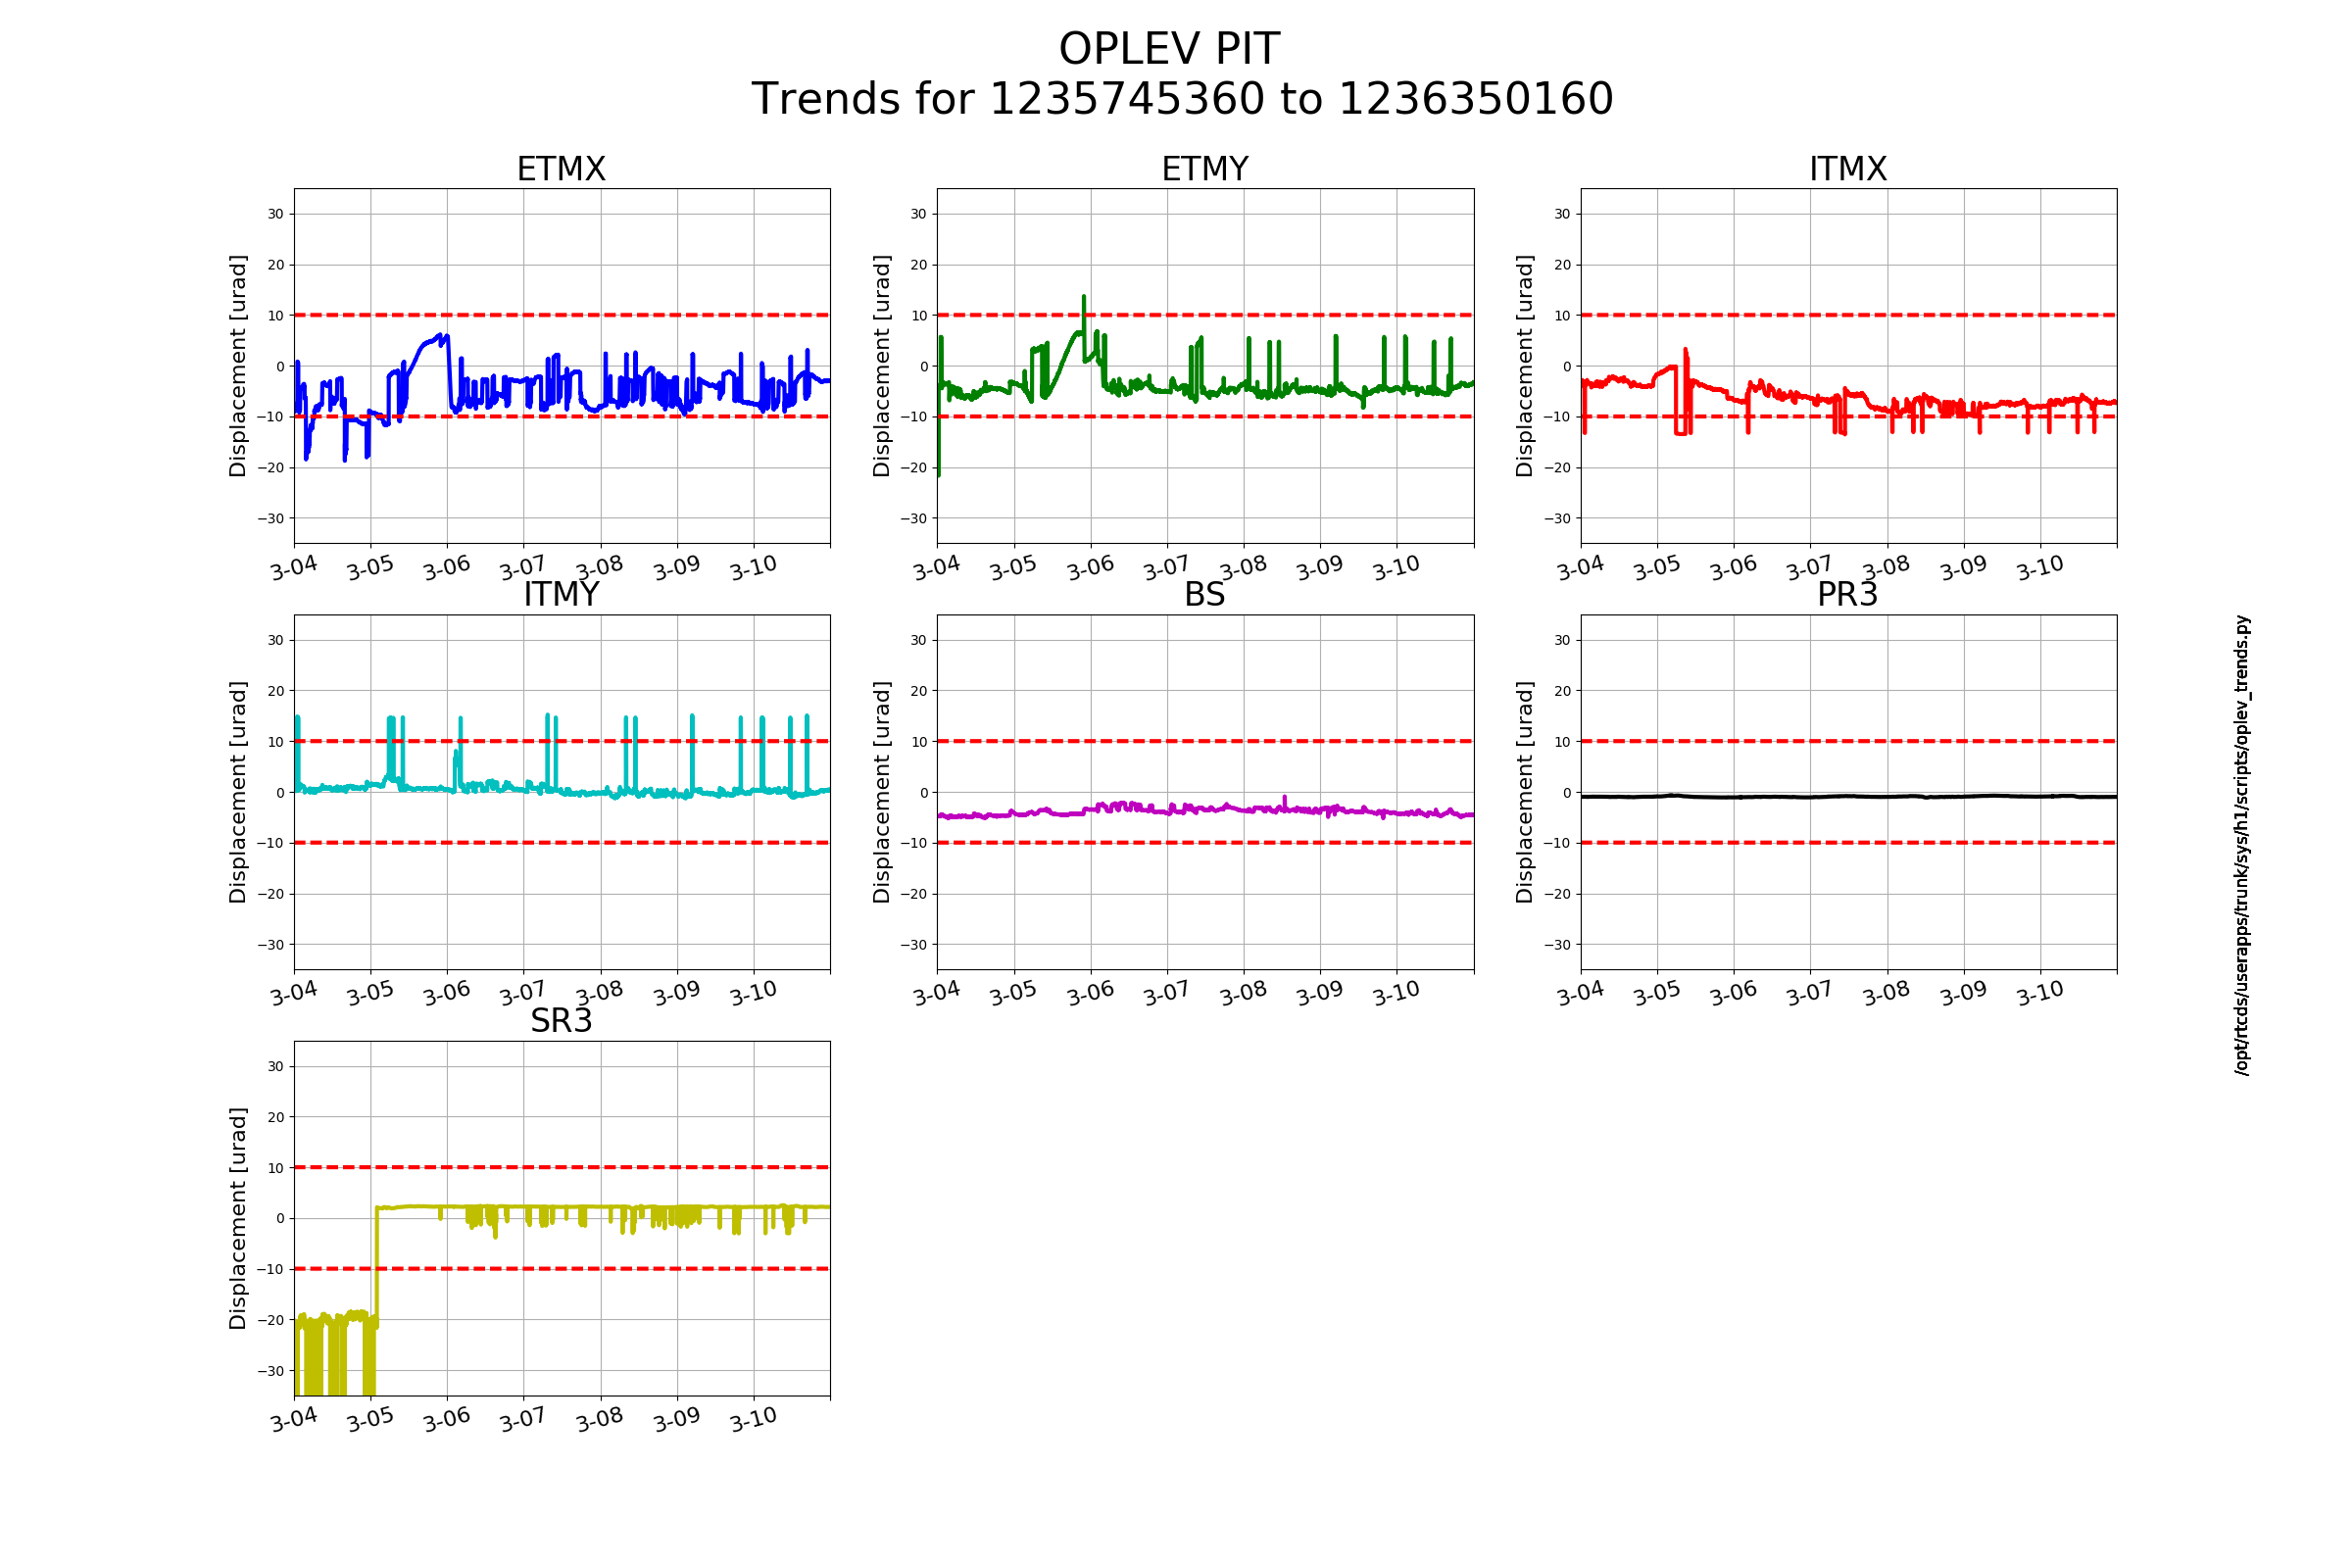
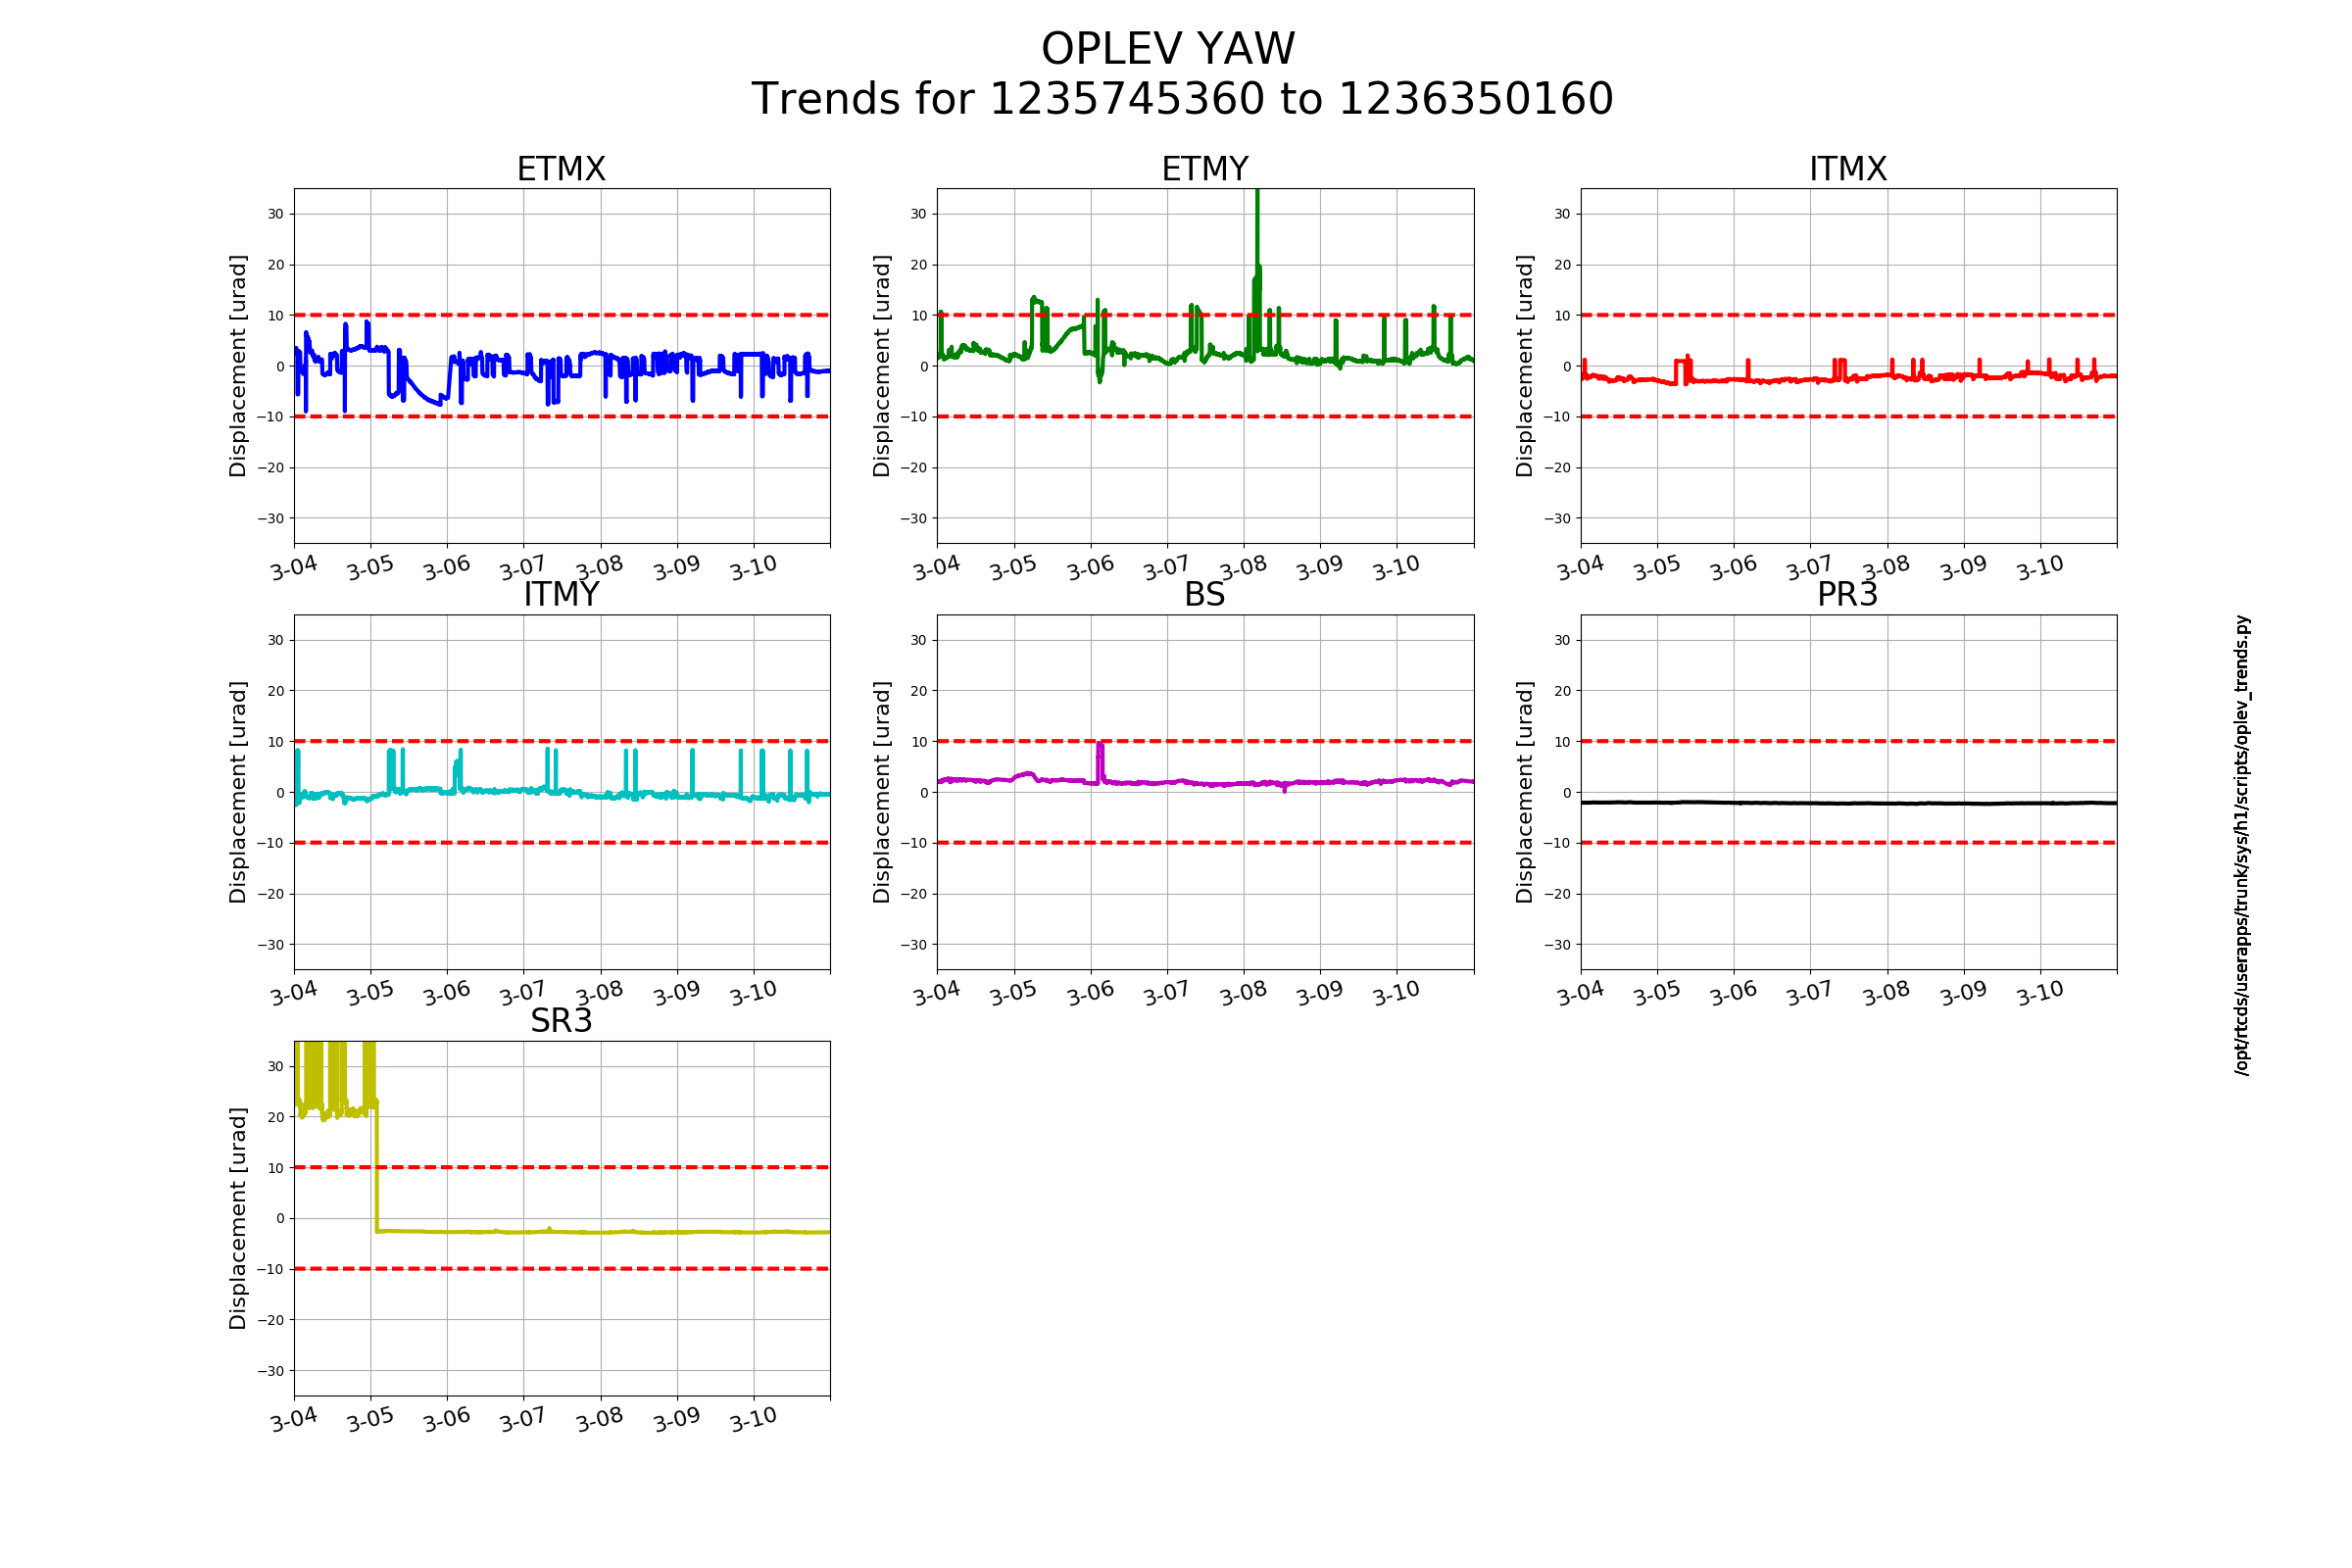
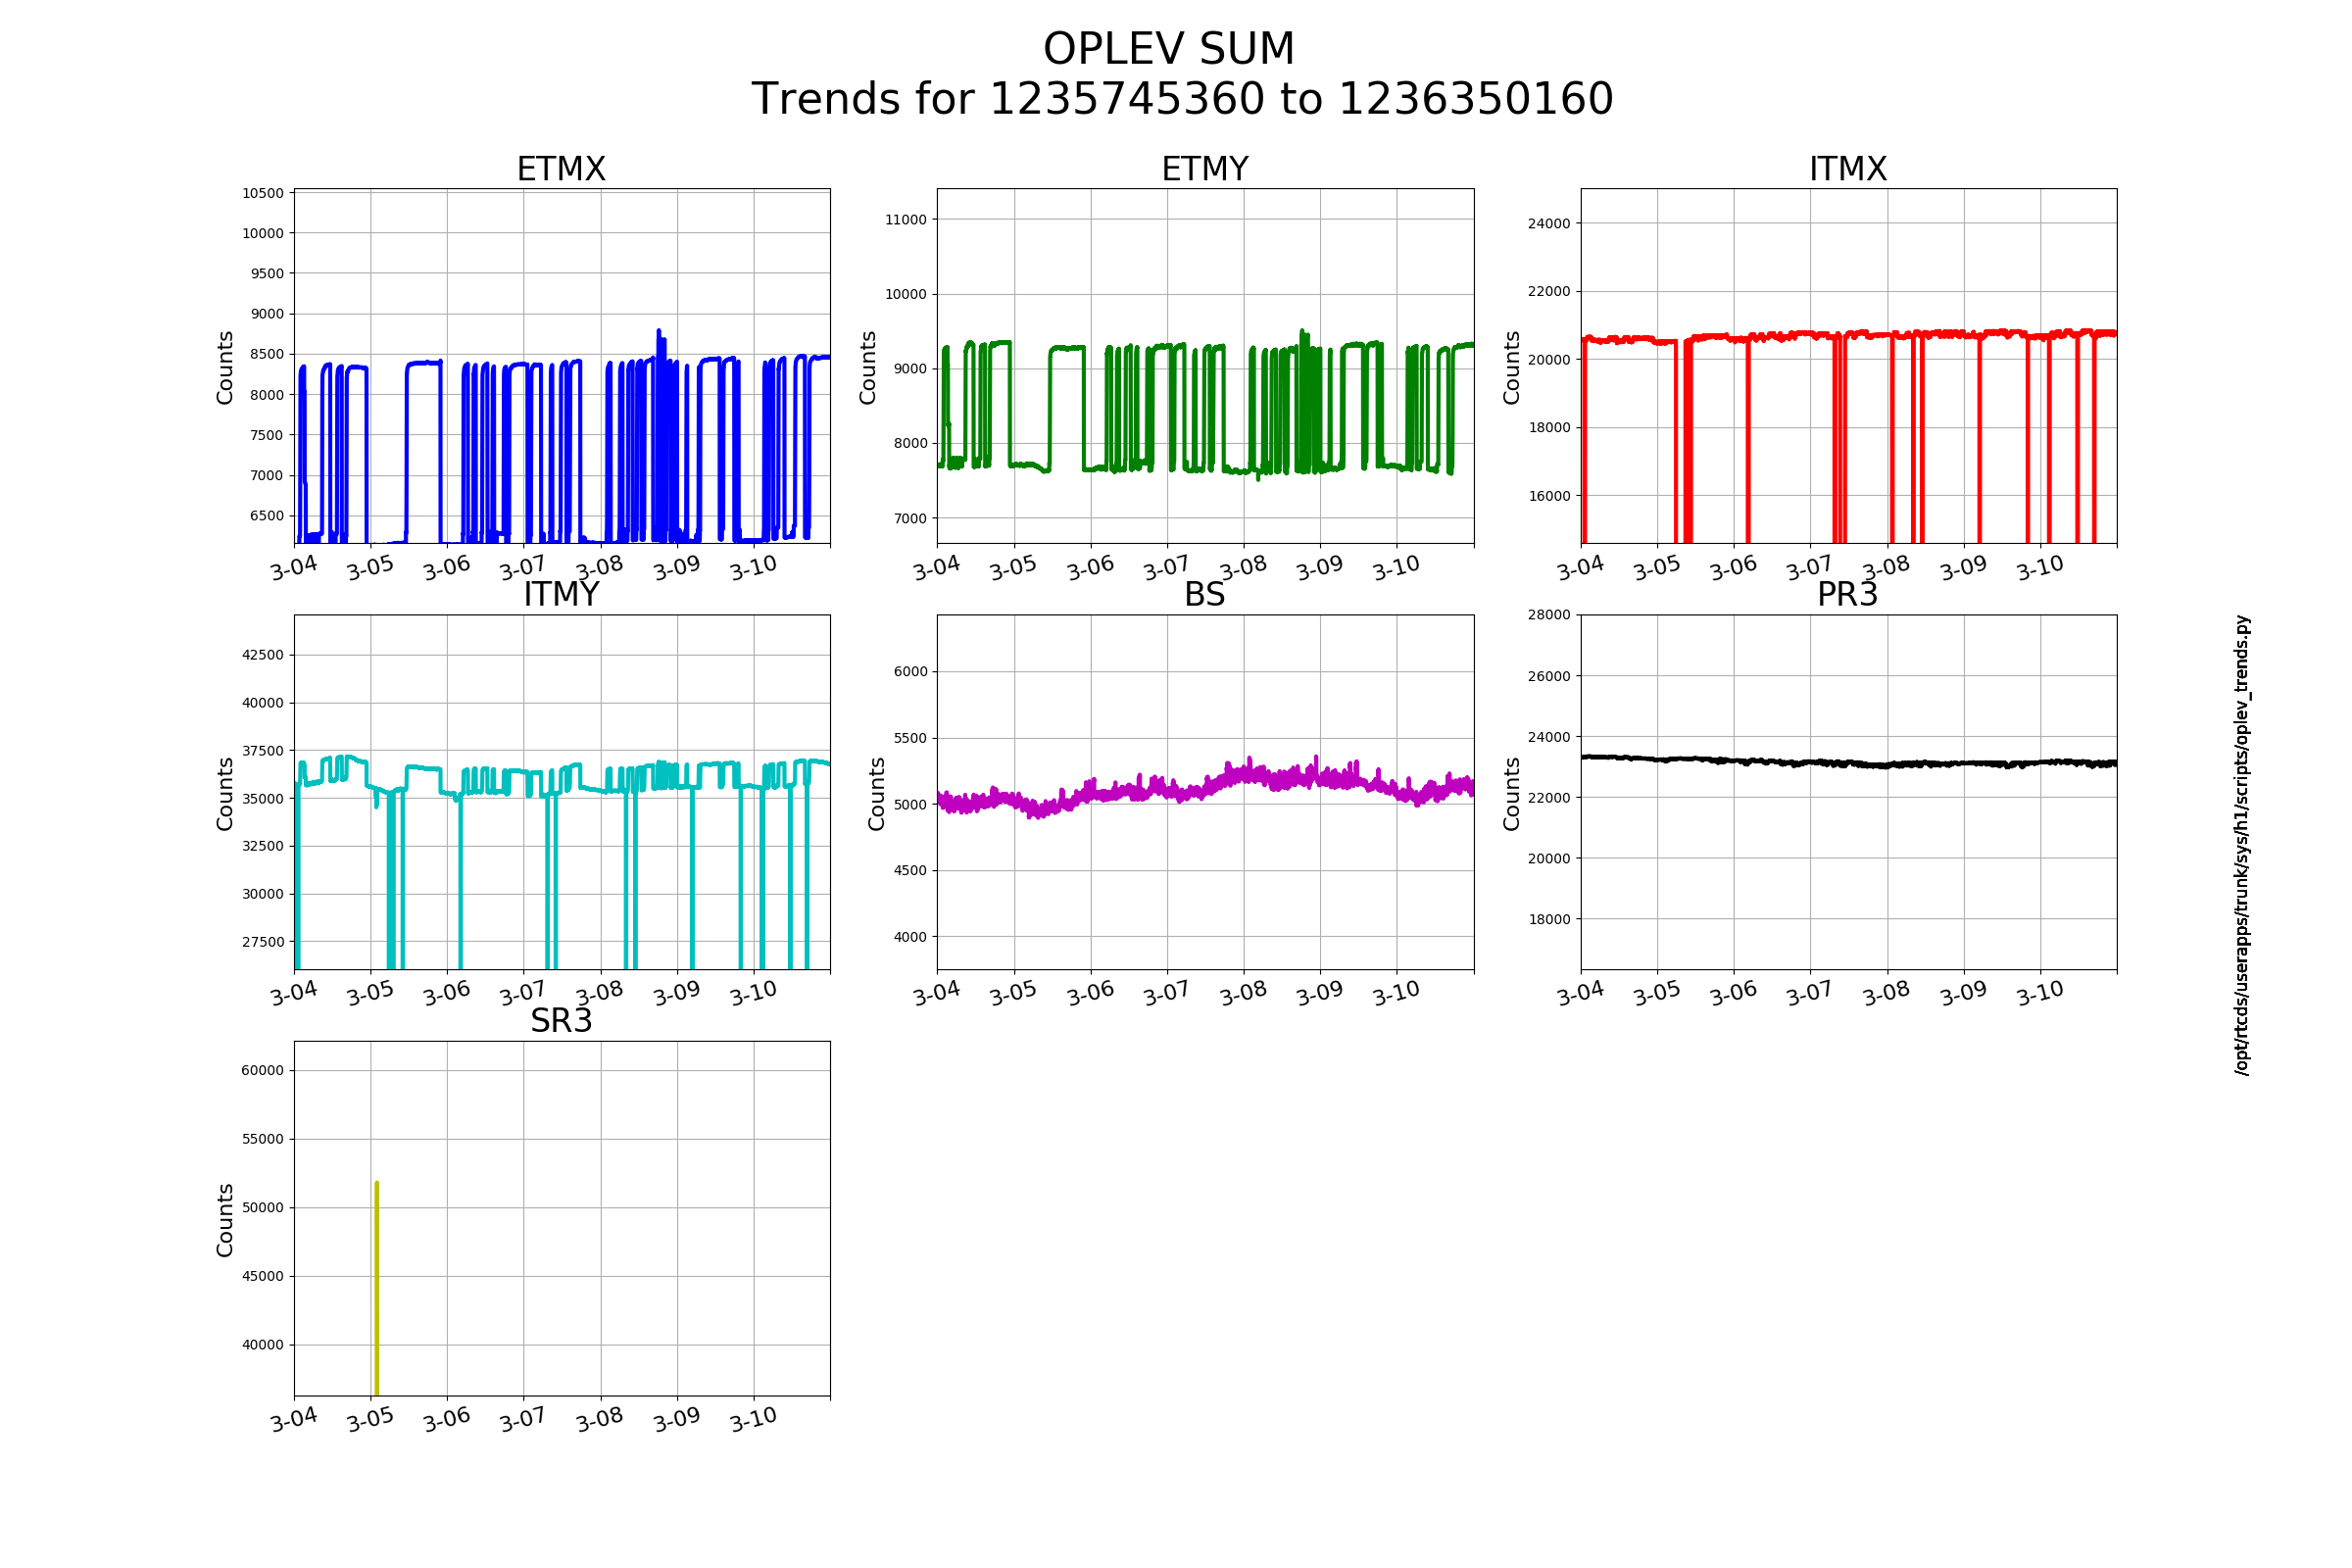
Pitch and yaw values for all OpLevs are within the +/- 10 counts acceptable range. The sum value for SR3 is mostly off-plot, with the exception of one spike. Since these plots are now generated by a python script, rather than Dataviewer, there are no plotting controls to recenter/rezoom these plots after they are created. Is there an easy solution to this, or will the script need some retooling?
Also, the FAMIS procedure for this task could be updated, namely 1d which instructs us to take screenshots of the plots. This is no longer necessary since the plots are automatically saved as .png files to the desktop.
FAMIS 11208
Images attached to this report