I used the script that Joe B adapted from Shivaraj (44473) to look at data from a broadband injection that Craig did using PCAL Y last night.
The script used is attached, it is also in aligocalibration/trunk/Runs/O3/H1/Scripts/CALCS_FE As Joe said it is only correcting DELTAL for the whitening, and multiplying GDS calib strain by the arm length to calibrate it into displacement.
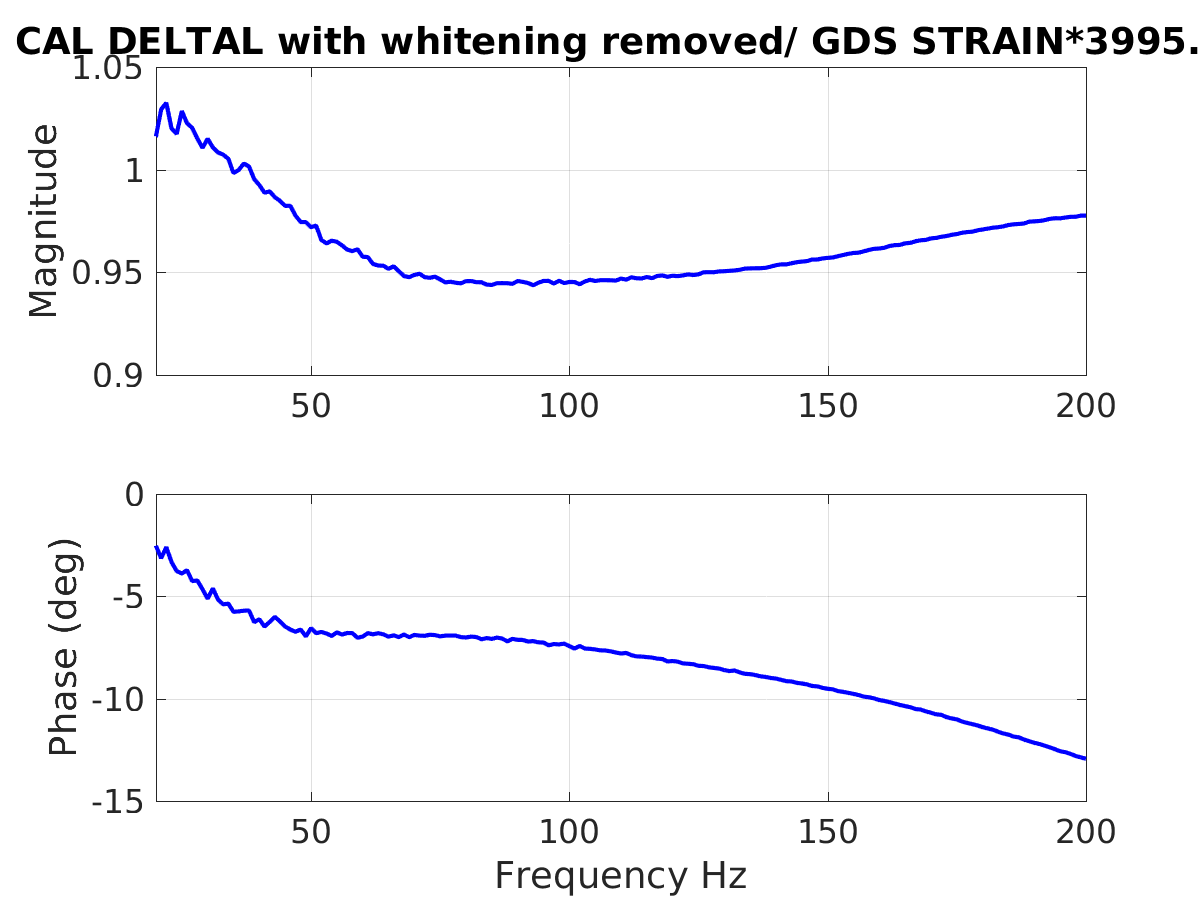
The sign of the GDS strain channel agrees with the sign of CAL DELTAL. (First attachment).
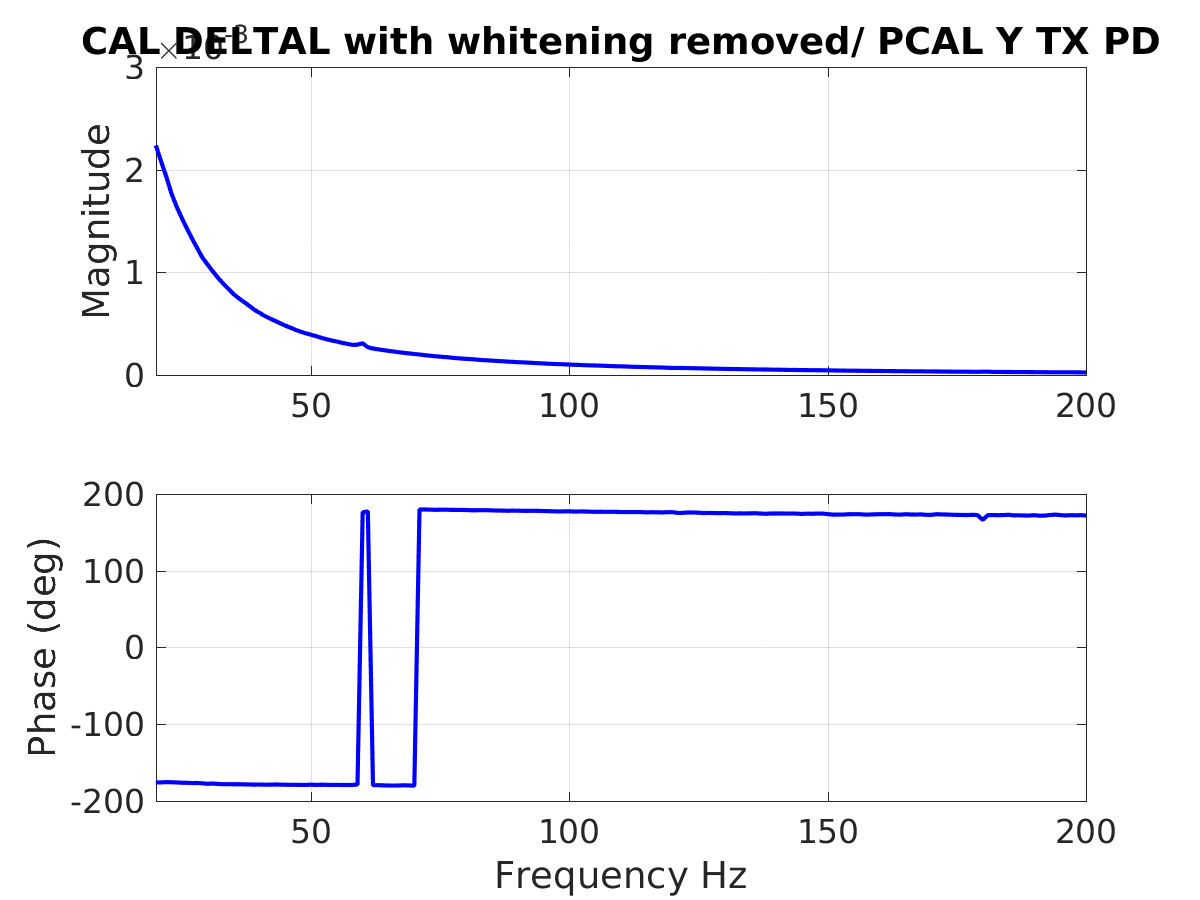
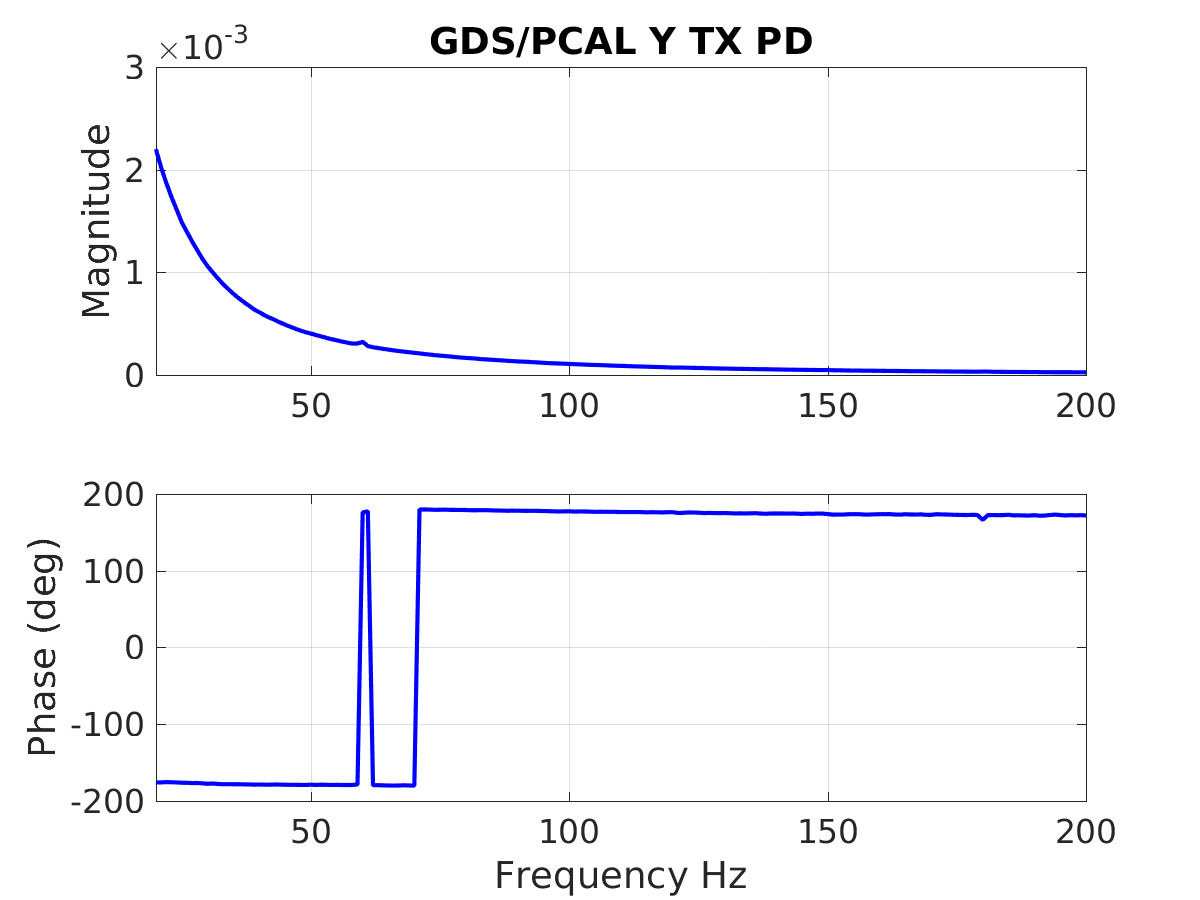
The sign of both CAL DELTAL and GDS calib strain are wrong (second and third attachments). Craig is injecting on PCAL Y: at DC applying pressure to the highly reflective surface of the optic makes the Y arm longer, which make DARM more negative. We are making this measurement at frequencies above the suspension resonances, which give a 180 degree phase shift. So, if the sign of the calibration were correct, the phase between PCALY excitation and DARM should be 0 degrees. Since we are measuring 180 degrees for both DELTAL and GDS calib strain, we flipped the sign.
We flipped the sign in the inverse sensing function gain, and the actuation sign we flipped for each stage in the CAL CS TM_OUTPUT_MTRX. The sign was flipped at 23:02 UTC March 21st.
This undoes the sign flip from 47574. Since we still think that the logic that led us to flip the "arm sign" filter was correct and it is in agreement with the calibration groups documentation of their sign convention, we are leaving the "arm sign" as -1 for the x arm and +1 for the y arm.

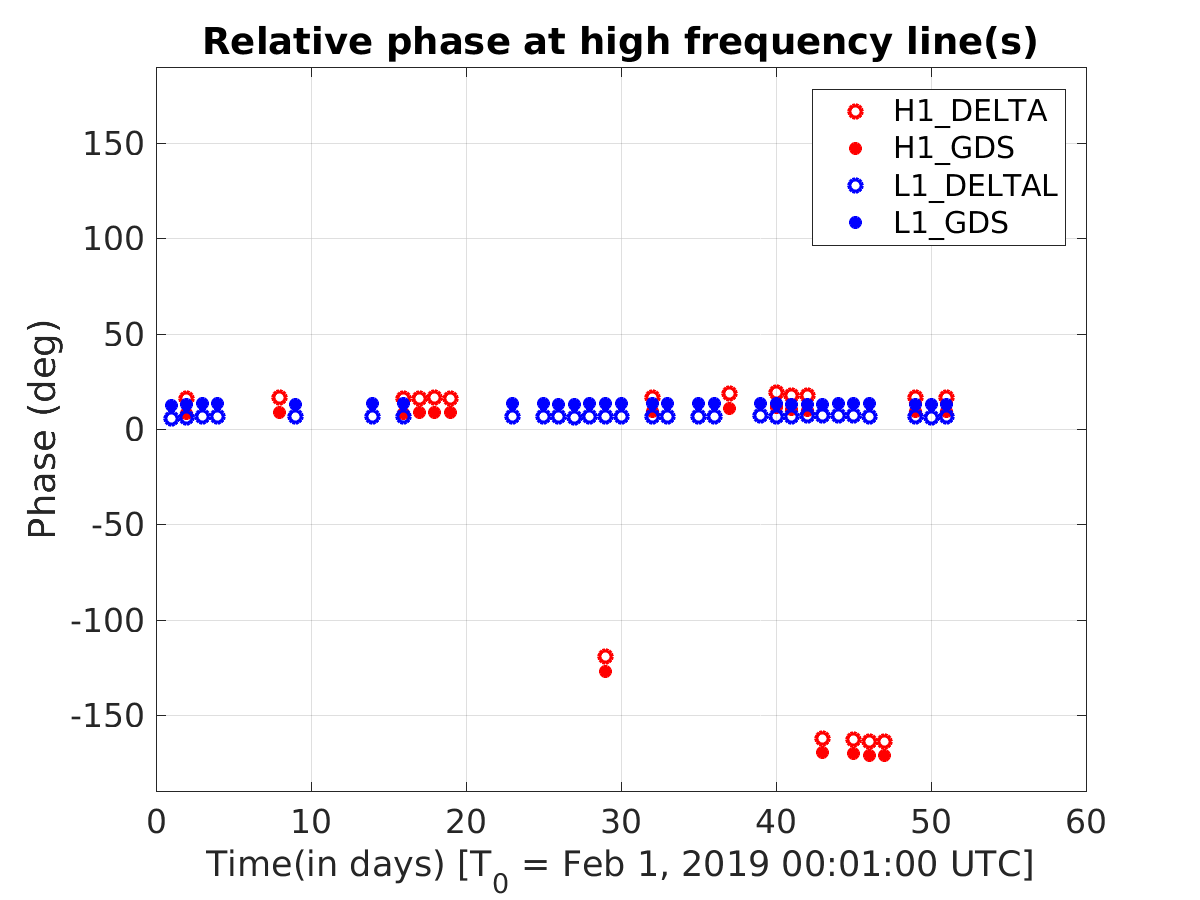
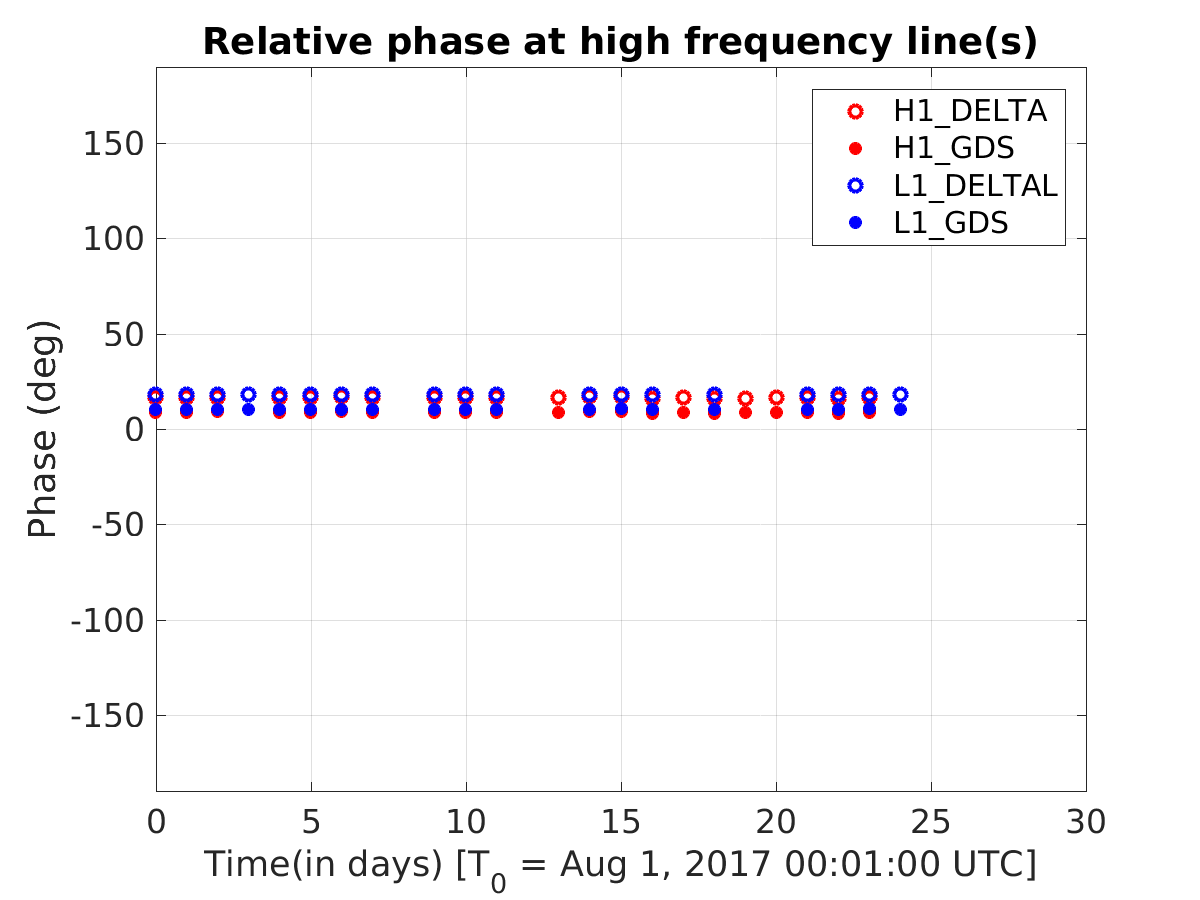
The first attached plot shows the trend of relative phases between PCAL & DELTAL and PCAL & GDS since February 1, 2019 to till date. I sampled one data point per day (at 00:01:00 UTC) and also kept only those points during which the IFO was in low noise. In the plot, I have plotted both H1 and L1 for comparison purposes. I have also added a plot (second png) showing similar comparison during end of O2. These plots suggest that the current sign of both detectors follow the expected sign convention of Lx-Ly. In the first plot we can also see the interim change in the sign of H1 that happened a few weeks ago. I have used the same code base as in the above alog, but just looked at the relative phase at high frequency calibration lines (the ones used for calculating sensing function).
Note: The line frequencies were changed at LLO between O2 and O3 and hence we expect to see small differences due to that.
These changes were accepted into CAL-CS safe.snap, namely,

H1:CAL-CS_DARM_ERR_GAIN = 1.03

H1:CAL-CS_DARM_TM_OUTPUT_MTRX_2_2 = -1.0     (ETMX UIM to dL_UIM)
H1:CAL-CS_DARM_TM_OUTPUT_MTRX_3_3 = -1.0     (ETMX PUM to dL_PUM)
H1:CAL-CS_DARM_TM_OUTPUT_MTRX_4_4 = -1.0     (ETMX TST to dL_TST)

We're still working on the documentation to make sense of all this sign stuff.