cheryl.vorvick@LIGO.ORG - posted 16:14, Monday 25 March 2019 (47845)
CAL-DELTA coh. with IMs below 60Hz
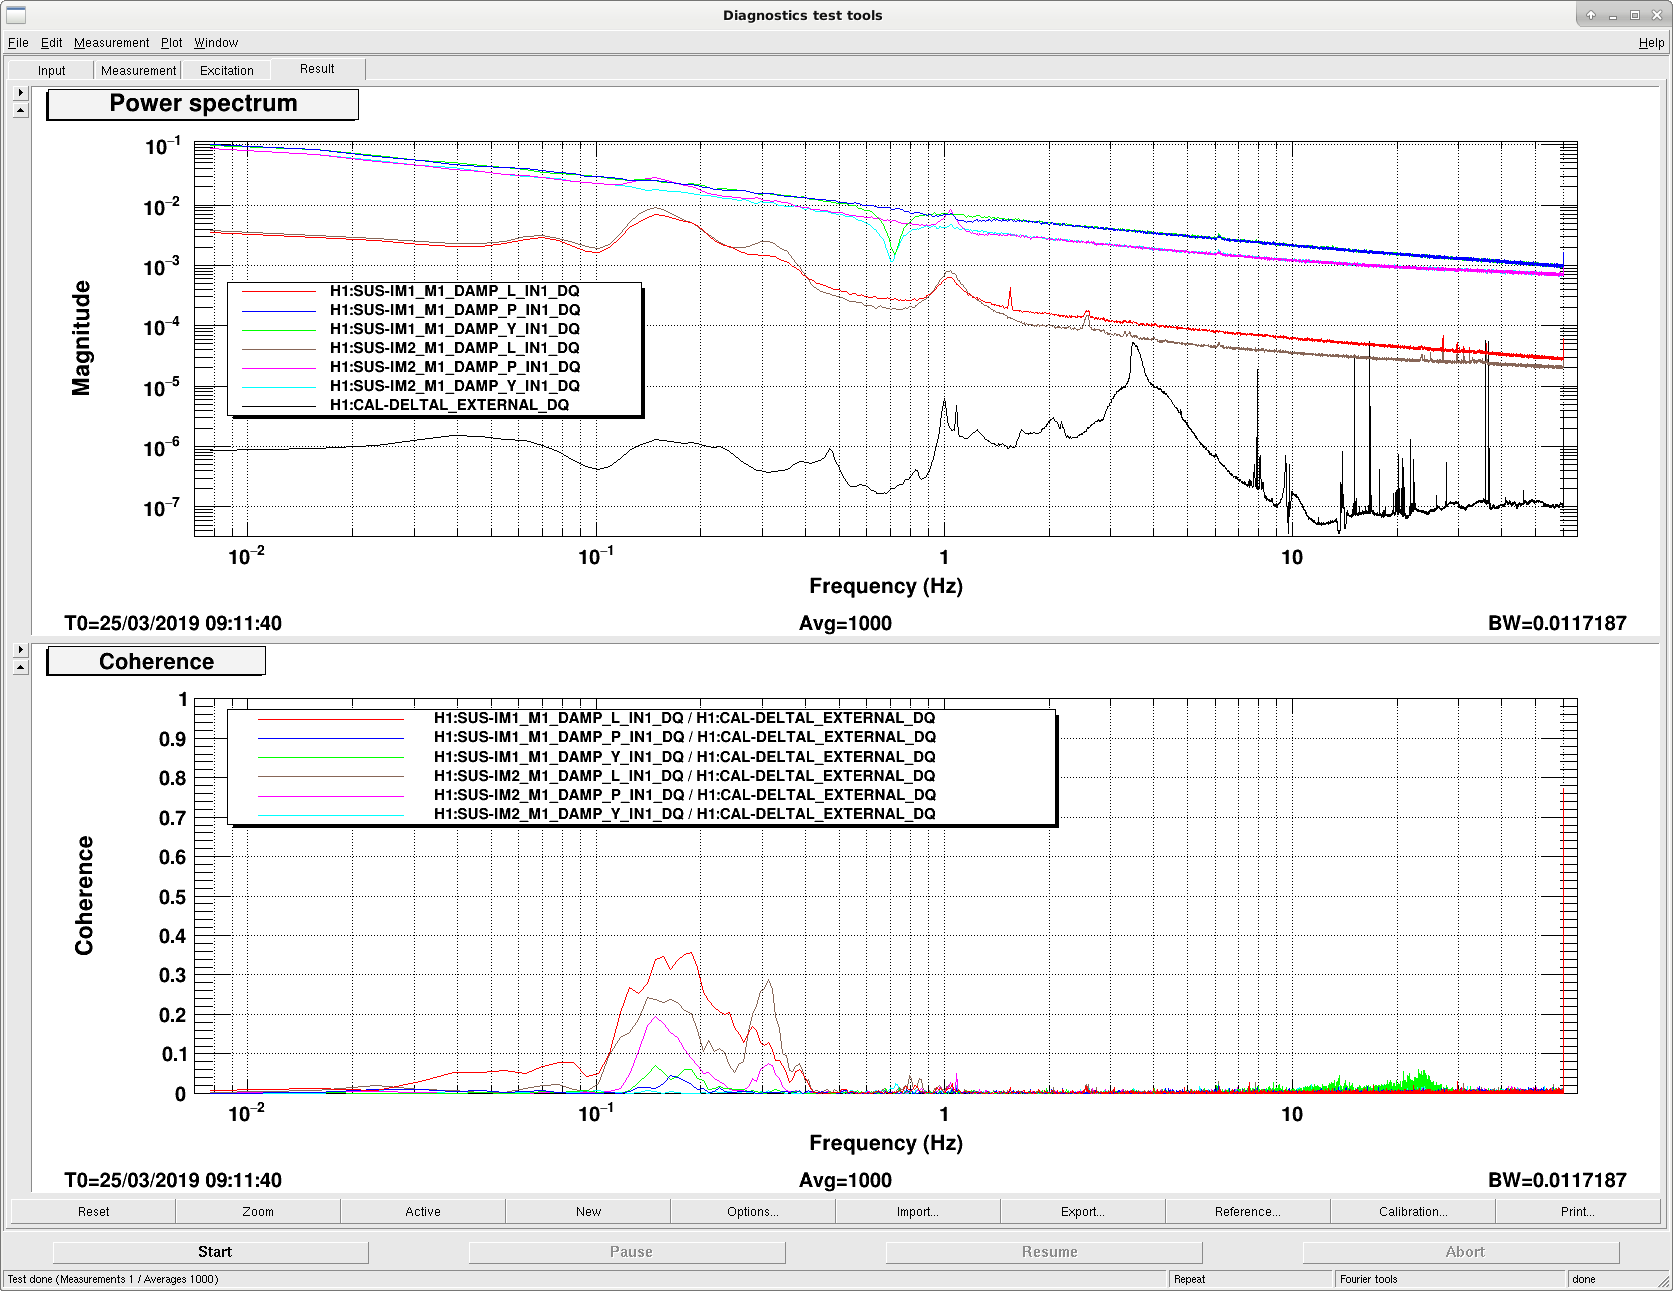
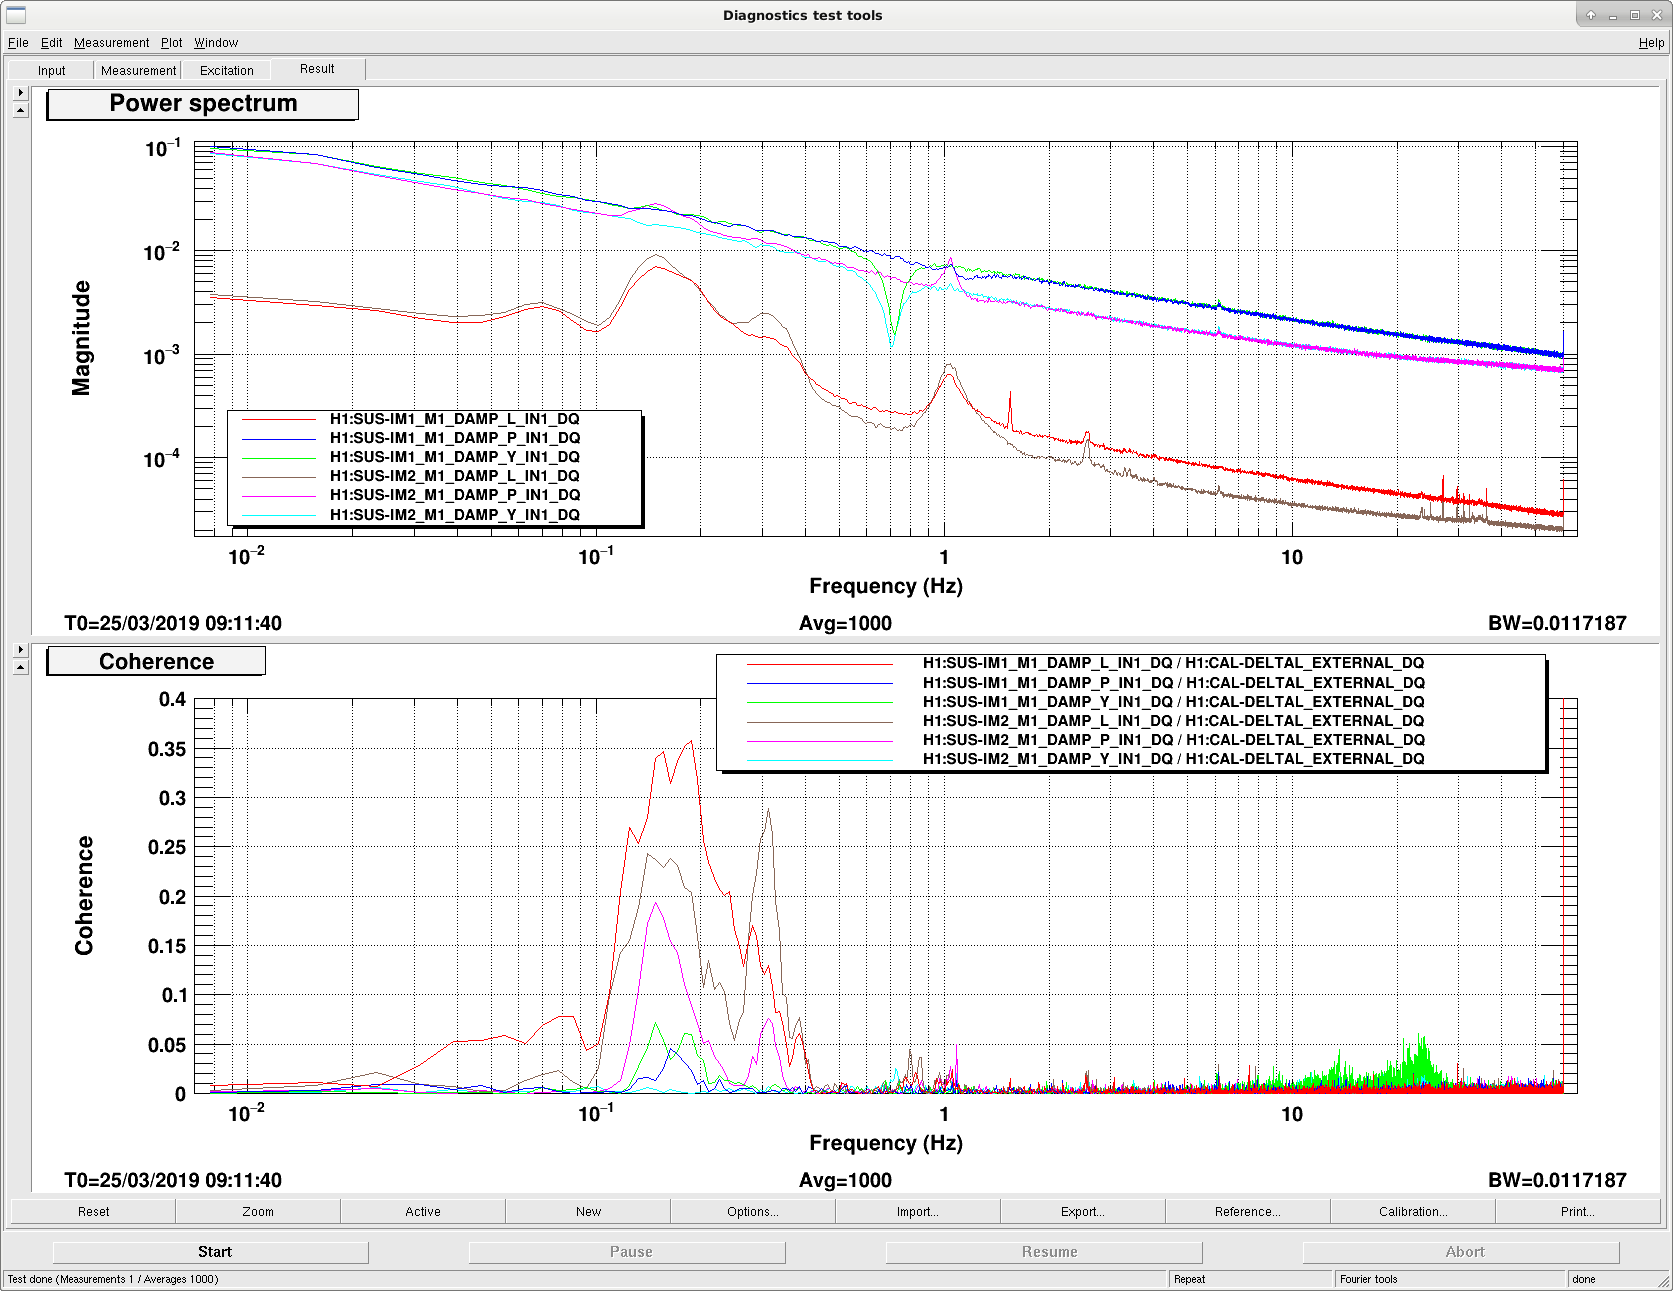
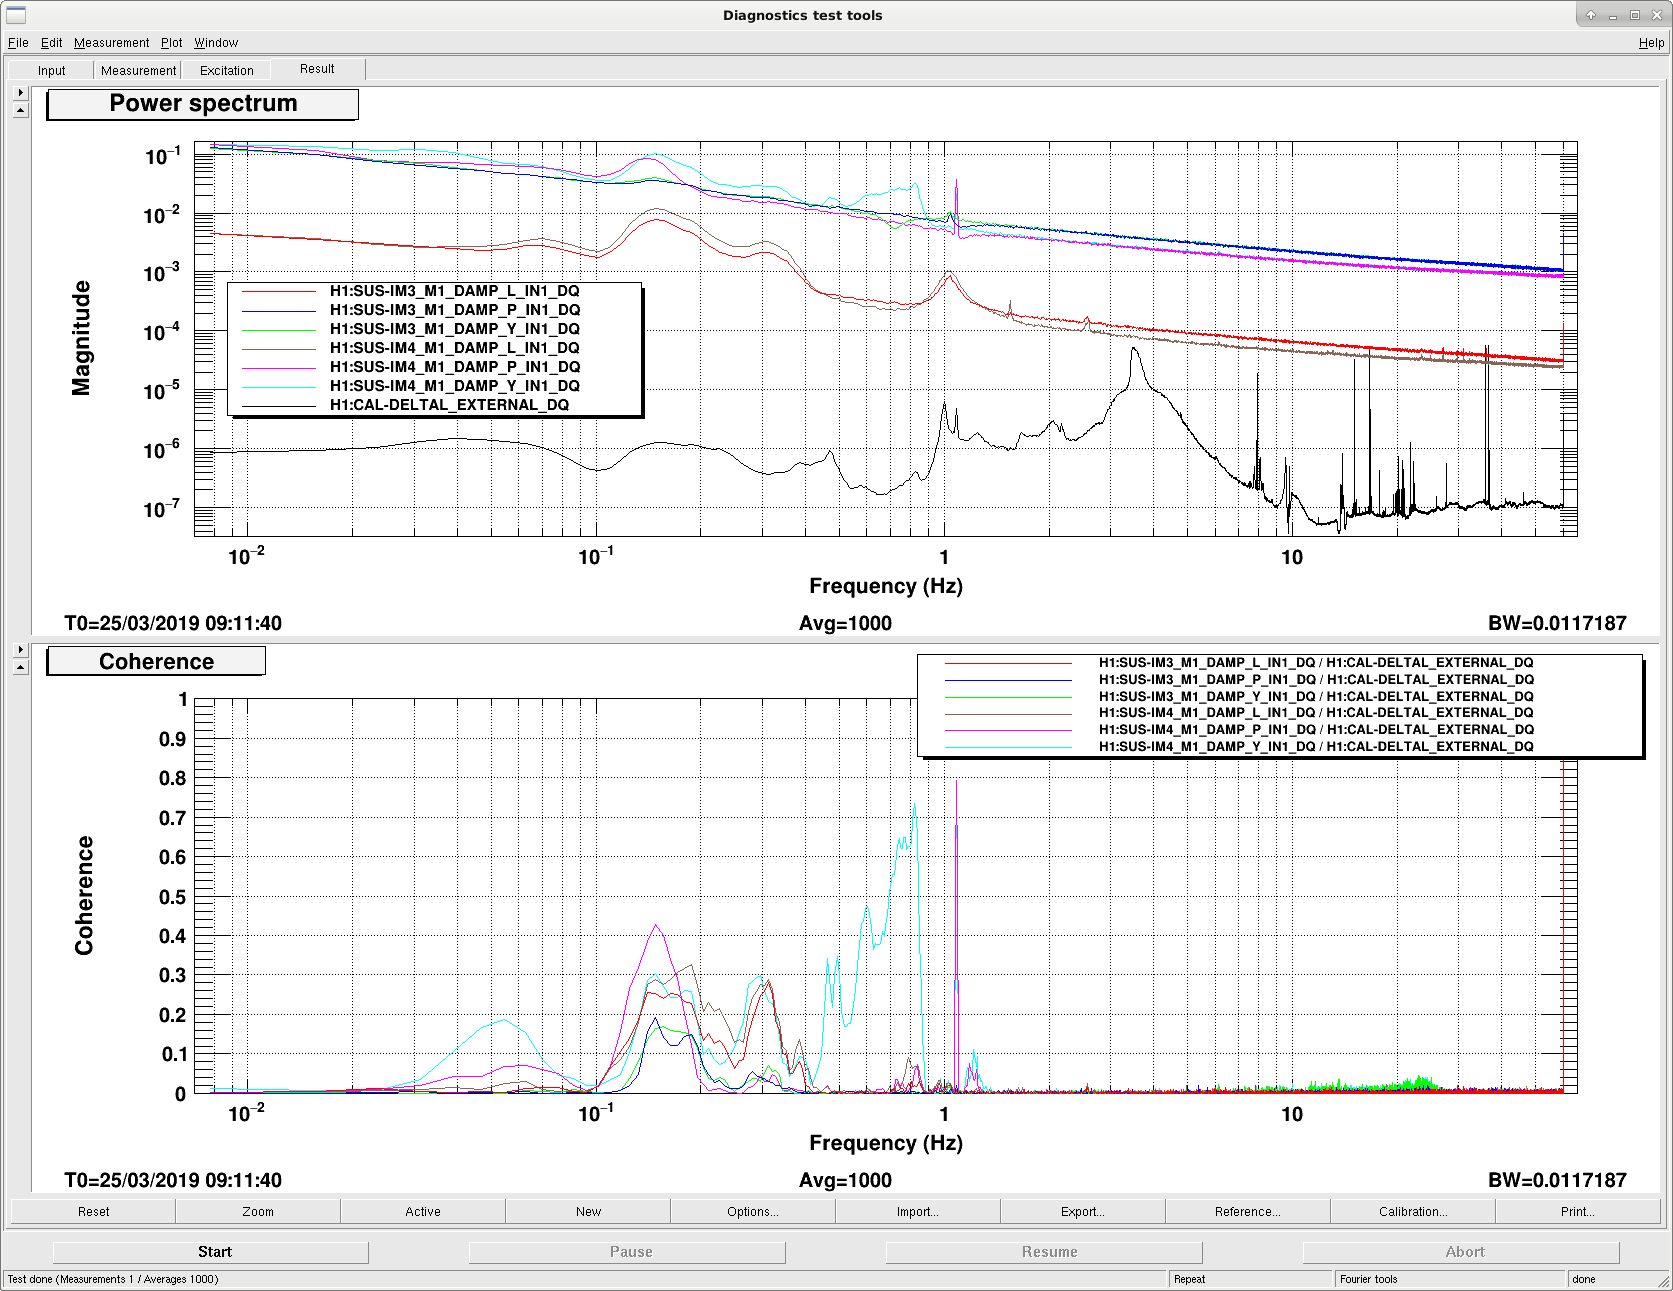
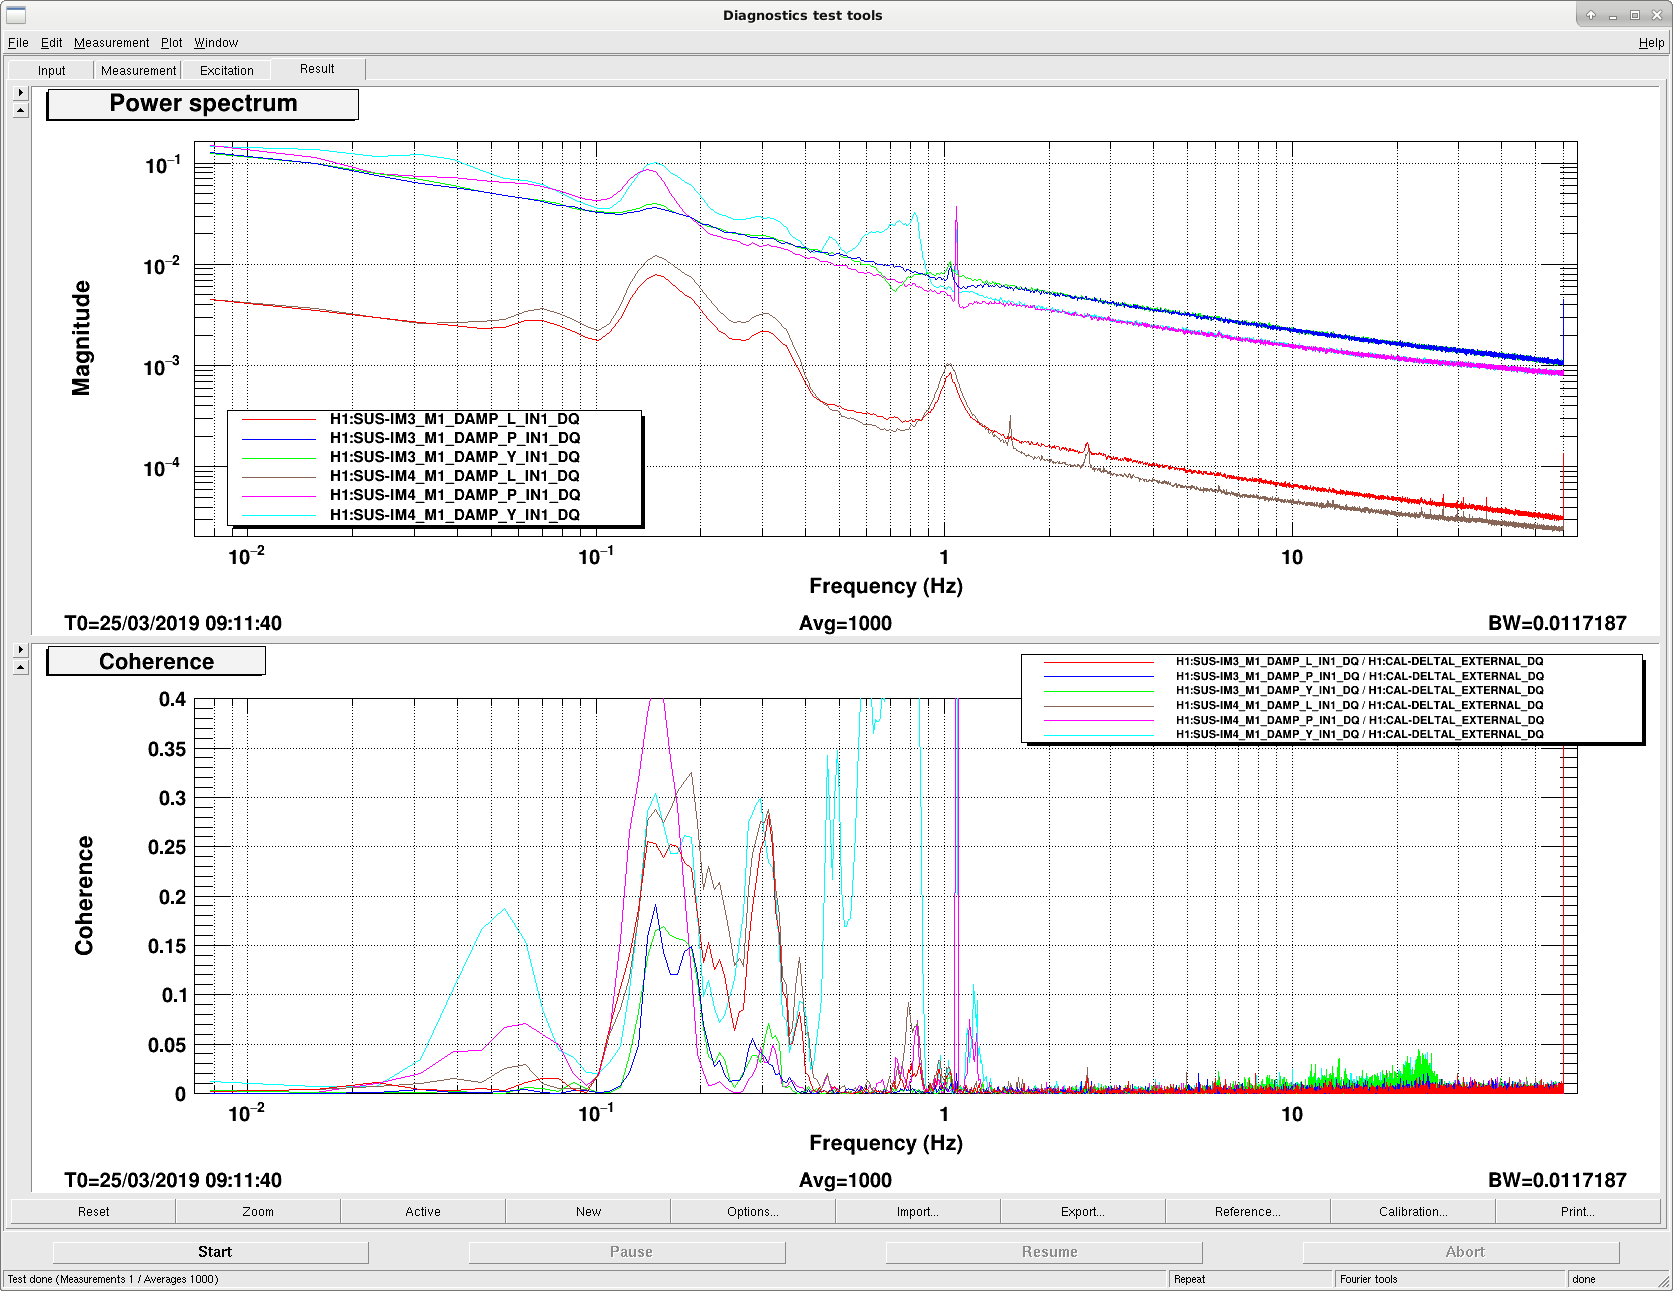
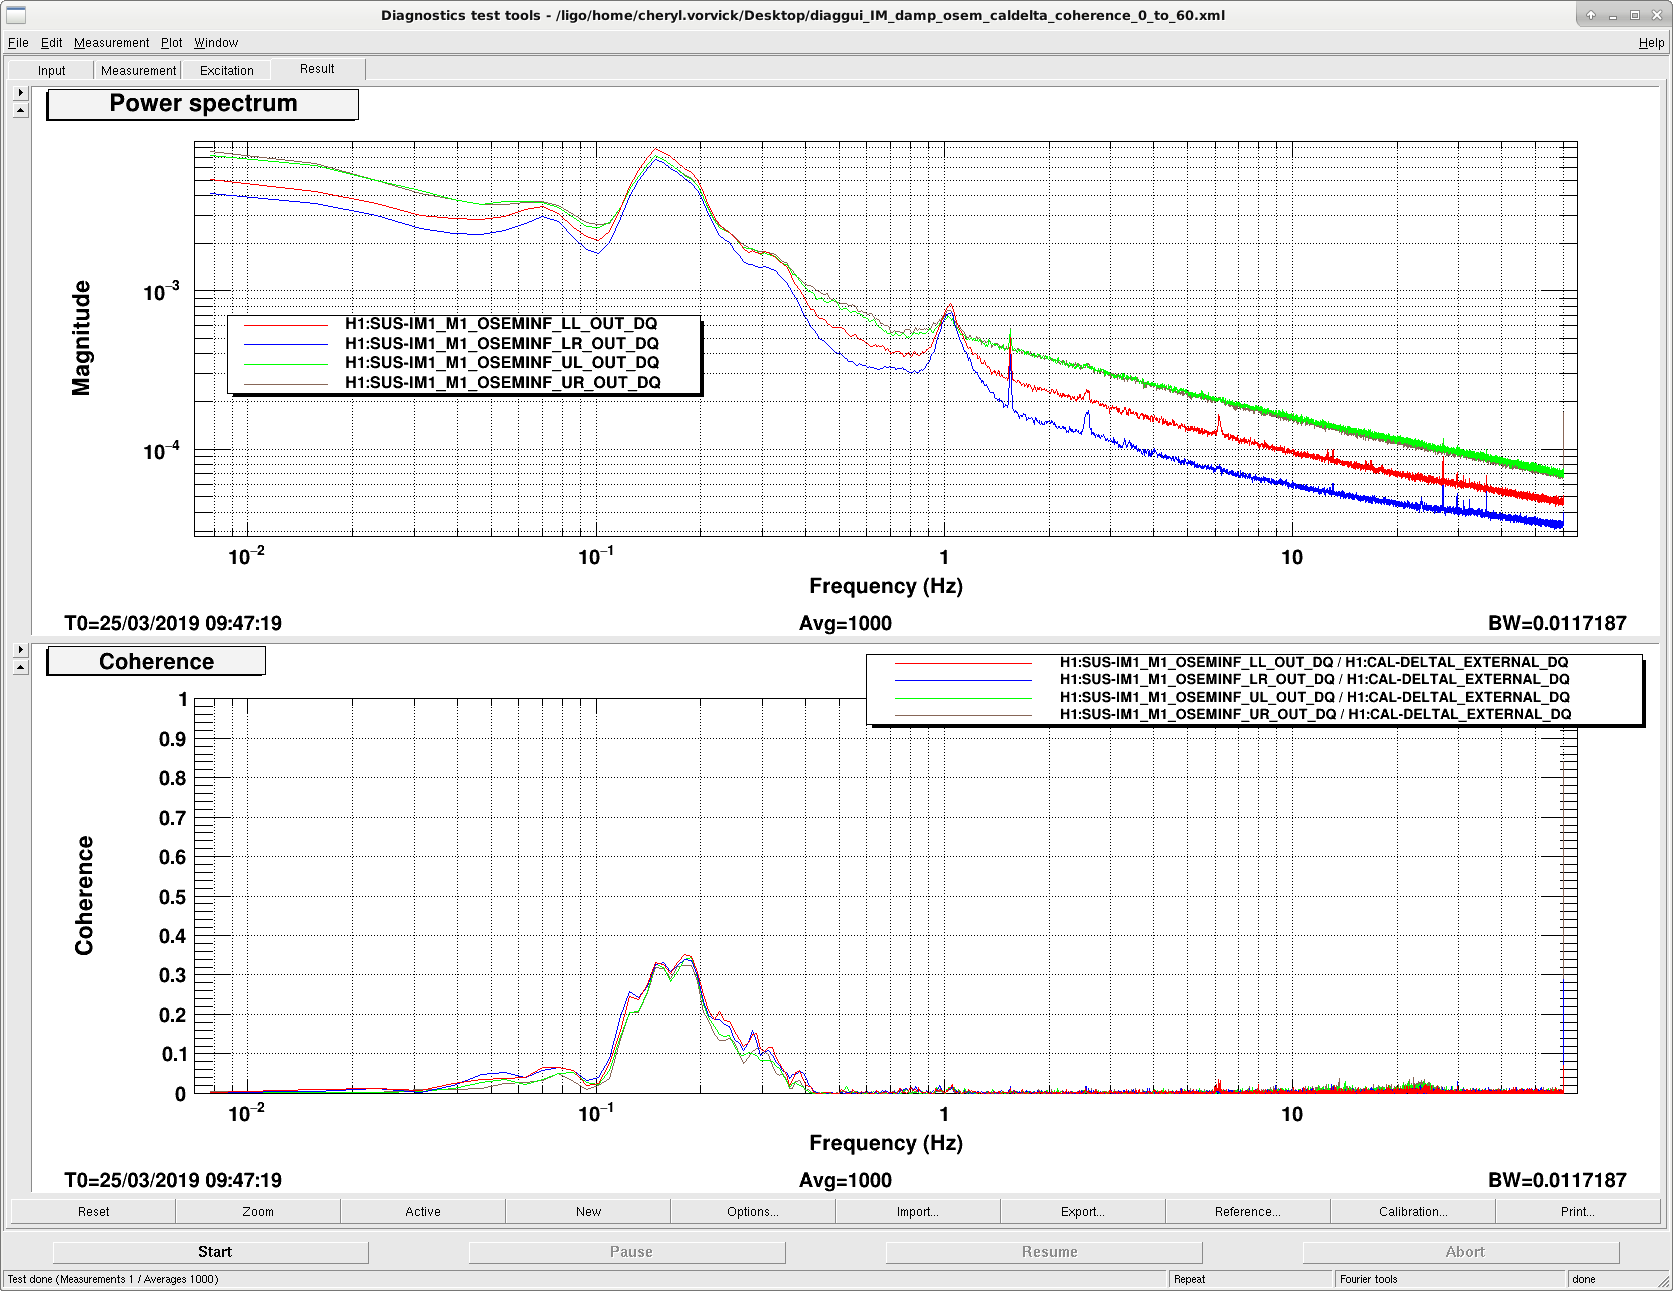
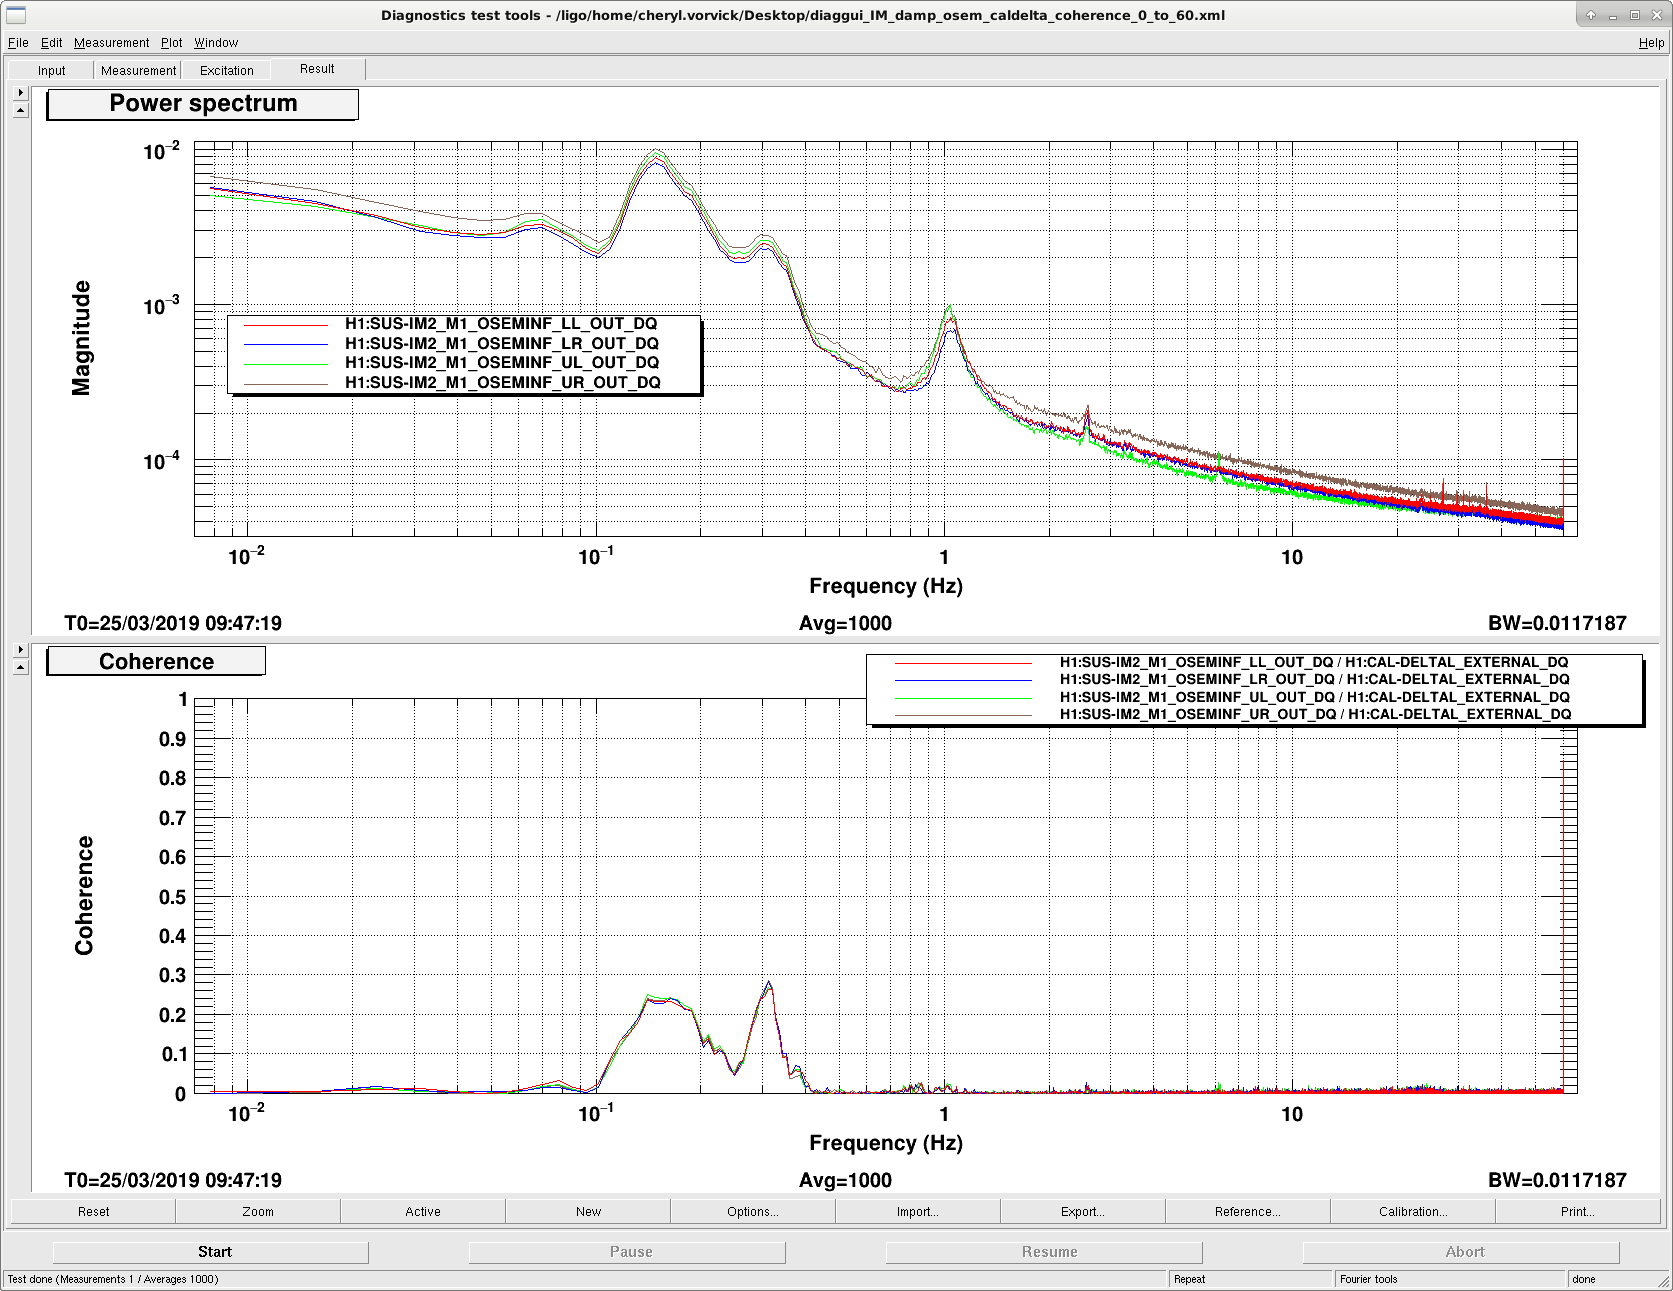
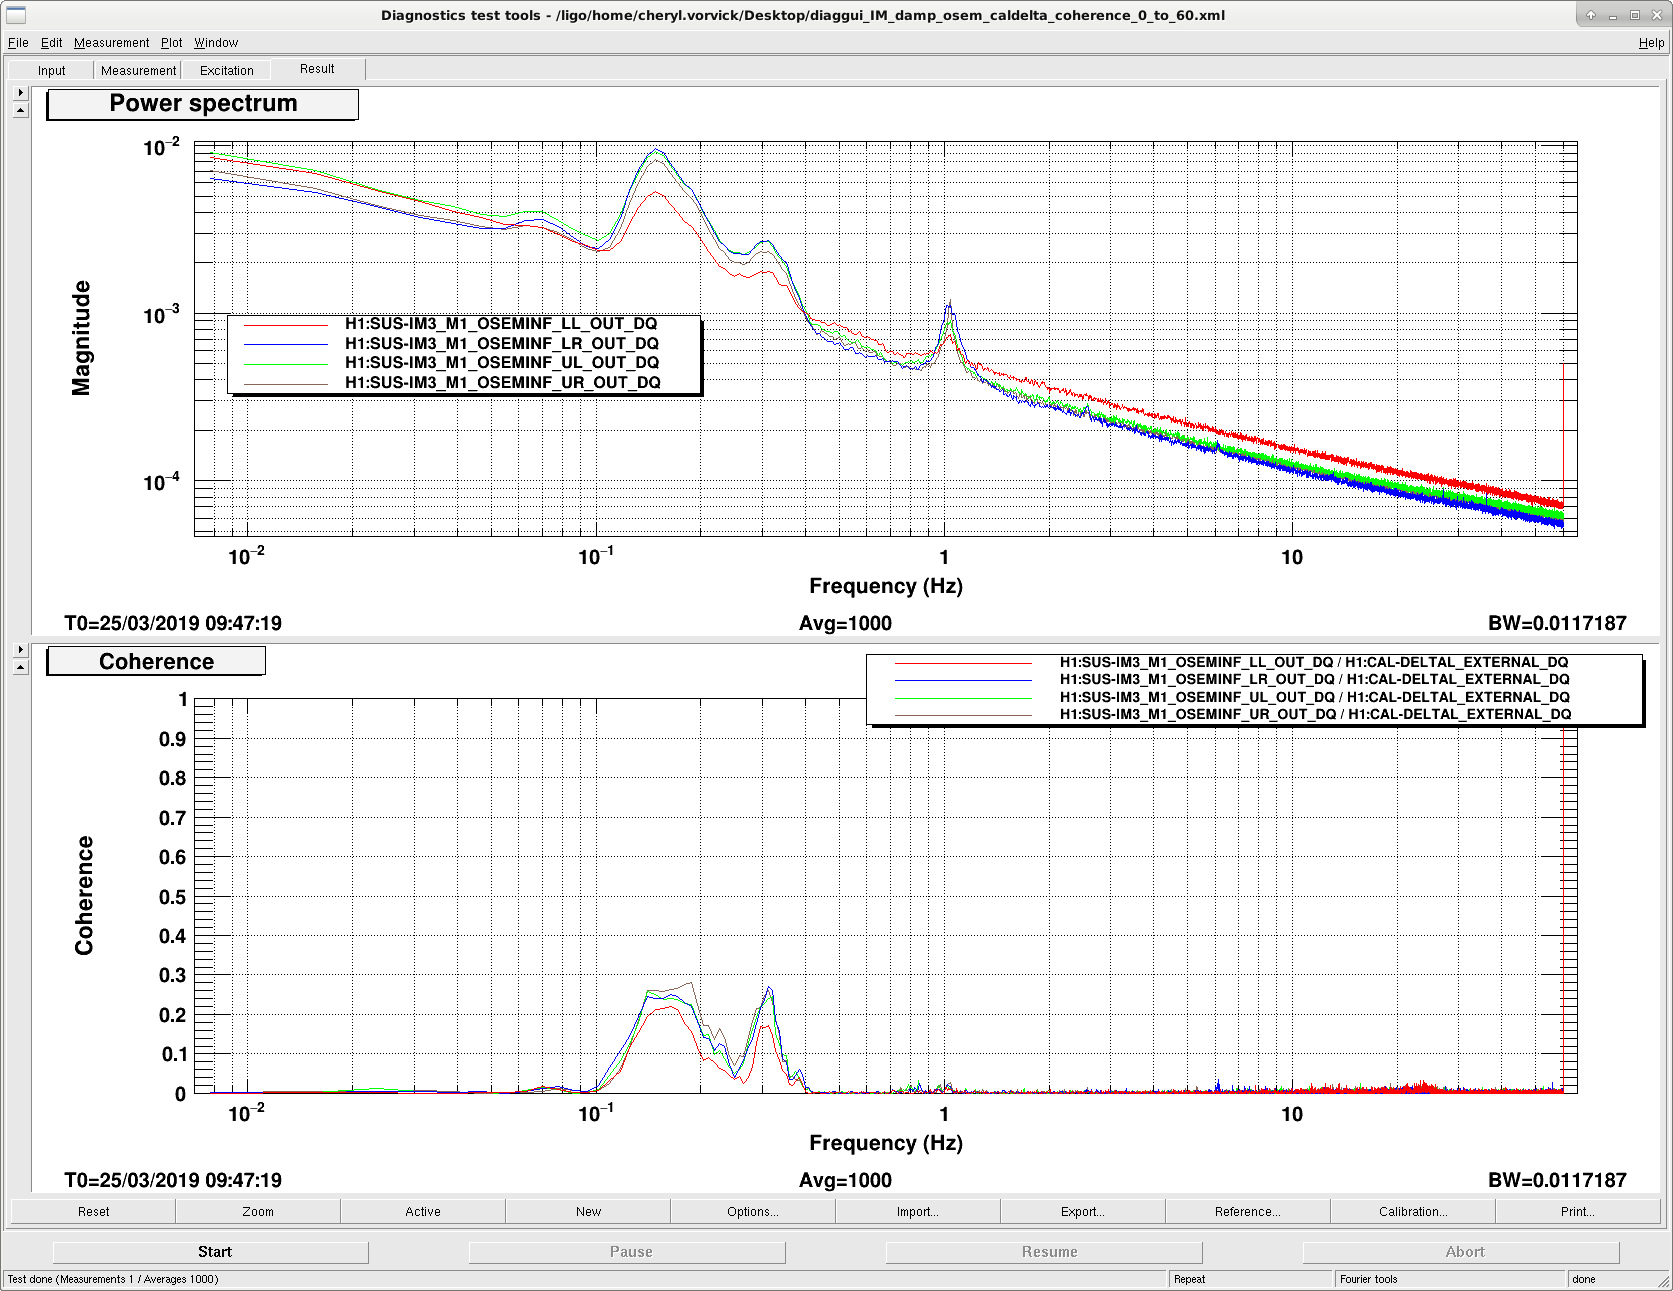
Coherence plots from the current lock, BW = 0.01, Averages = 1000, 0 to 60Hz, show peaks below 2Hz.
- IM1 and IM2, Length, Pitch, Yaw, with CAL-DELTA
- IM1 and IM2 only, with the coherence plot zoomed 0 to 0.4
- IM3 and IM4, Length, Pitch, Yaw, with CAL-DELTA
- IM3 and IM4 only, with the coherence plot zoomed 0 to 0.4 (which cuts off some data, but matches the Y range of plot 2 for comparison)
- IM1 oseminf power spectra and coherence with CAL-DELTA
- IM2 oseminf power spectra and coherence with CAL-DELTA
- IM3 oseminf power spectra and coherence with CAL-DELTA
- IM4 oseminf power spectra and coherence with CAL-DELTA
Alogging for reference.
Images attached to this report