keith.riles@LIGO.ORG - posted 14:52, Thursday 28 March 2019 (47998)
H1 CW hardware injection recovery looks good (L1 has a known injection actuation timing offset)
Executive summary: H1 CW hardware injection recovery is looking good after the most recent DARM sign flip last week. L1 recovery is also good, except for an understood timing offset in the injection actuation.

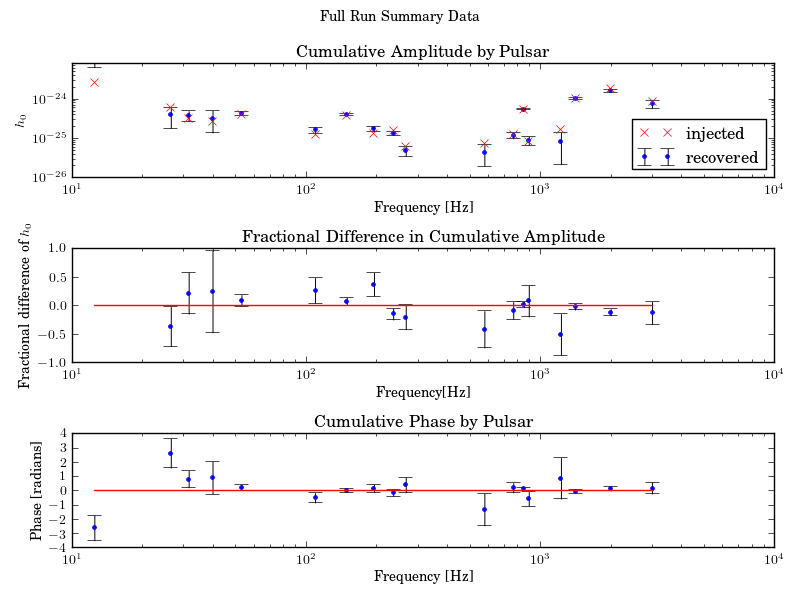
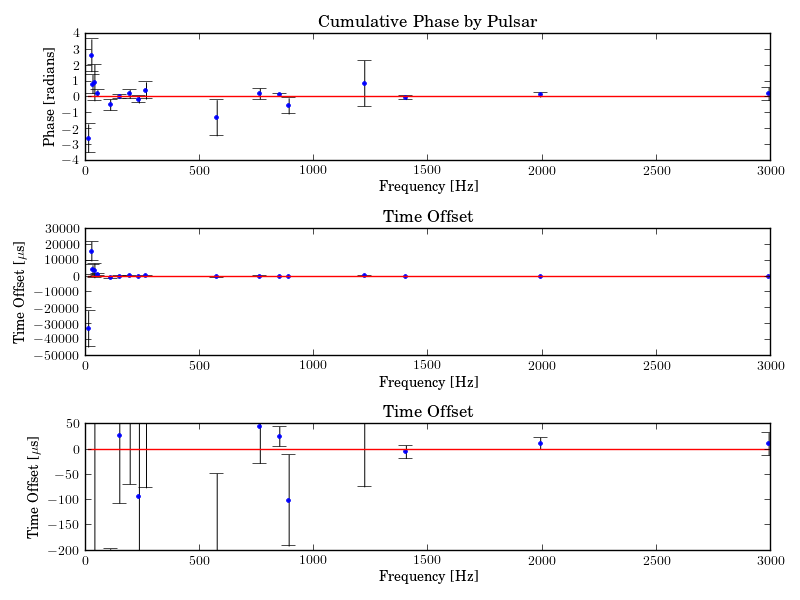
Figures 1 and 2 are summary plots for the 18 CW injections (ranging from 12 Hz to 2991 Hz) from Jessica Leviton's monitoring infrastructure. Only the (admittedly optimistic) injection at 12 Hz shows significant discrepancies between injected and recovered parameters. Note that we have a deliberate mix of "loud" and quiet injections. In this context, loud means clearly visible in one day of data using coherent integration.

For this last period of ER14 (March 22 onward), the monitoring is found at this link (looks at low-noise data: H1:DMT-GRD_ISC_LOCK_NOMINAL):

https://ldas-jobs.ligo-wa.caltech.edu/~jessica.leviton/Hardware_Injections_end_ER14.html

but an O3 version using observing-mode data as of April 1 will be set up next week.

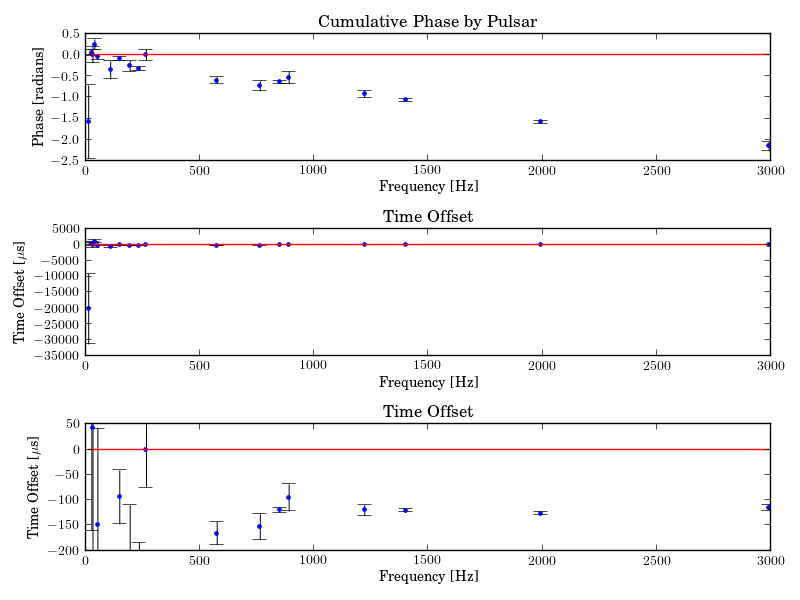
Also shown below (Figures 3 and 4) are summary plots for L1 data for a longer time baseline (March 2 onward), where there is, again, good agreement between intended and recovered parameters, except for a phase discrepancy that grows linearly with frequency that is consistent with a fixed time delay in actuation of two 61-usec clock cycles, which is expected for the O2-era actuation function being used there for CW injections. The timing discrepancy is not seen for H1 because Evan Goetz recently updated the actuation function used in H1 injections.

The L1 monitoring infrastructure can be found here: (again, this location will change as of next week)

https://ldas-jobs.ligo-la.caltech.edu/~jessica.leviton/Hardware_Injections_ER14.html

Attachments:

Figure 1 - Summary of amplitude and phase agreement for injections:
graph 1 - Injected (red crosses) and recovered (blue dots with errors) injection amplitudes vs frequency
graph 2 - Fractional amplitude agreement (injected - true) / true with red line at zero showing the ideal
graph 3 - Phase offset between recovered and injected with red line at zero showing the ideal

Figure 2 - More detail on phase agreement:
graph 1 - Same as graph 3 above, but with linear frequency scale
graph 2 - Same information with phase discrepancy converted to a time offset
graph 3 - Same as graph 2 but zoomed in vertically

Figure 3 - Same as Figure 1, but for L1

Figure 4 - Same as Figure 2, but for L1
Images attached to this report