Summary: a preliminary investigation shows some high bicoherence between excited violin modes and calibration lines in DARM which seem to explain some of the lines seen in ER14 around the violin modes.
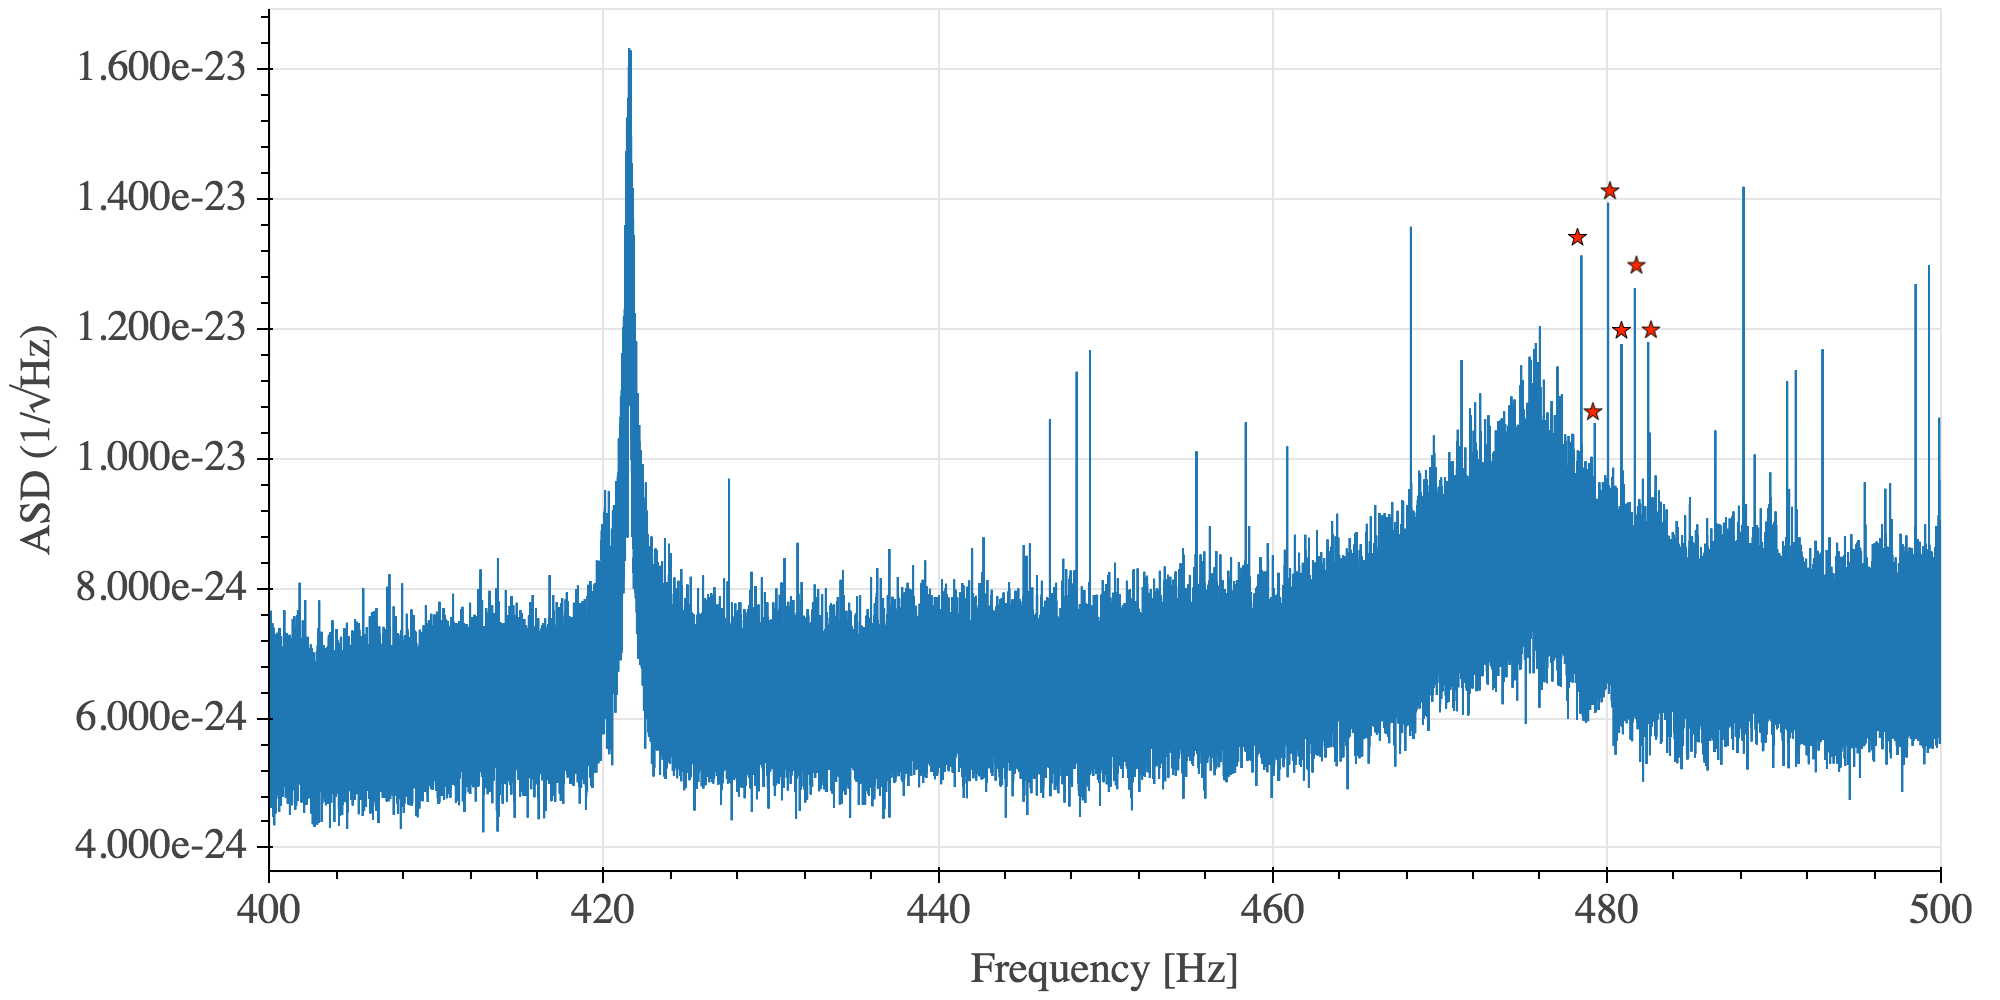
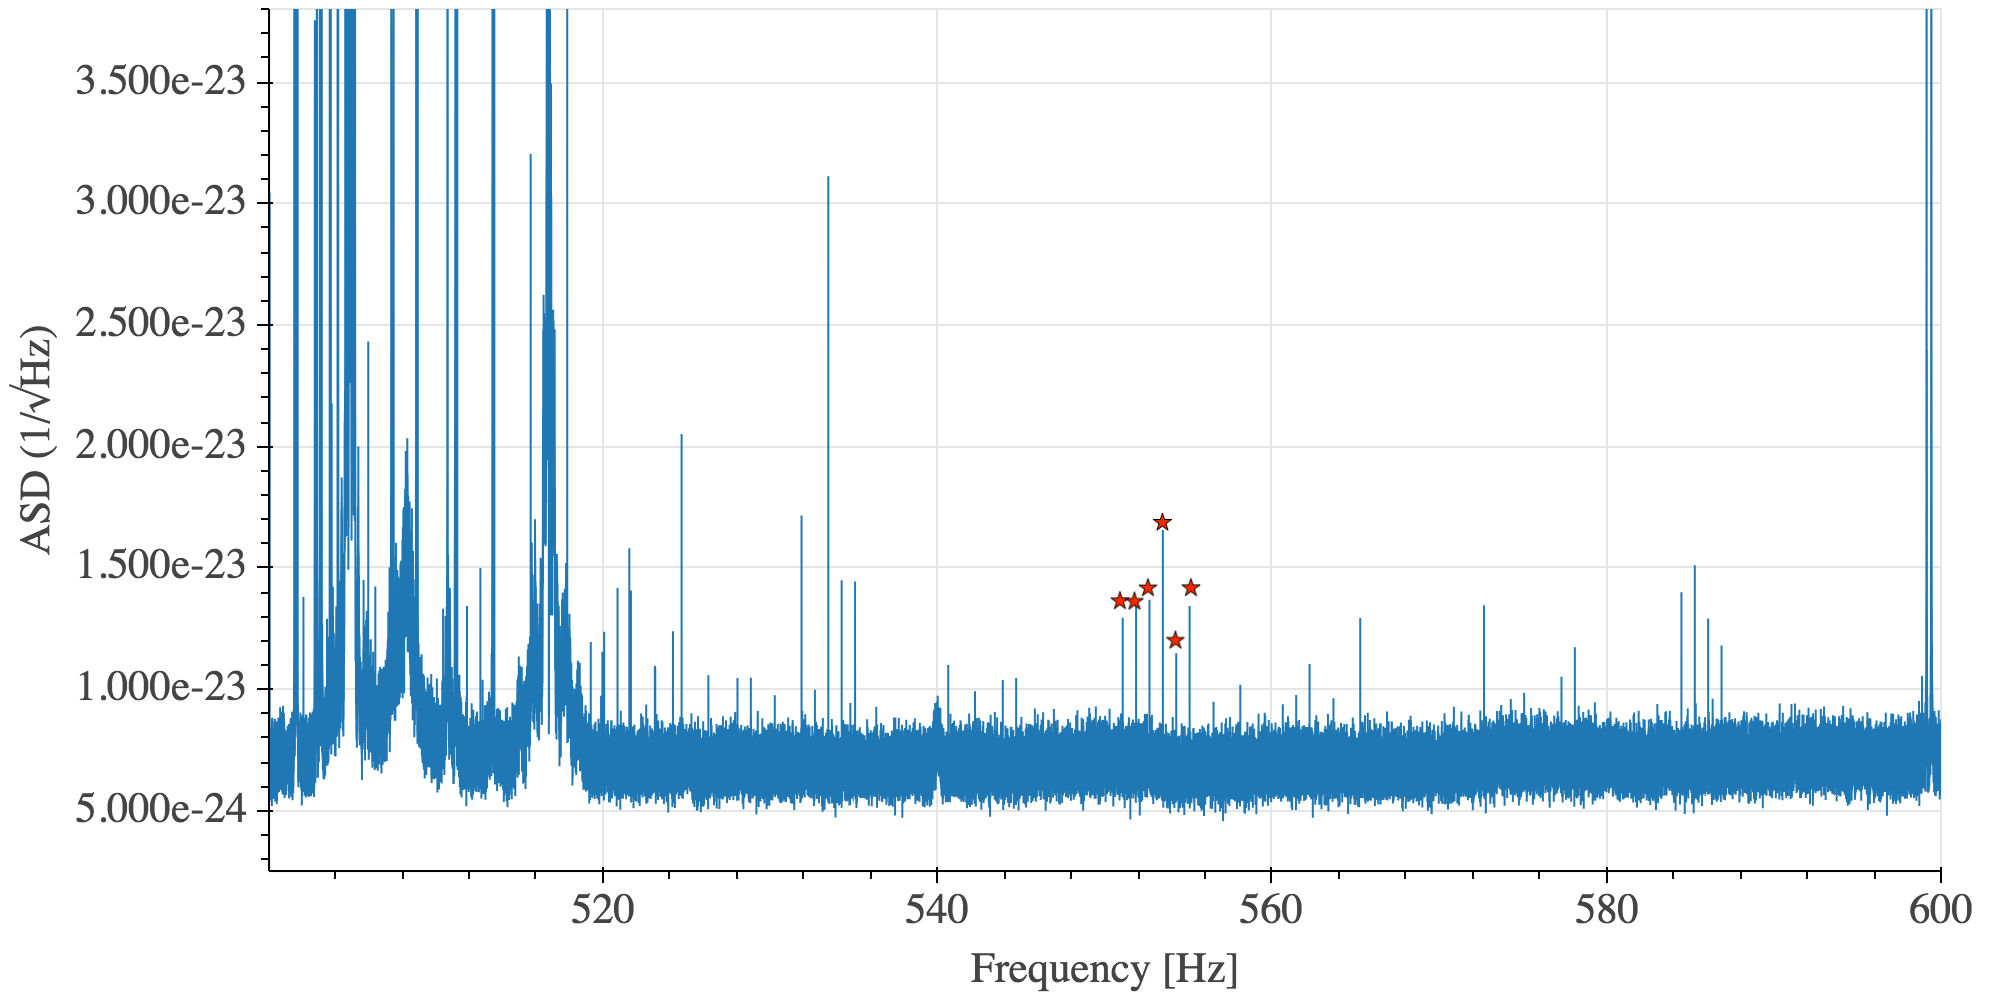
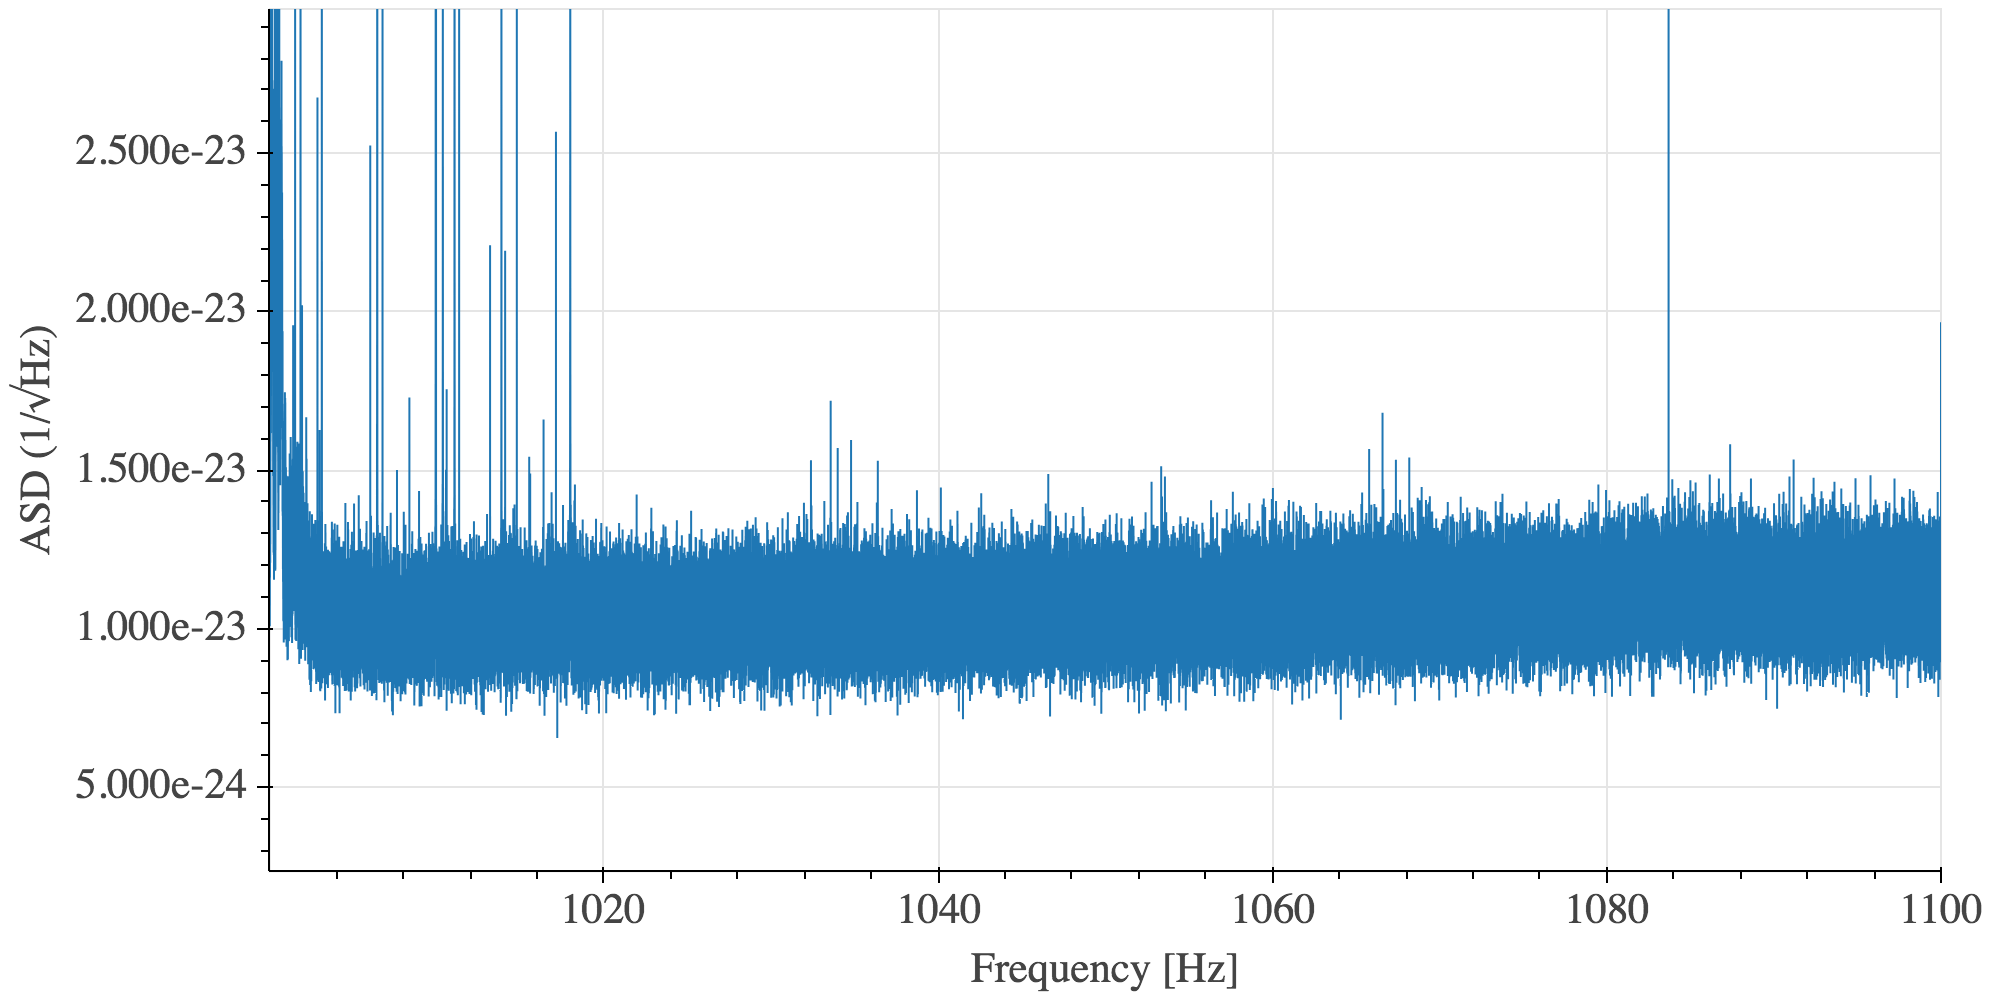
Using data from ER14, a great number of lines in the region between 450 and 600 Hz have been observed, as can be seen in the first two attached plots (the spectrum analyzed can be found here: https://ldas-jobs.ligo-wa.caltech.edu/~pep.covas/ER14/FourthWeek/H1_clean-epoch_amp-wght/, where you can select a range of frequencies and the zoom into the desired frequency band). Some symmetry in these lines around the violin modes can be seen, and some of them appear to be grouped in combs of spacings of 0.8 Hz. Furthermore, similar structures can be seen around the 2nd order harmonics of the violin modes, as can be seen in the third plot. By analyzing the frequencies of some of these lines, I realized that some of them are located at frequencies which are the sum of a violin mode frequency and a calibration line frequency.
I have done a preliminary investigation on some of these lines by searching for non-linearities in the corresponding frequency bins. To do this, I calculate higher order statistics (namely the bicoherence), which tries to find bicoherence in DARM data between frequencies f1, f2 and f1+f2, f1-f2, 2*f1, and 2*f2 (more details in https://arxiv.org/pdf/1811.02973.pdf). We expect to have bicoherence if DARM contains a nonlinear signal of some form, like [x1(t)+x2(t)]^2.
Some of the observed lines, with frequencies at either 2*f1, 2*f2, f1+f2 or f1-f2, show a bicoherence almost equal to 1. These lines are: 552.68167 = 516.781167 + 35.9 Hz, 553.48167 = 516.78167 + 36.7 Hz, 521.586111 = 16.7 + 504.886111 Hz, 519.986111 = 15.1 + 504.886111 Hz, 531.88167 = 15.1 + 516.78167 Hz, 533.48167 = 16.7 + 516.78167 Hz, 1033.563333 = 516.78167 + 516.78167 Hz, 1033.983889 = 35.9 + 998.083889 Hz, 1034.783889 = 36.7 + 998.083889 Hz (there may be more bicoherent lines, I have not analyzed the full spectrum). These nonlinearities can be explained by a beating between some violin modes and calibration lines at 35.9, 36.7, 15.1, 16.7 Hz. More evidence to show that these lines really come from a nonlinear process is that they show both at f1+f2 and f1-f2.
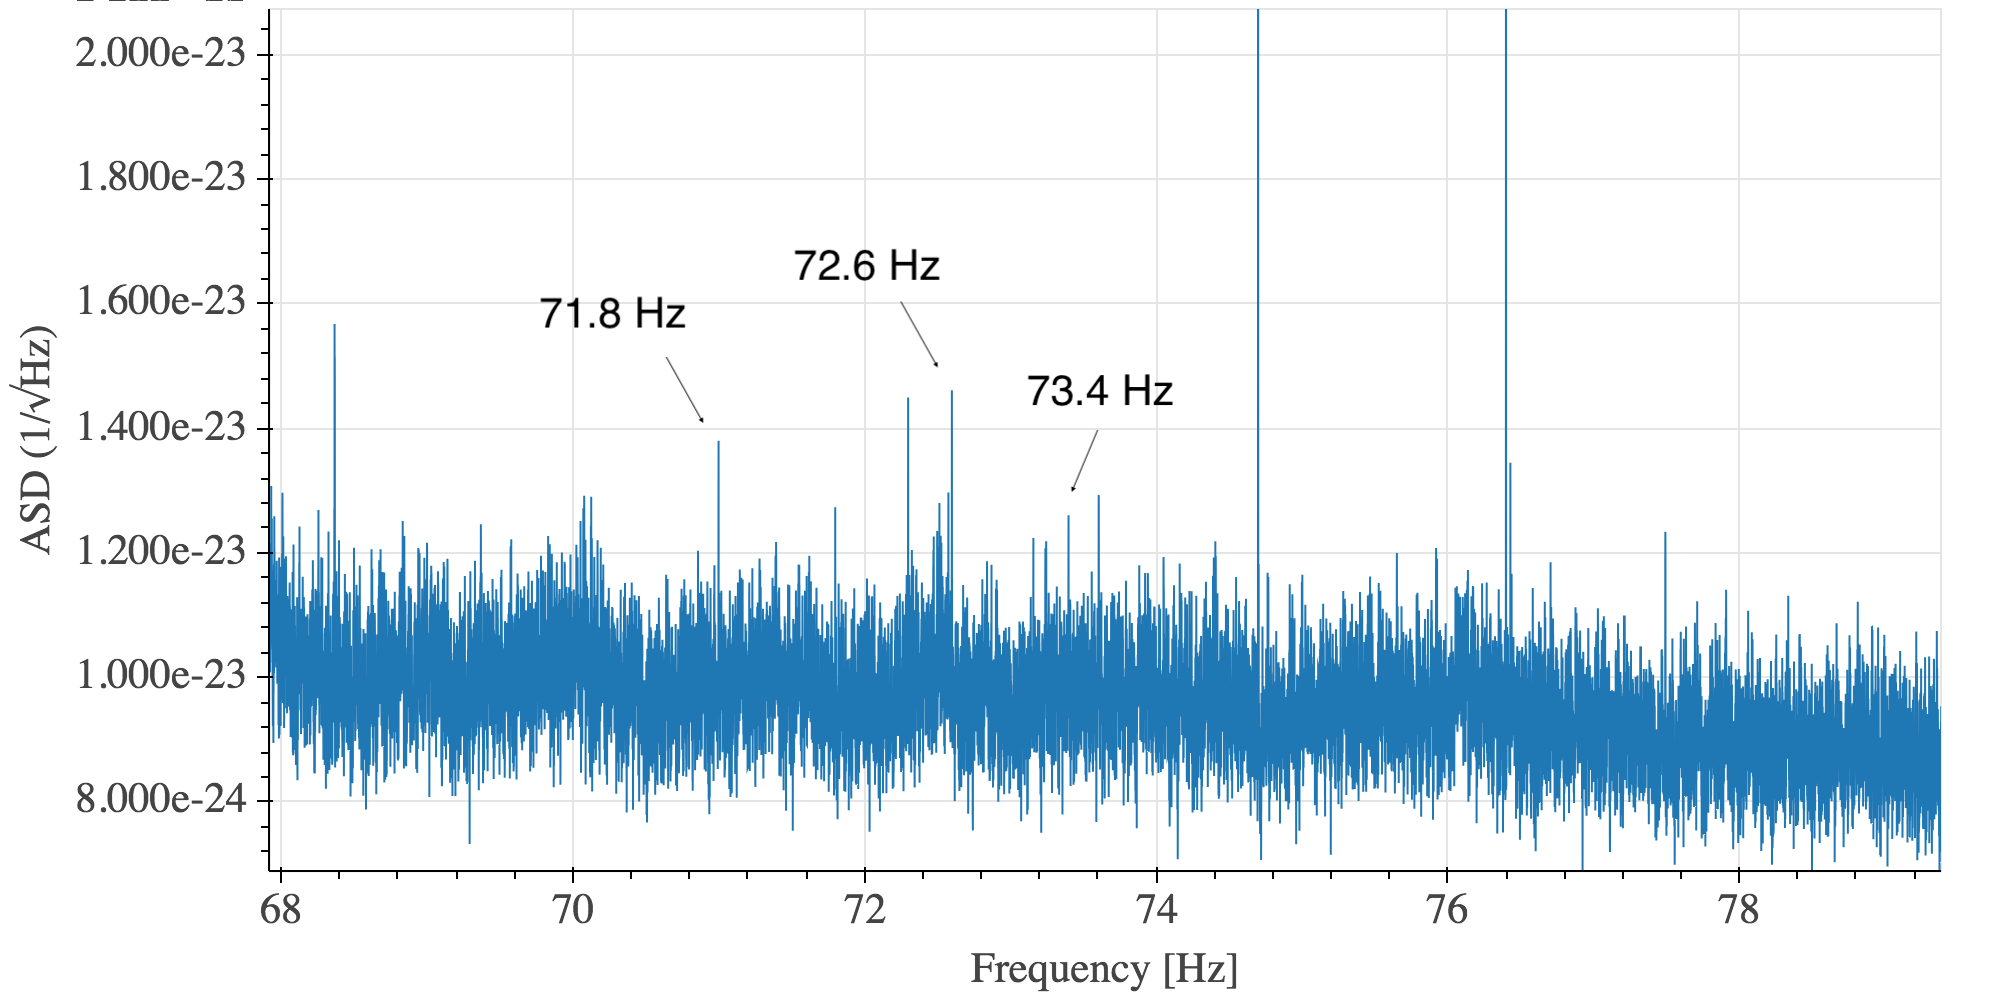
Nonlinearities in the calibration lines themselves also seem to appear, since there are lines with bicoherence almost equal to 1 at 72.6=35.9+36.7 Hz, 71.8 = 35.9 + 35.9 Hz, 73.4 = 36.7 + 36.7 Hz and 33.4=16.7+16.7 Hz (shown in the fourth attached plot).
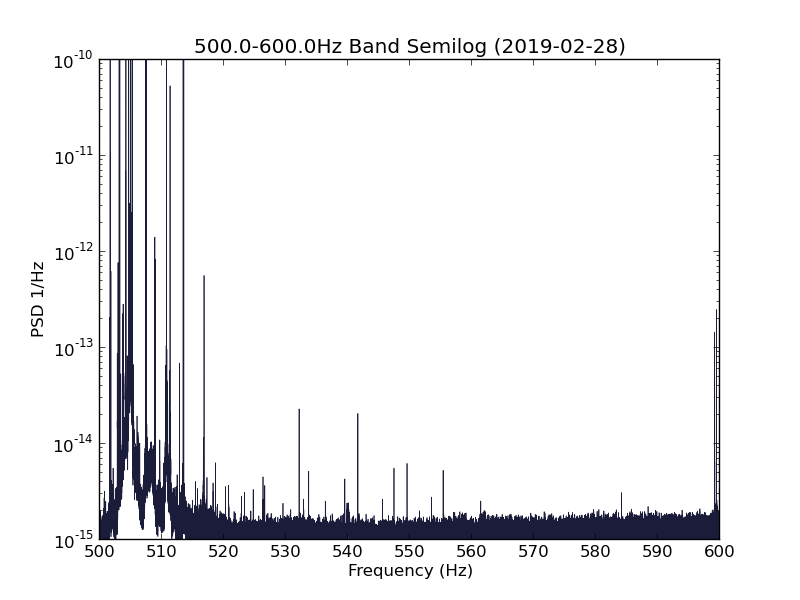
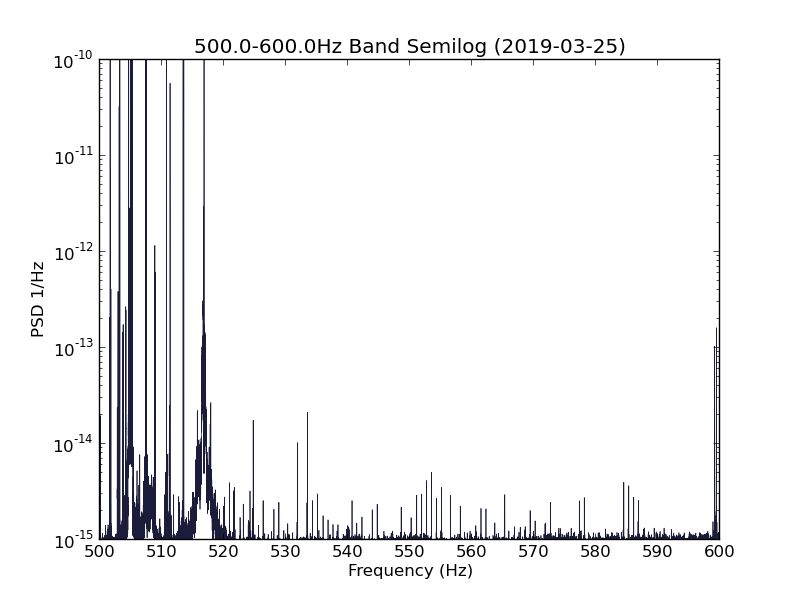
The lines which are related to the nonlinearity between a violin mode + calibration line only appear in the spectra at times when the violin mode is higher than usual. I think that the nonlinearities may always be there, but they only show above the noise when a violin mode has been excited over its nominal value. I have checked other times when the violin mode at 516.781 was at its "nominal" level, and many of these lines seem to be gone. This can be seen in the fifth and sixth plots, taken from https://ldas-jobs.ligo-wa.caltech.edu/~keithr/preO3spectra_DARM/, which show a comparison of the lines between Feb 28 (violin mode at nominal level) and March 25 (excited violin mode).
These nonlinearities may explain some of the lines which appear around the violin modes, but many of the other lines do not show a large bicoherence. For example, focusing in the group of 6 lines separated by 0.8 Hz each at 551.08167/551.88167/552.68167/553.48167/554.28167/555.08167, only two of these lines (552.68167 = 516.781111 + 36.7 Hz and 553.48167 = 516.781111 + 35.9 Hz) are explained by a nonlinearity. I don't have an idea of how the other four may be created. Another beating of each of these two lines with a +-1.6 Hz process could explain the other four lines (the lines at 15.1 and 16.7 Hz are separated exactly by 1.6 Hz...).
Further investigations are needed to collect more evidence. An interesting check that could be done in order to test if nonlinearity is really responsible for some of these lines would be to move one of the calibration lines by e.g. 0.1 Hz and analyze the spectra again to see if they have moved, and if so, how many of them have moved.