[M. Wade, J. Driggers, J. Kissel, A. Viets]
I've produced new filters for the GDS calibration pipeline based on the calibration model made earlier today (see LHO aLOG 48534). The main changes were:
- New DARM notch filter
- New calibration line frequencies (only needed for line subtraction, as the TDCFs calculation reads in the line frequencies from the front end)
- Filters contain model values for fs^2 in addition to fs. This is necessary since the measurements show pro-spring behavior. The model value for f_s is therefore purely imaginary.
The filters were produced in SVN revision 7252, and can be found here:
aligocalibration/trunk/Runs/O3/GDSFilters/H1GDS_1239476409.npz
They were produced using the script
/ligo/svncommon/CalSVN/aligocalibration/trunk/Runs/O3/H1/Scripts/TDfilters/H1_run_td_filters_1239476409.sh
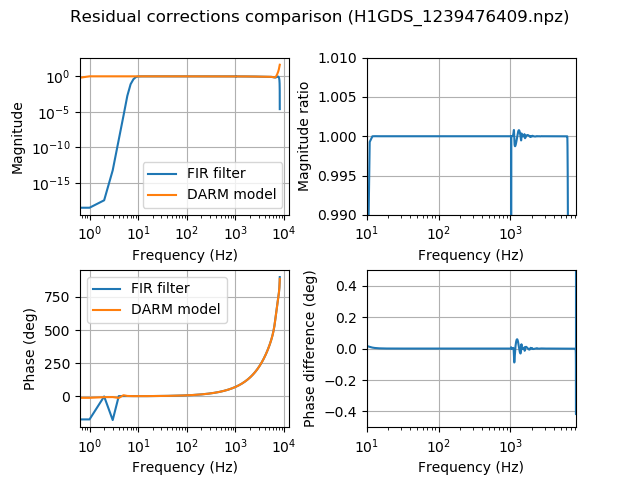
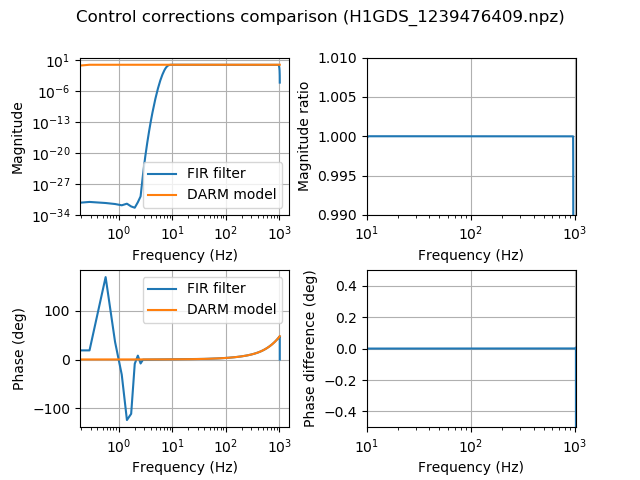
Bode plots of the correction filters for the inverse sensing path and actuation path are attached. They agree with the model to the expected level. More plots will be added soon, once we have some low-noise data after the update to work with.
Using data from the first lock stretch after the calibration model and line frequencies were updated, I have made several more diagnostic plots:
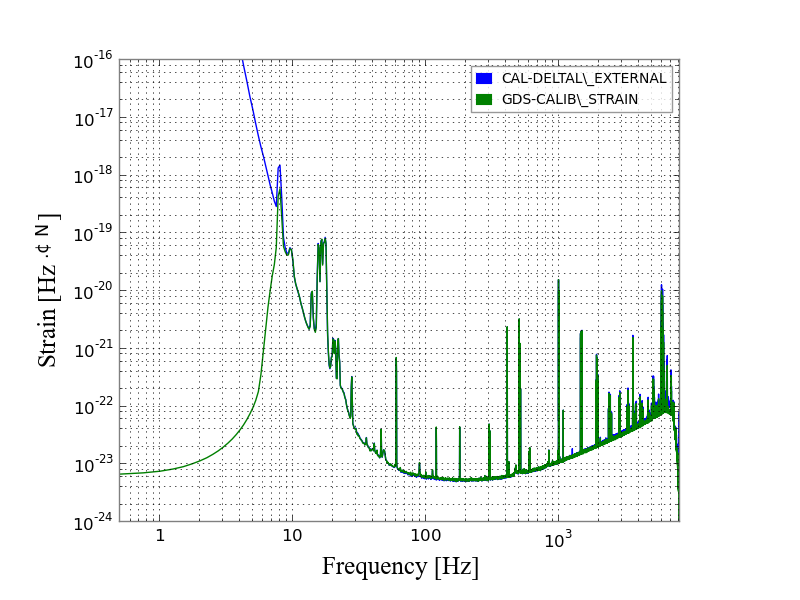
- ASD spectrum comparison with CAL-DELTAL_EXTERNAL and GDS-CALIB_STRAIN
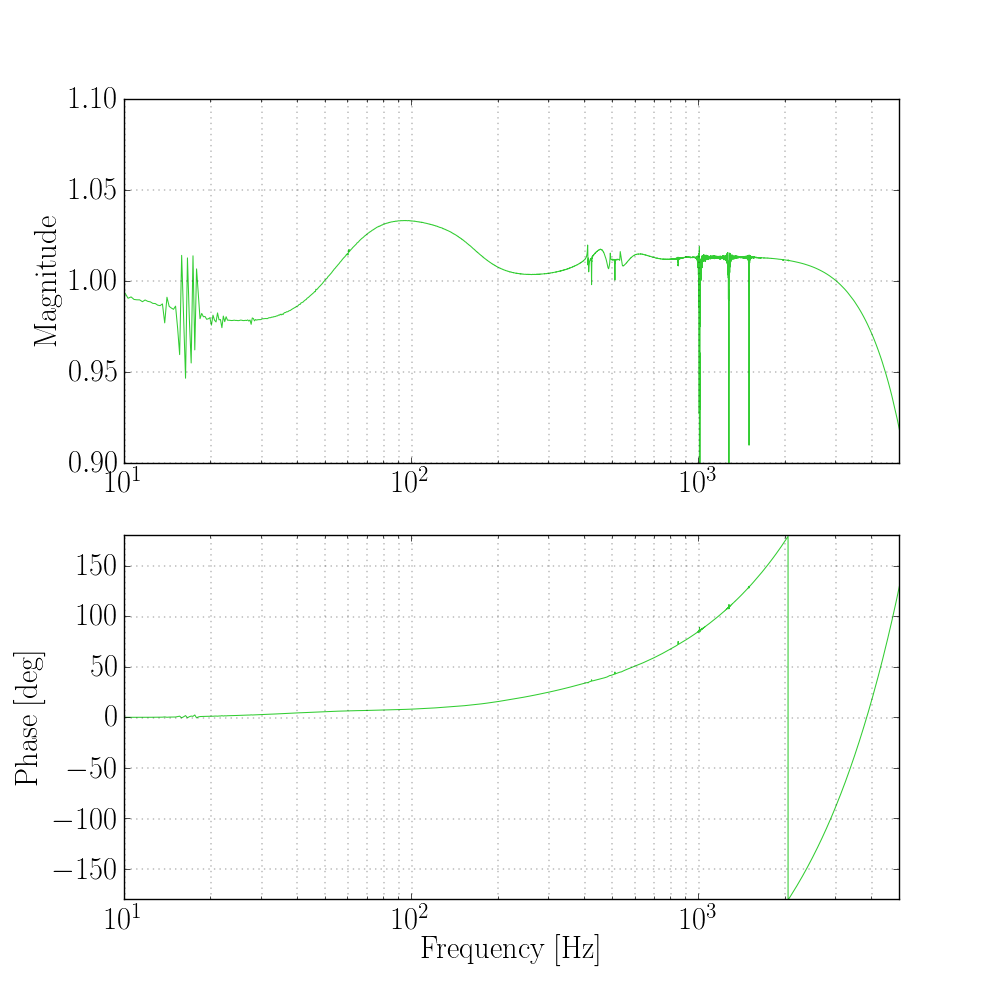
- Plot of transfer function between CAL-DELTAL_EXTERNAL and GDS-CALIB_STRAIN
- Comparison of the response function applied by the GDS filters and the DARM model response function. The TDCFs were not applied for this test. Note that there is a small (generally < 1%) discrepancy, which was not present in O2 C00 data. It appears likely that the discrepancy comes from the actuation, given that it is absent above 1 kHz. Perhaps the GDS actuation filters are not compensating for something that they should be.
- Comparison of the residual correction filter's frequency response to the intended response of DARM model. No notable discrepancies are seen, which is good.
- Comparison of the control correction filter's frequency response to the intended response of DARM model. No notable discrepancies are seen, which is good.
- Magnitudes and phases of the ratio Delta L / Pcal at the 3 Pcal line frequencies. This was not made using C00 data. To make this plot, I compensated for all time dependence (i.e., applied every time-dependent correction possible in the GDS pipeline). In production, we are currently only correcting for the magnitude of kappa_TST, the optical gain kappa_C, and the coupled cavity pole f_cc. The plots show that compensating for all time dependence improves calibration accuracy at the calibration lines to better than 1% accuracy. Nice work team! This may be an indication that we could turn on all time-dependent corrections in the GDS pipeline.