A follow up on the occasional h1calcs CPU_MAX warnings when the model's processing time exceeds 63uS:
To confirm that when this happens the number of cycles which exceed this value is very small, I have analyzed the cpu histogram information available in the kernel /proc/model-name/status file.
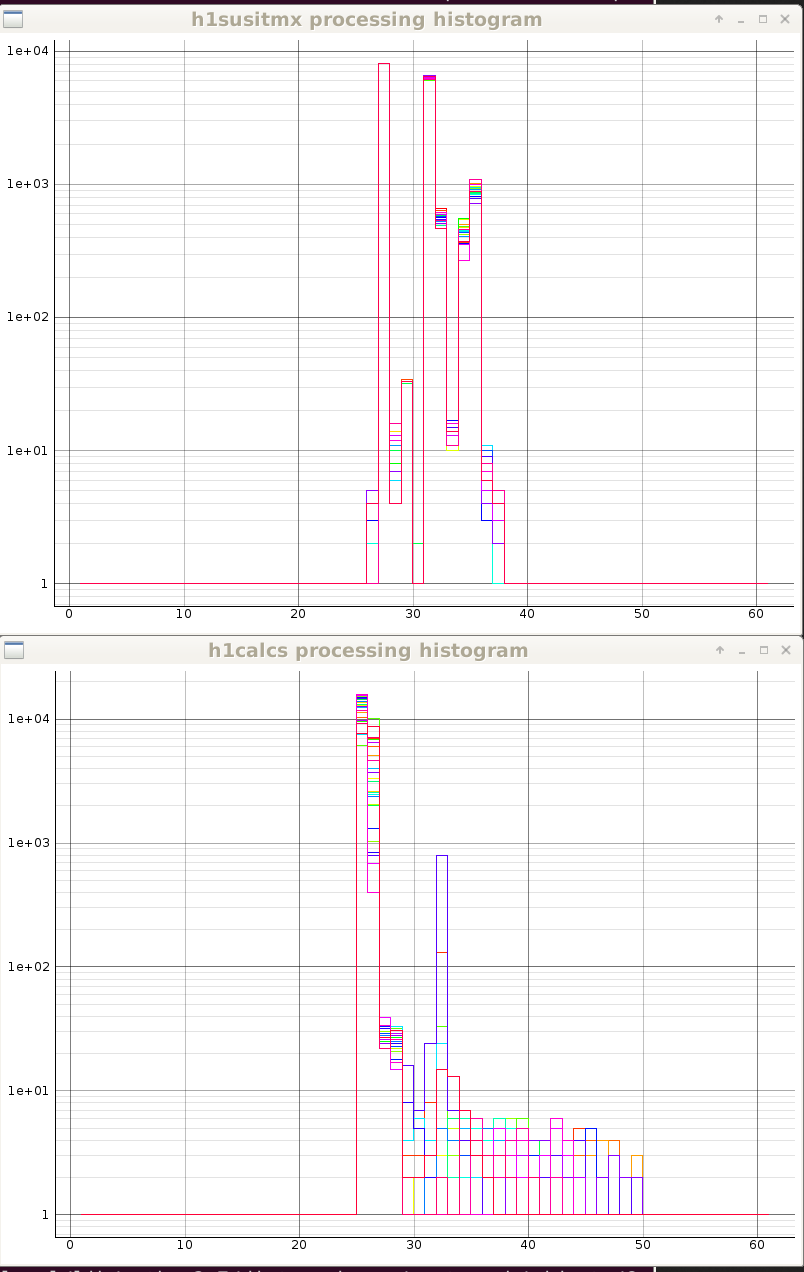
Each model writes a /proc/model-name/status file on the front end computer, the last line of which is a histogram of the cycle-histogram giving cycle processing time and number of cycles with this processing time (only non-zero instances are shown). I have written a pyqtgraph python program to analyze one or more histogram lines and plot them as a graphical histogram. Attached image shows h1calcs (lower histogram, 29 data sets) and for comparison h1susitmx (upper histogram, 21 data sets). Y-axis is number of cycles with the processing time, X-axis is the processing time bins (1uS - 60uS)
The plot shows that h1calcs spends most of its cycles in the 25uS-26uS region, with only one or two cycles in each of the 40+ bins. When CPU_MAX exceeds 62uS we can confidently say that only one or two cycles have exceeded that value out of the 16,384 cycles from that second. This happens about once or twice a week now, my cronjob on h1fescript0 clears the error within a minute.
(Note that the y-axis is logarithmic which necessitated adding one to the count values)