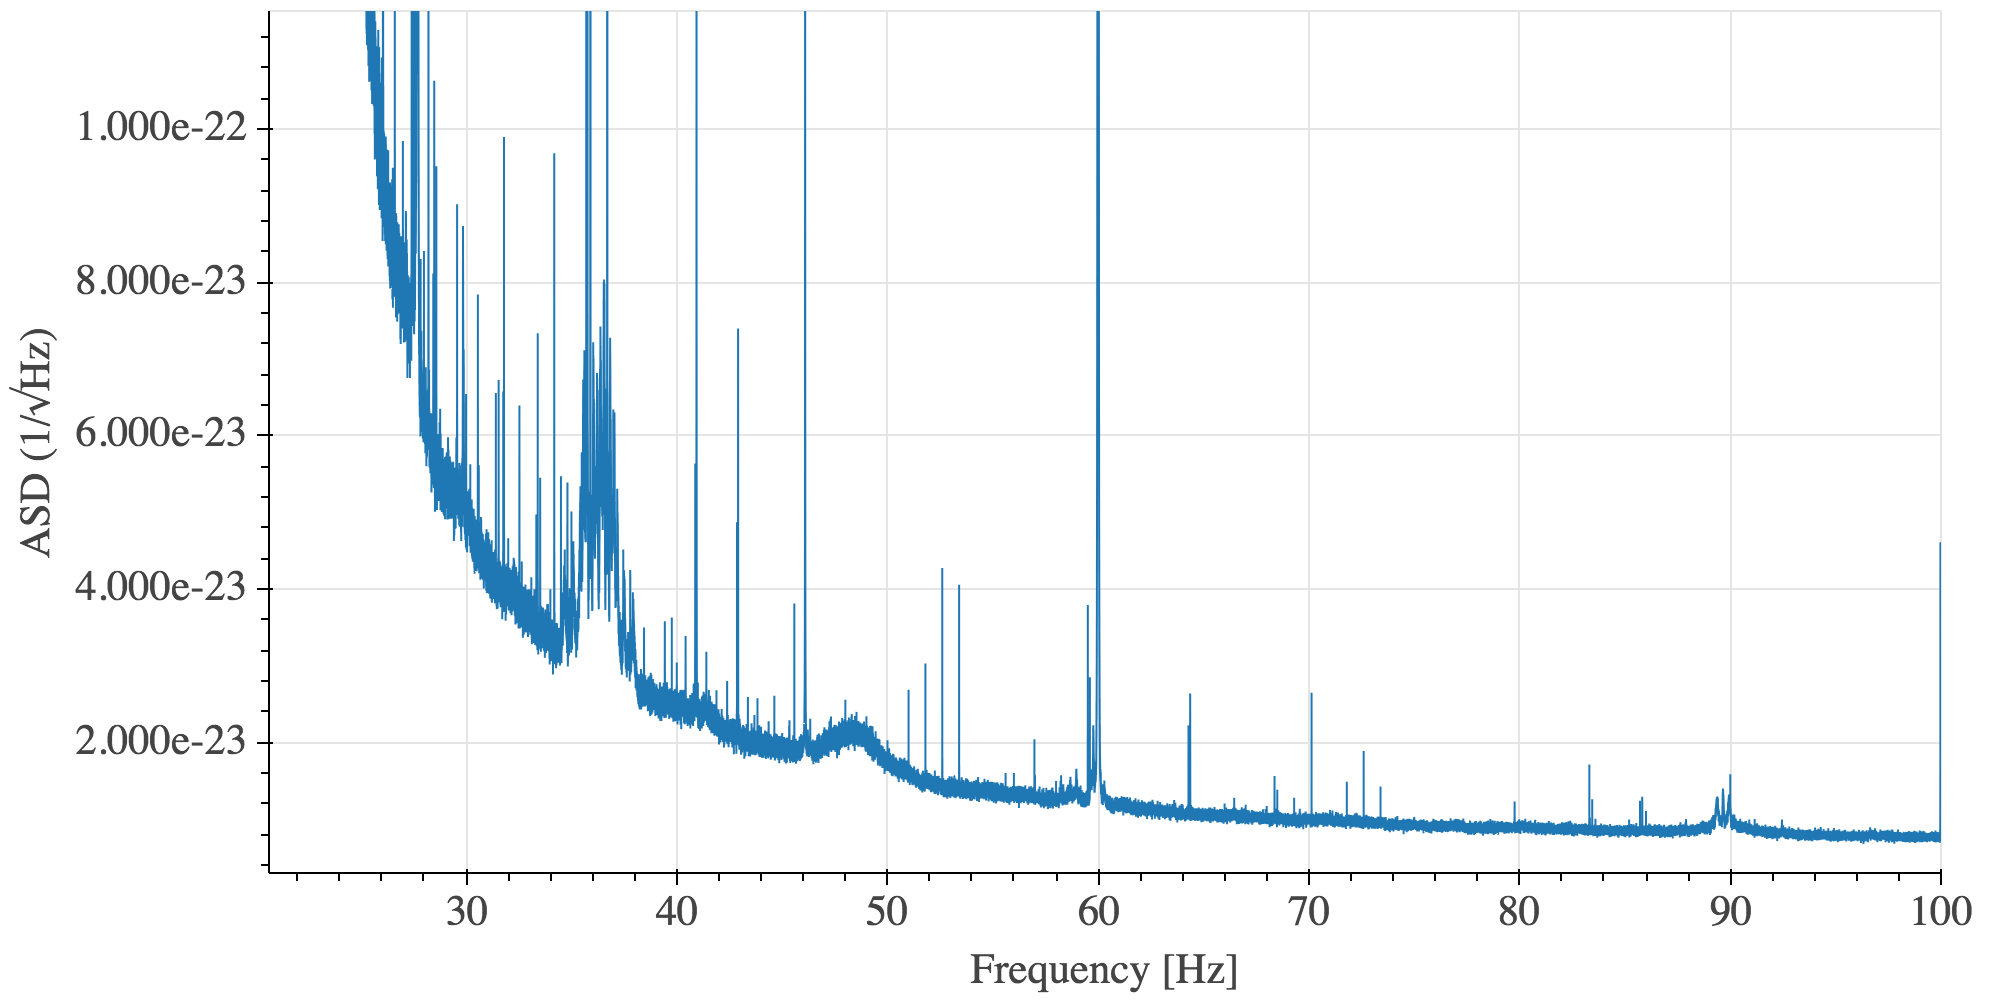
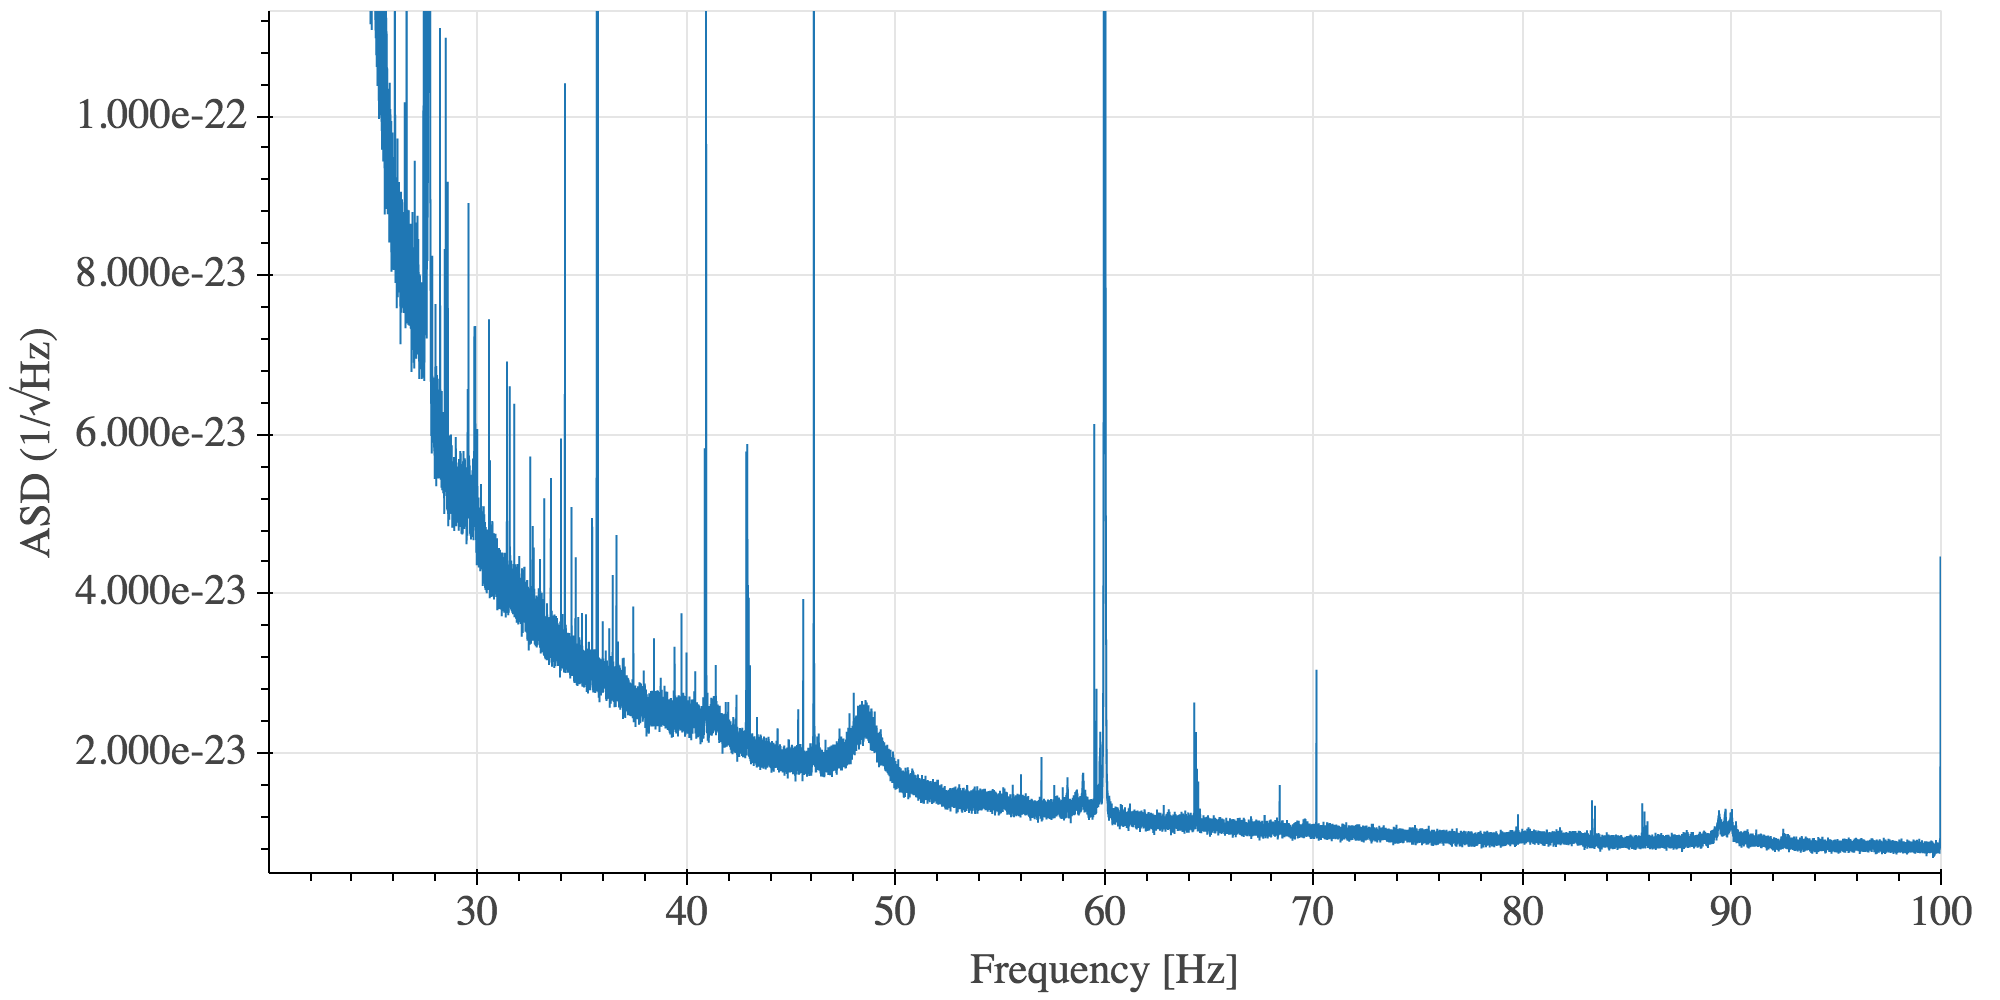
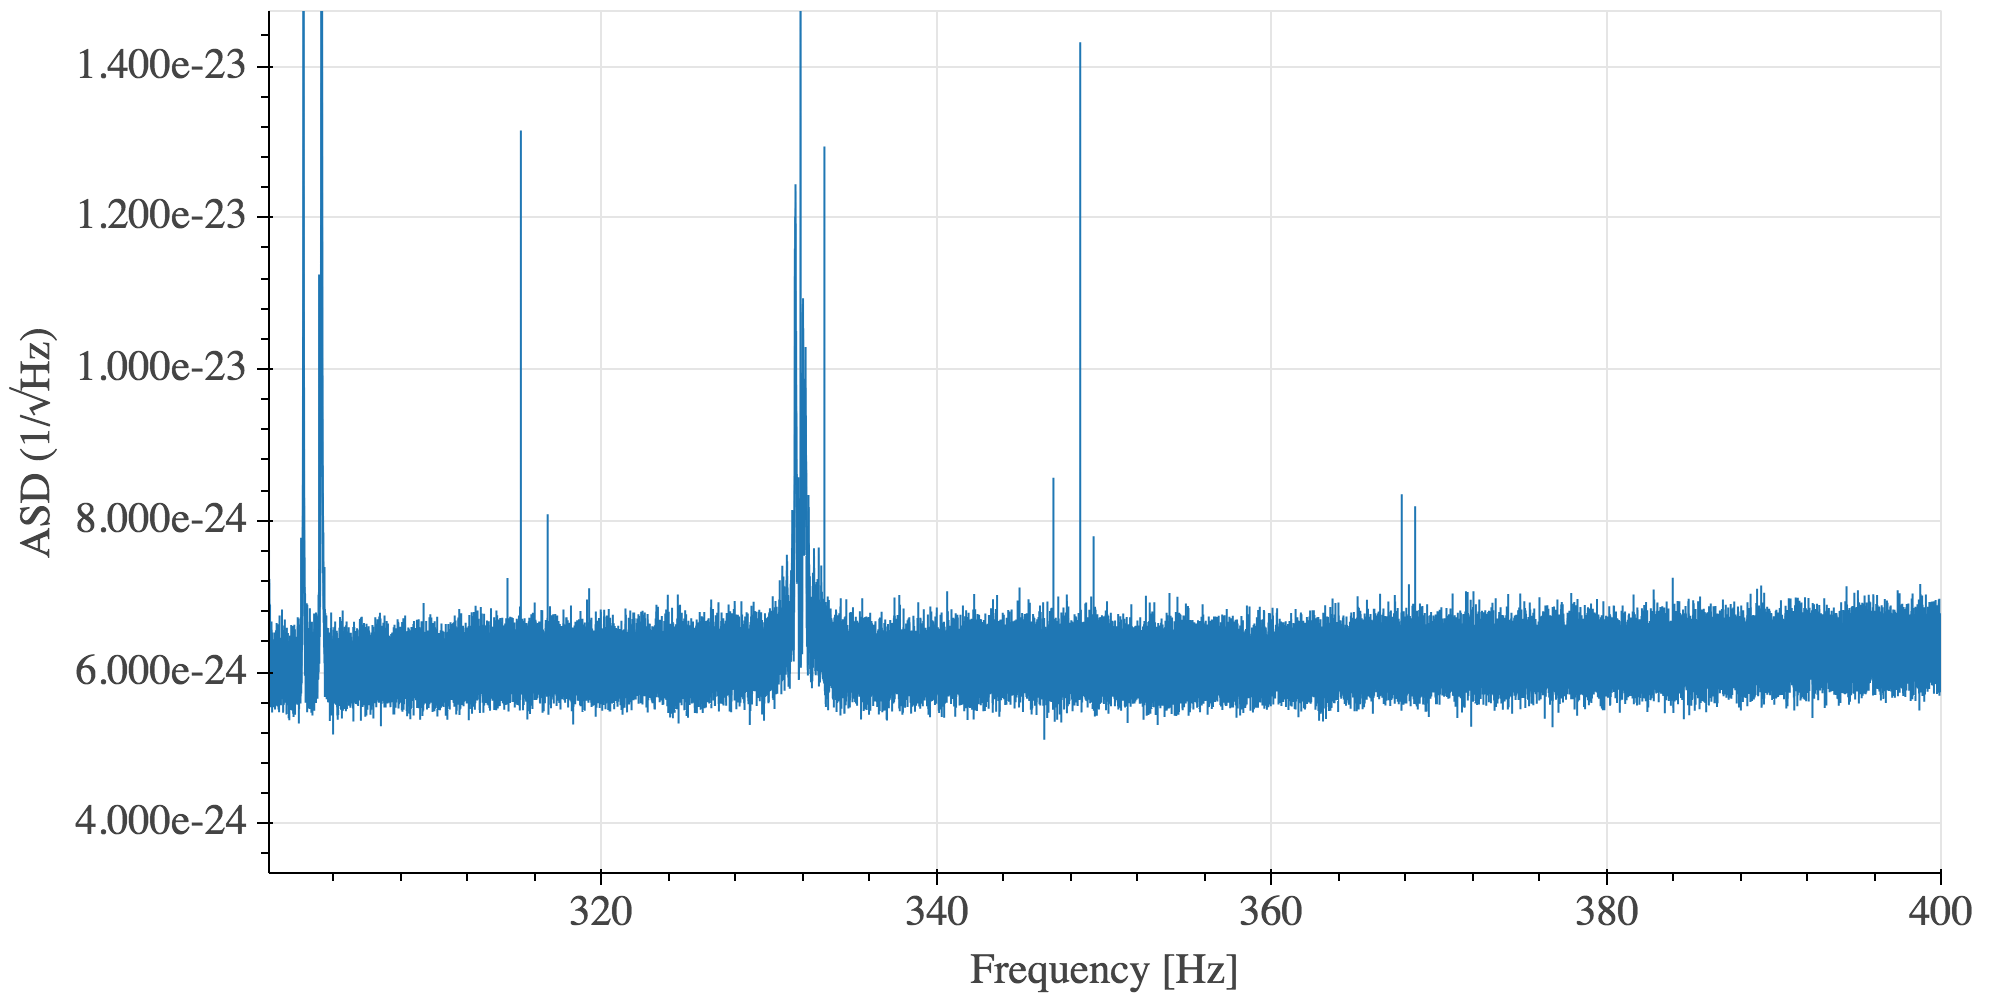
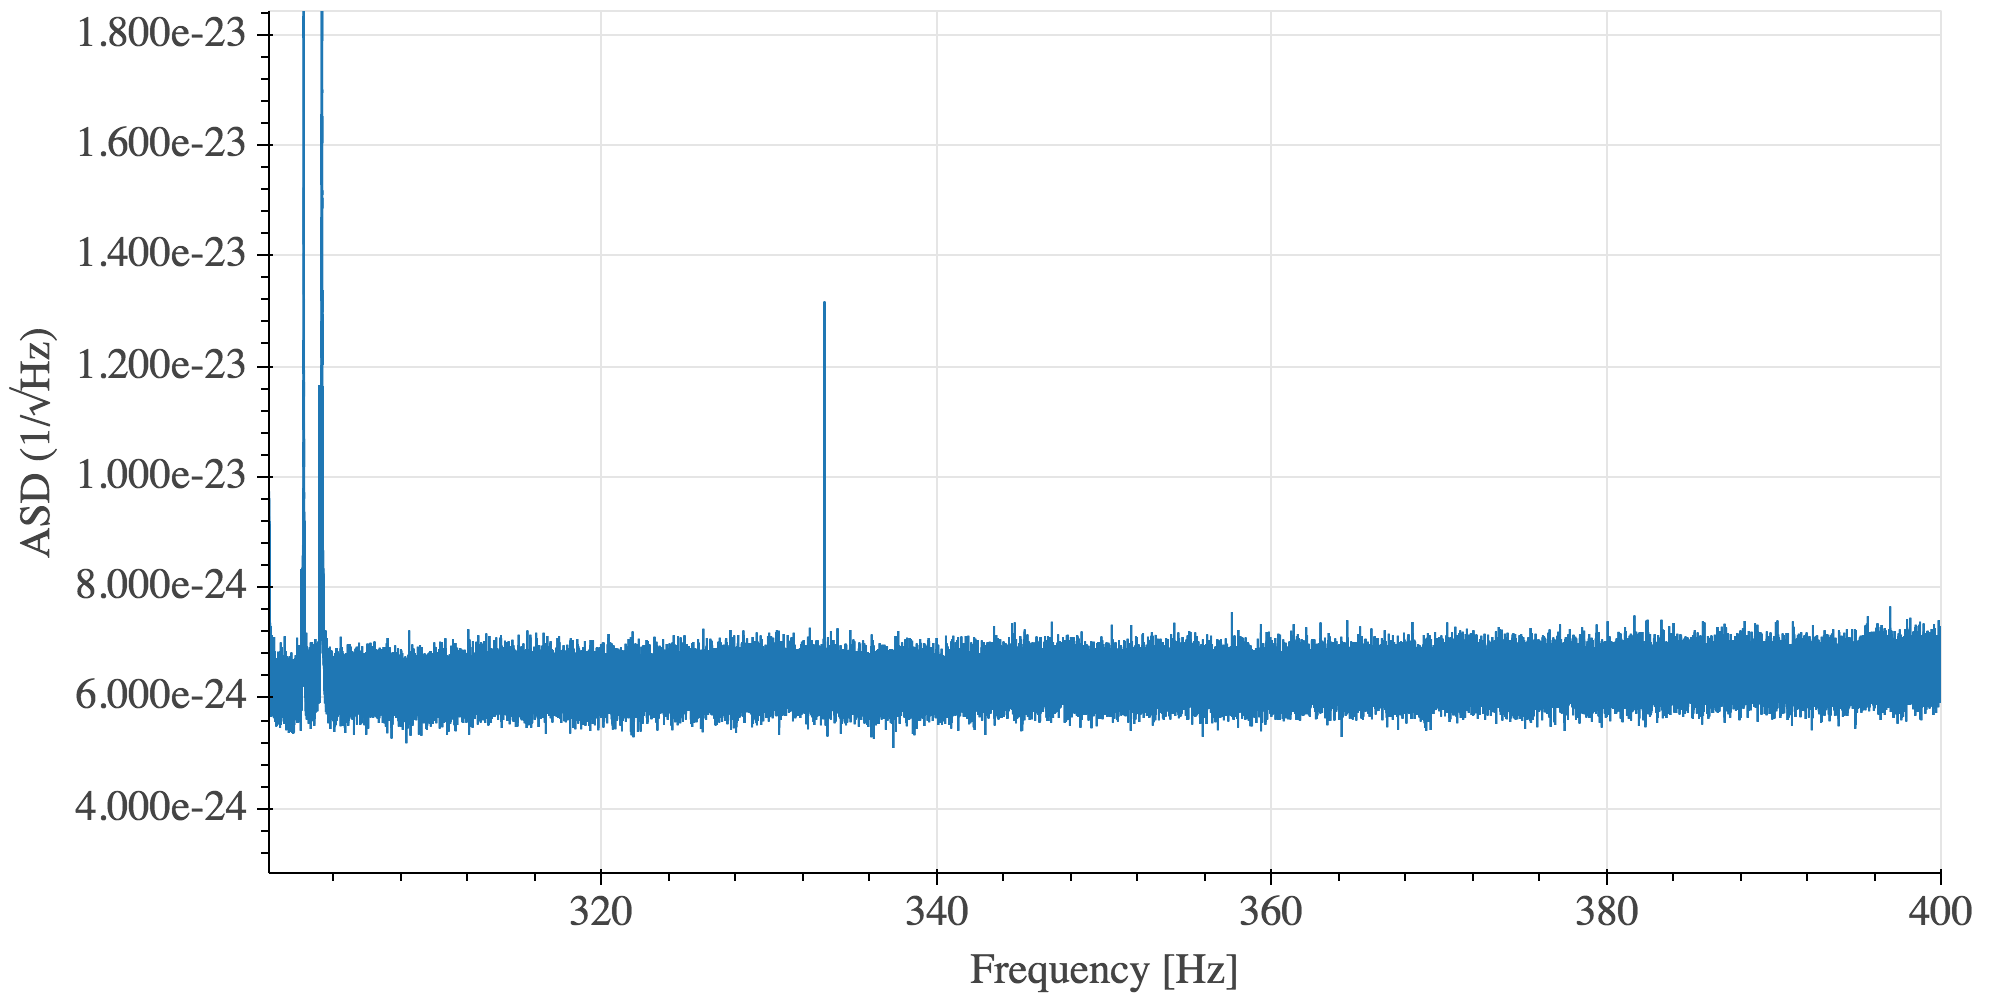
I took an average over spectras of 1800 s from before the calibration lines were moved and reduced and after this was done (noted here: https://alog.ligo-wa.caltech.edu/aLOG/index.php?callRep=48534 and https://alog.ligo-wa.caltech.edu/aLOG/index.php?callRep=48578).
The first two plots show a comparison over 20 to 100 Hz. 4 lines at 51, 51.8 Hz, ... (a comb of 0.8 Hz spacing) have disappeared, although I'm not sure this is related to the changes in the calibration lines. The three lines at 2*35.9, 2*36.7 and 35.6+36.7 Hz have also disappeared. As discussed in https://alog.ligo-wa.caltech.edu/aLOG/index.php?callRep=48161 and https://alog.ligo-wa.caltech.edu/aLOG/index.php?callRep=48357, if those three lines were really harmonics of those calibration lines it makes sense that they are gone since these lines have been moved. New lines have appeared, for example at 35.2 = 2*17.6 Hz, which could be linked to the new calibration line frequencies.
The two last plots show the range between 300 and 400 Hz. Not only the 331.9 Hz line has disappeared since it has been moved, also sidebands at 315.2 = 331.9 - 16.7 Hz, 348.6 = 331.9 + 15.9 Hz are gone.