To track more precisely the variation of the detector noise during the science run, I wrote a simple code that computes the band-limited RMS of the calibrated strain in a bunch of bands. This is a first step toward finding correlation between the noise variation and auxiliary channels.
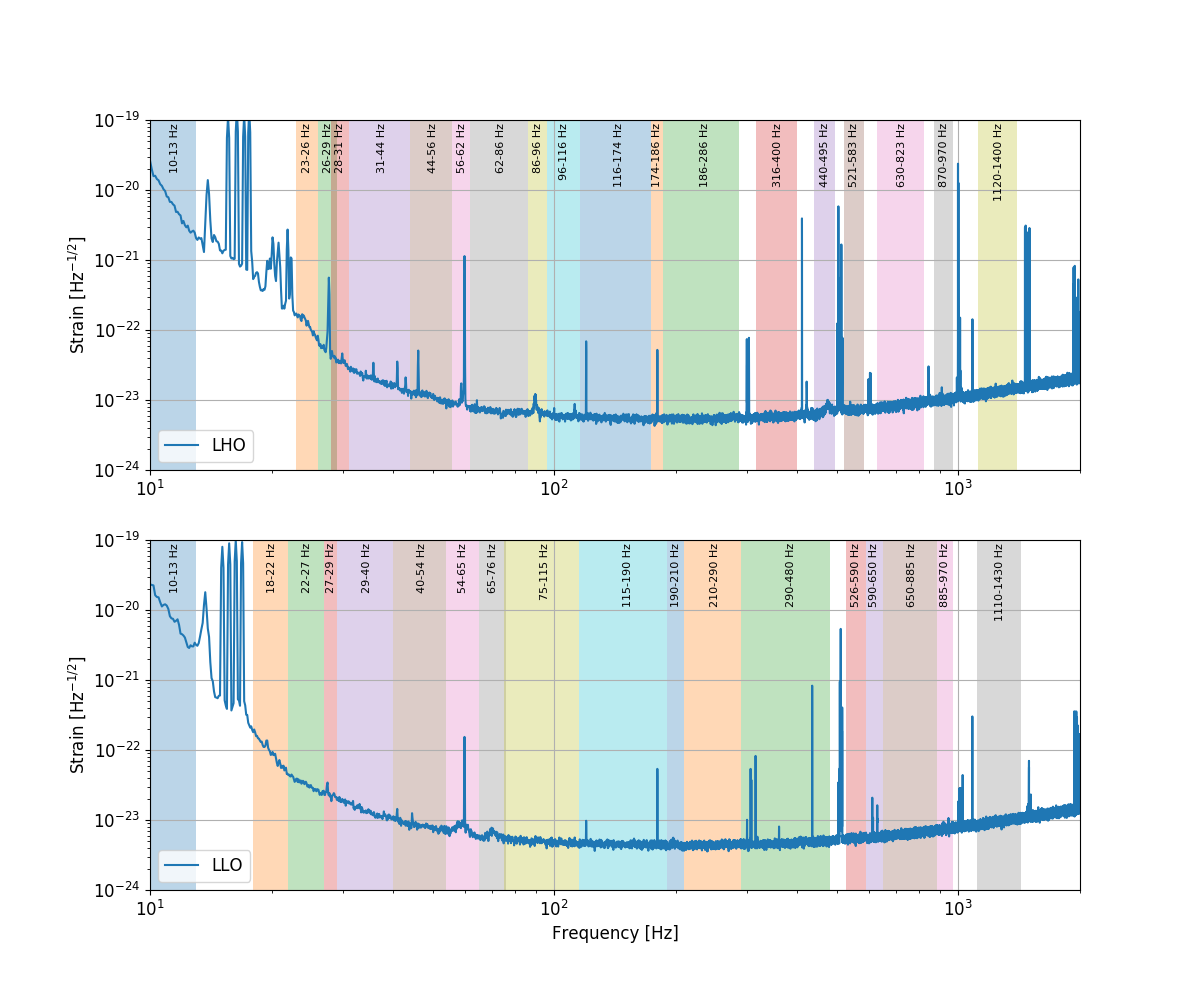
Instead of using a set of equally spaced bands, I looked at spectrum of GDS-CALIB_STRAIN and tried to select some bands that correspond to interesting regions and features. The plot below show the selected bands.
The algorithm resides on our GIT repository https://git.ligo.org/gabriele-vajente/blrms. So far it can query the segments database to select all times in ANALYSIS_READY and compute the BLRMS for all of them. The results are saved on disk and can be accessed at
https://ldas-jobs.ligo.caltech.edu/~gabriele.vajente/BLRMS_data/
See the README file for details. For each segment, there is a data file containing:
- T: vector of time samples, in seconds from the start time of the segment
- BLRMS: a python dictionary, each field is the time series of the BLRMS in a given band. So for example BLRMS['44_56'] is the BLRMS between 44 and 56 Hz. This variable contains the full BLRMS, obtained by integrating all frequencies in the range
- BLRMS_nolines: the code uses a median-based algorithm to estimate a smooted PSD without narrow lines. This variable contains the BLRMS integrated over frequencies excluding the lines
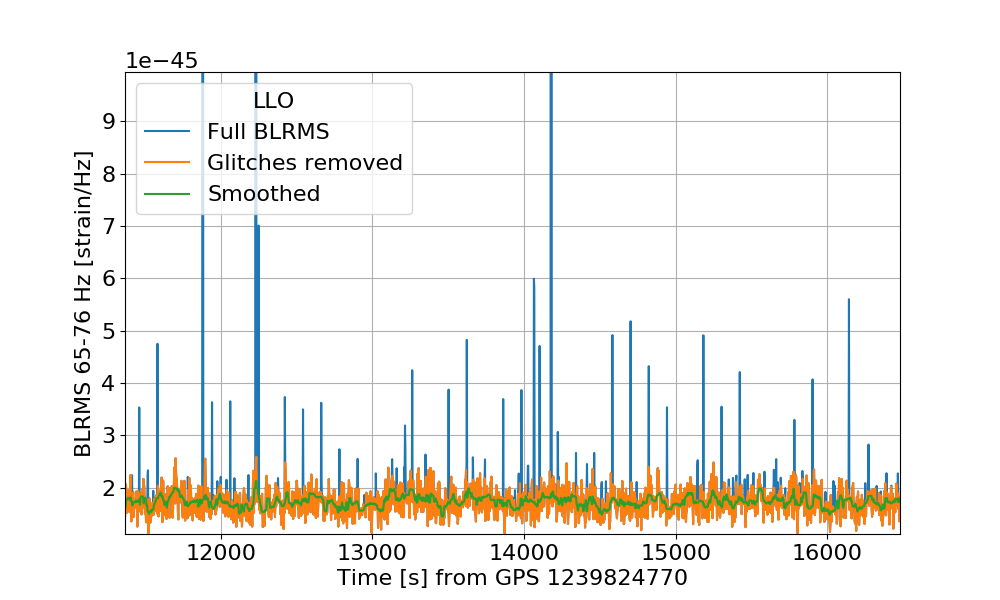
The time series consist of a BLRMS value every 2.5 seconds, computed with 5-seconds-long FFT and 50% overlap. Sometimes there are glitches in the data that makes it hard to interpreter what happens to the BLRMS. For this reason the code implements two ways to remove glitches
- compute a median smoothing of the BLRMS time series, with a sliding window 40-seconds-long. The results are saved in the variables BLRMS_smooth and BLRMS_nolines_smooth.
- Using the same sliding window, the code also computes a sort of standard deviation of the data, but using median instead of mean, to be more robust against glitches. All times where the BLRMS value has an excursion from the median larger than three time this "median-based-standard-deviation" are excluded, to obtain a "glitch-free" time series. The results are saved in the variables BLRMS_noglitch and BLRMS_nolines_noglitch
Some examples of the results in the plots below.
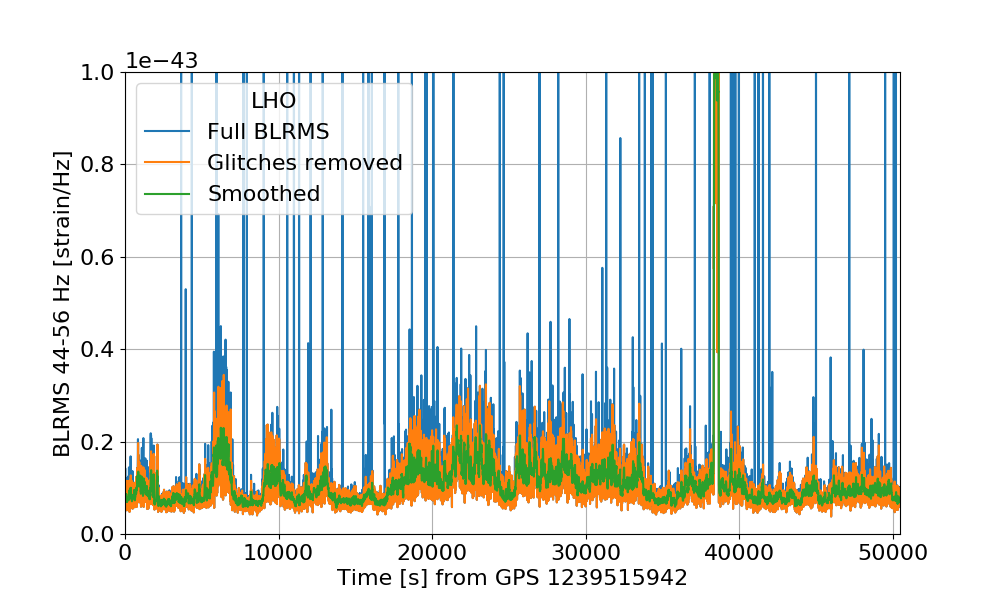
The first plot shows the BLRMS in the LHO band 44-56 Hz, which shows a little bump with amplitude that changes with time. There is also a line in this band, which is removed by the algorithm. The traces below show the effect of smoothing and glitch removal.
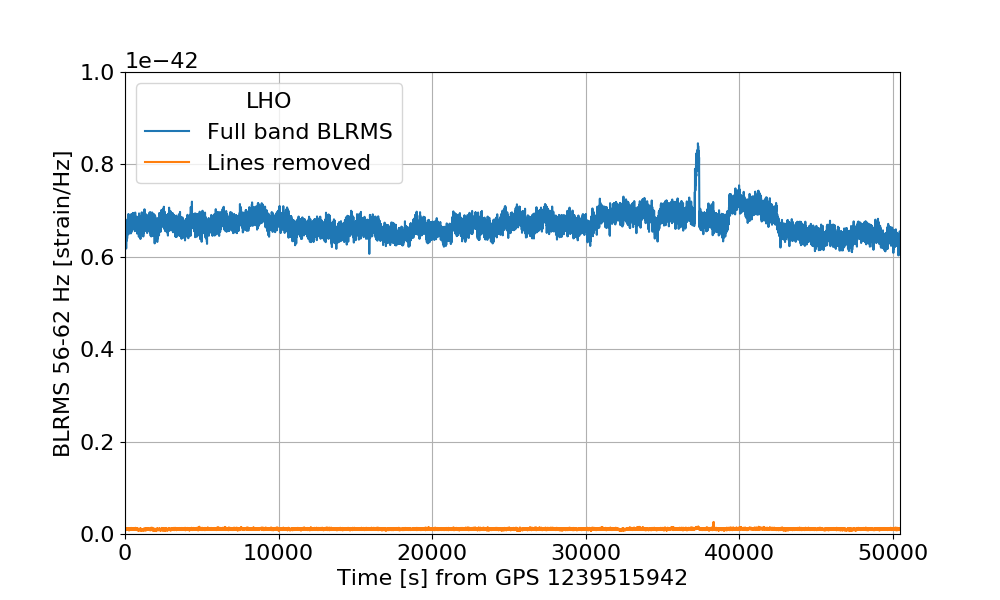
The second plot below shows the effect of line removal for the band 56-62 Hz, which is affected by a large 60 Hz.
Finally, the last plot shows the effect of the glitch removal algorithm, by zooming in on the time axis: