david.barker@LIGO.ORG - posted 16:36, Thursday 25 April 2019 (48769)
Trending Hardware Watchdogs to verify operation
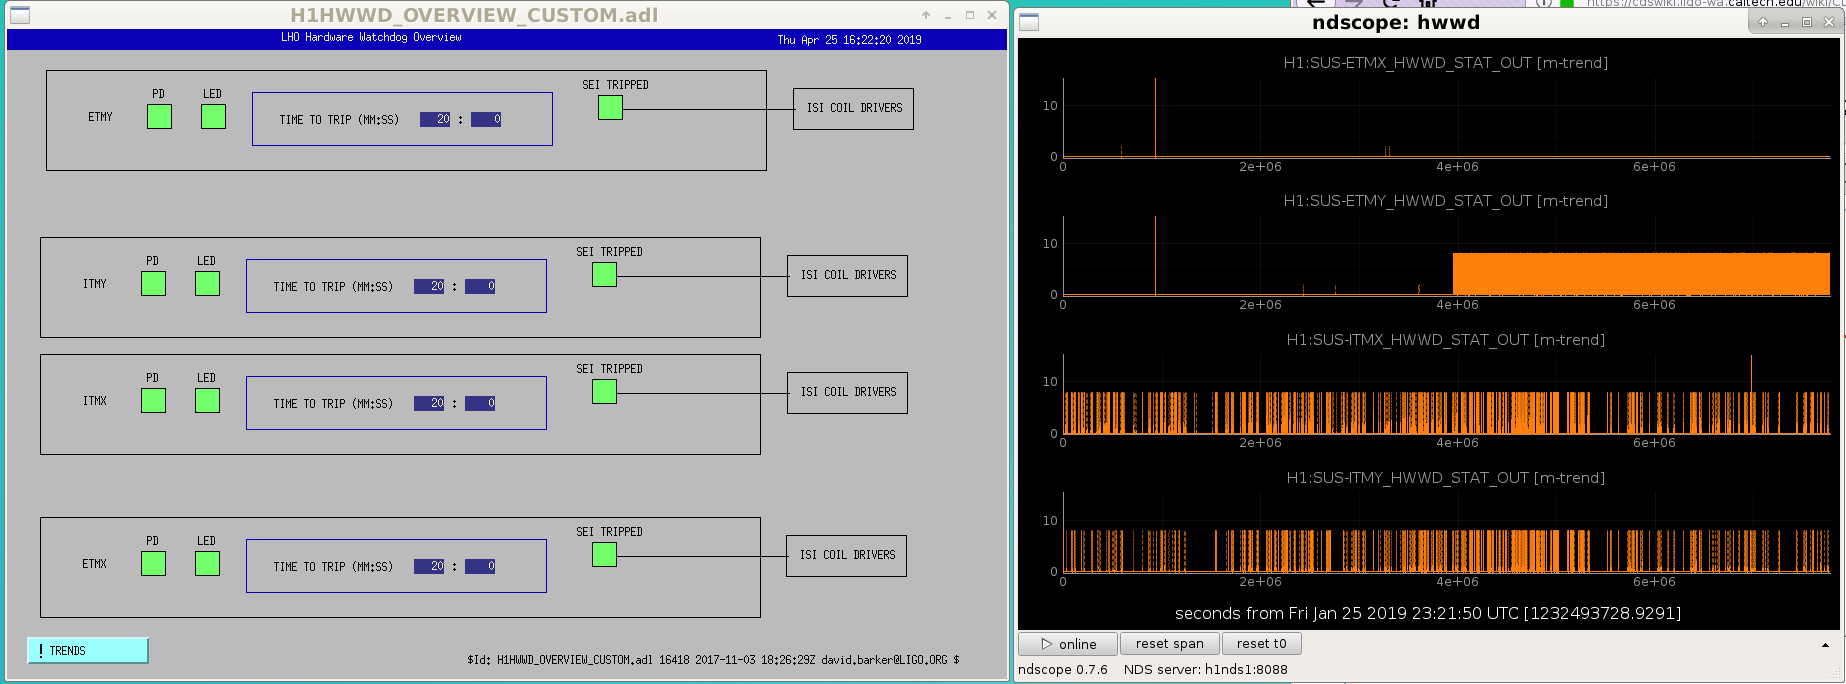
I've added a TRENDS button to the lower left of the HWWD MEDM screen. This allows you to trend the HWWD channels for 1, 2 and 3 months in the past.
How to read the trends: a value of 2 means the photodiode RMS exceeded its threshold, this is most probably due to physical movement of the test mass. A value of 8 means the LED draw current fell below threshold, this most probably means the suspension was under high drive and its monitor voltage dropped.
ITMX, ITMY show val=8 at a medium rate. ETMY shows val=8 at a high rate (starting about 6 weeks ago). ETMX is quiet, just showing few val=2 over two months ago.
Lines which go off the top of the y-axis are most probably bogus DAQ values and should be ignored.
Images attached to this report