evan.goetz@LIGO.ORG - posted 15:31, Wednesday 01 May 2019 (48903)
First 4 weeks of O3 spectral artifacts overview
This is a summary of the first 4 weeks of O3 on narrow spectral artifacts that degrade astrophysical search sensitivity to long duration narrowband signals (CW and/or stochastic GW searches). All search groups can be happy that the detectors are performing better than ever, so well done to commissioning teams!

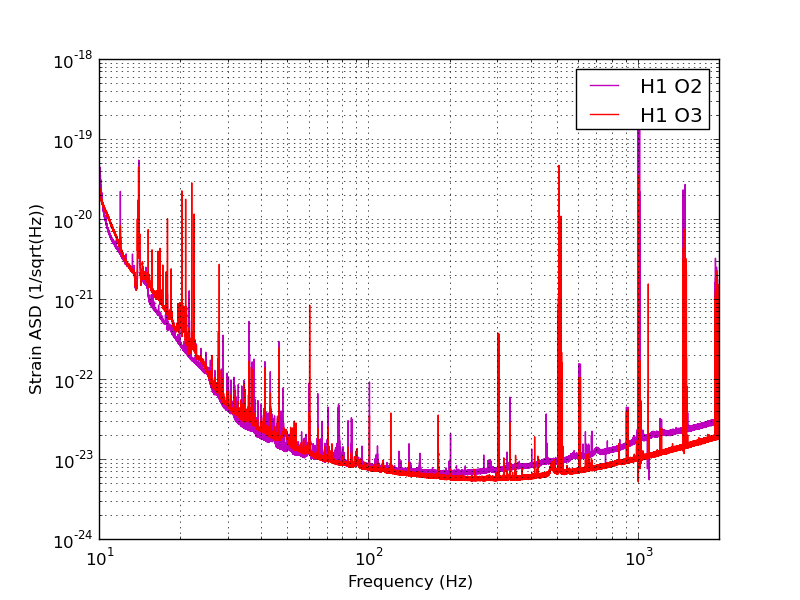
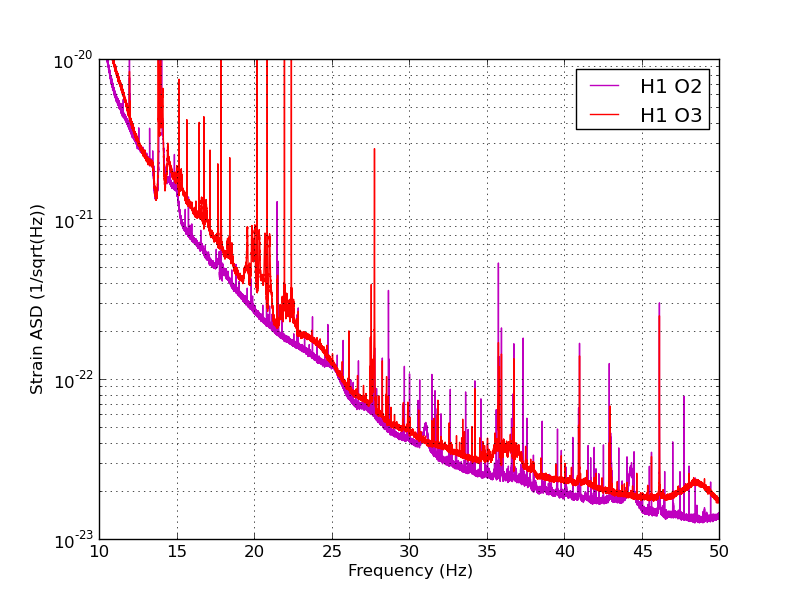
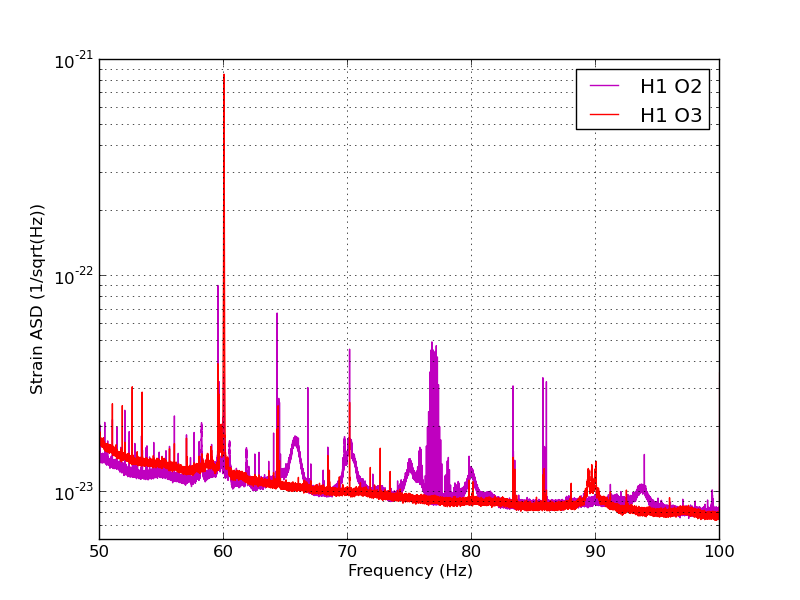
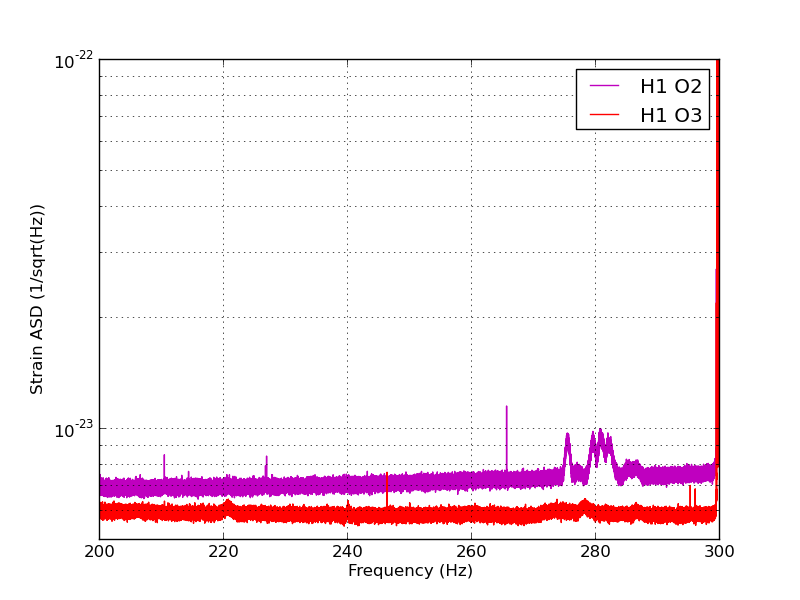
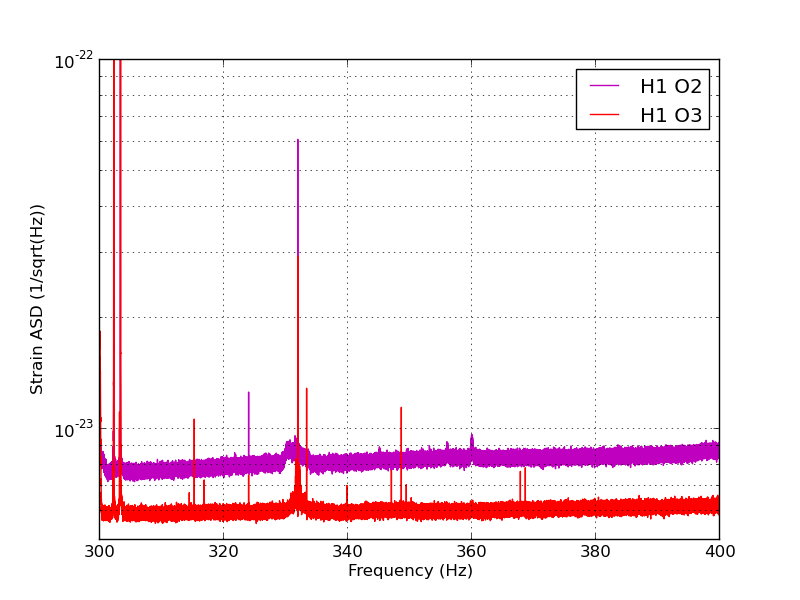
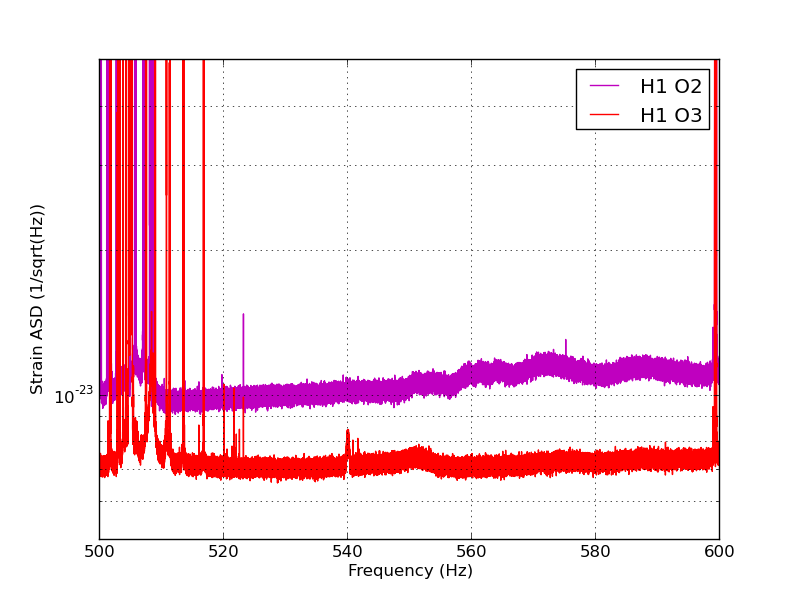
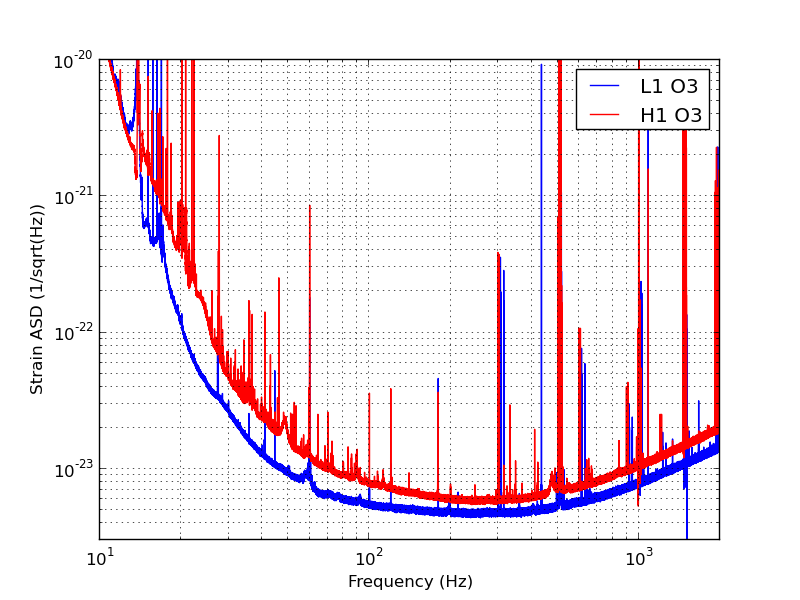
Overall, there is a general reduction in spectral artifacts over O1 and O2, but there is still more work to do, especially when comparing H1 to L1. The 10 - 100 Hz band remains problematic, but there is good improvement in most of the rest of the frequency band.

Data is taken from the Fscan automatically-generated SFTs of GDS-CALIB_STRAIN that are 1800 s long and use Tukey windowing. These SFTs are processed using the lalapps_spec_avg_long tool to generate the data files below.

O3 data can be found on the LHO cluster under:
~evan.goetz/CWDQ/O3/O3_[H|L]1_April2019.txt
where columns are given by
frequency, arithmetic mean PSD, arithmetic mean ASD, noise weighted PSD, noise weighted ASD

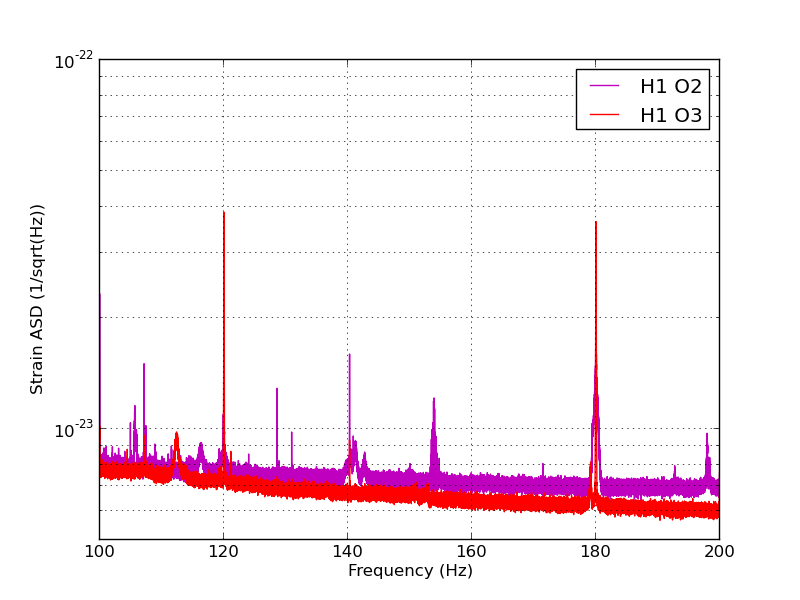
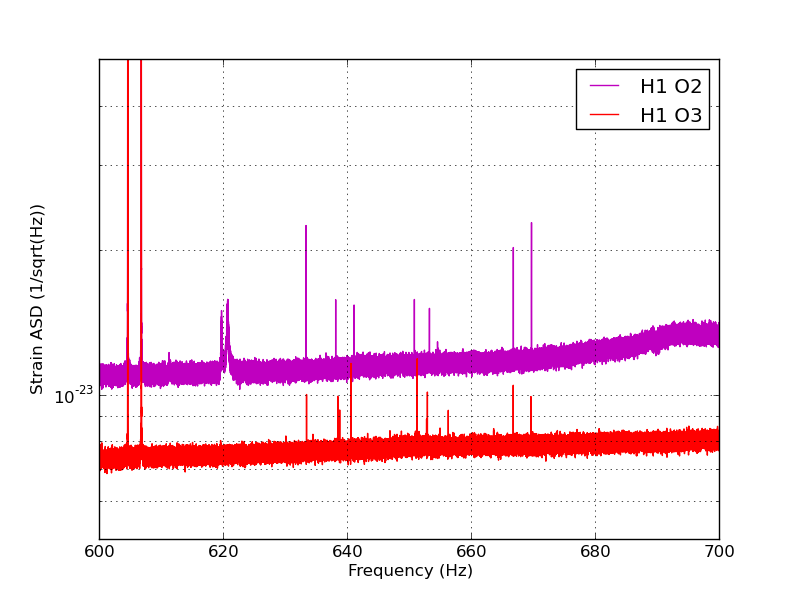
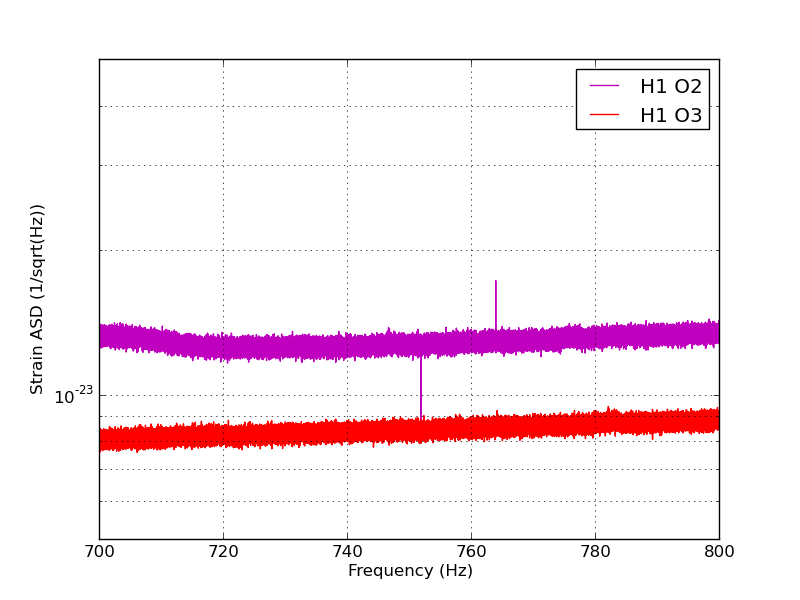
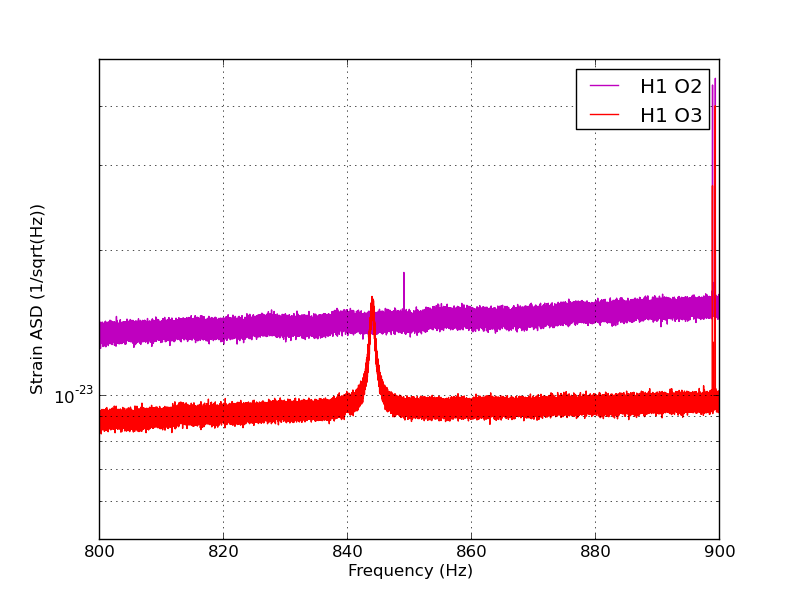
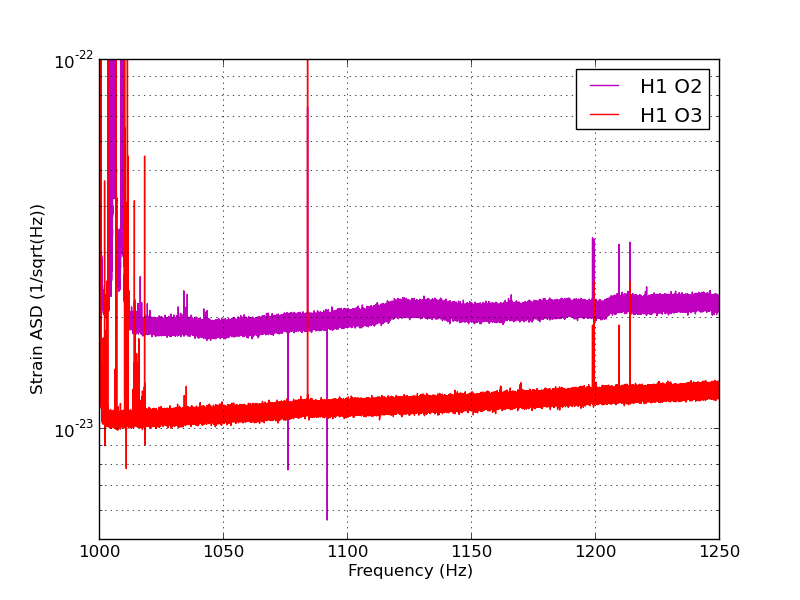
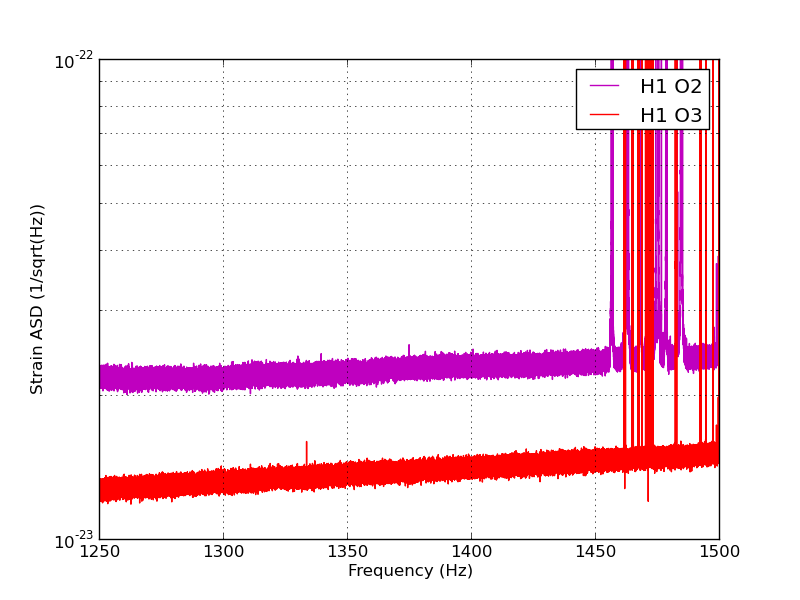
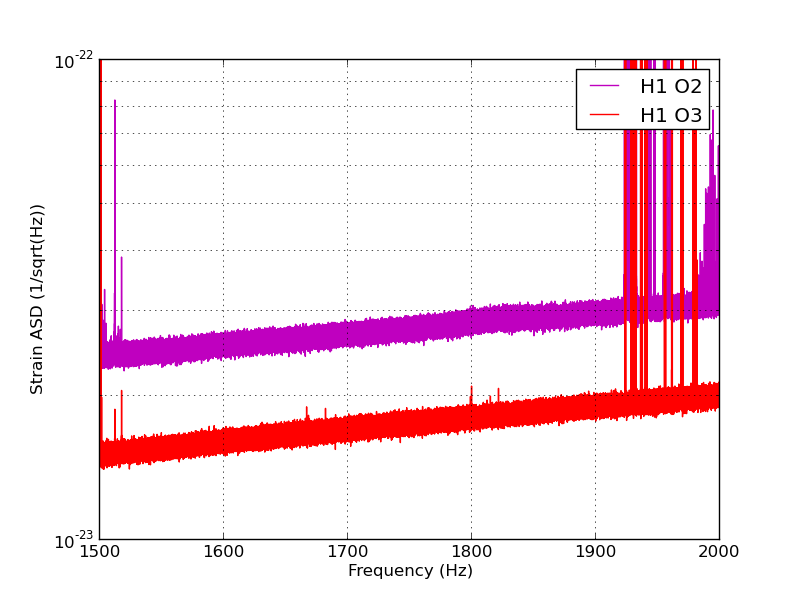
Attached are figures plotting this data showing the 10 Hz - 2 kHz band, and then zooms on specific regions (10-50 Hz, 50-100 Hz, 100 Hz bands from 100 Hz up to 1 kHz, 1 kHz - 1.25 kHz, 1.25 - 1.5 kHz, and finally 1.5 - 2 kHz). All plots show a comparison for H1 between O2 (June 2017 only) and O3 (first 4 weeks only). A final plot shows an O3 (first 4 weeks only) comparison between H1 and L1.

Some general points:
o While improved over O2, the 10 - 100 Hz band remains problematic for H1. Maybe there are some things done at L1 that can be applied also at H1 to improve this low frequency data
o There is good improvement in many bands; even as the broadband noise improved, more noise lines were not revealed. Good!
o Some new lines are present that were not there in O2 (dang, can't have everything...)
o Violin suspension resonances are spaced out more than in O2 (by design, I believe), but I can't tell if there is work to actively damp them during observing. The shoulders of the resonances are not too terrible, so maybe that implies some amount of damping work is in-place. When these ring up, lots of new lines can appear due to these loud peaks beating against other noise lines and introduce new noise into h(t). Keeping the violin line amplitudes to a minimum can help mitigate this effect.
o Some comb-like structures in the mid-600 Hz band seems to remain but with lower amplitude

Highest priority is to figure out coupling mechanisms of 10 - 100 Hz lines/combs and see what possible mitigation can be done. LLO may have some suggestions to assist with that.

Second priority is to understand some of the other line structures observed. Perhaps solving the low frequency line issues may also mitigate some of the higher frequency lines/combs

We will continue to monitor the data and provide further updates. Hopefully mitigations will help improve the spectrum!
Images attached to this report