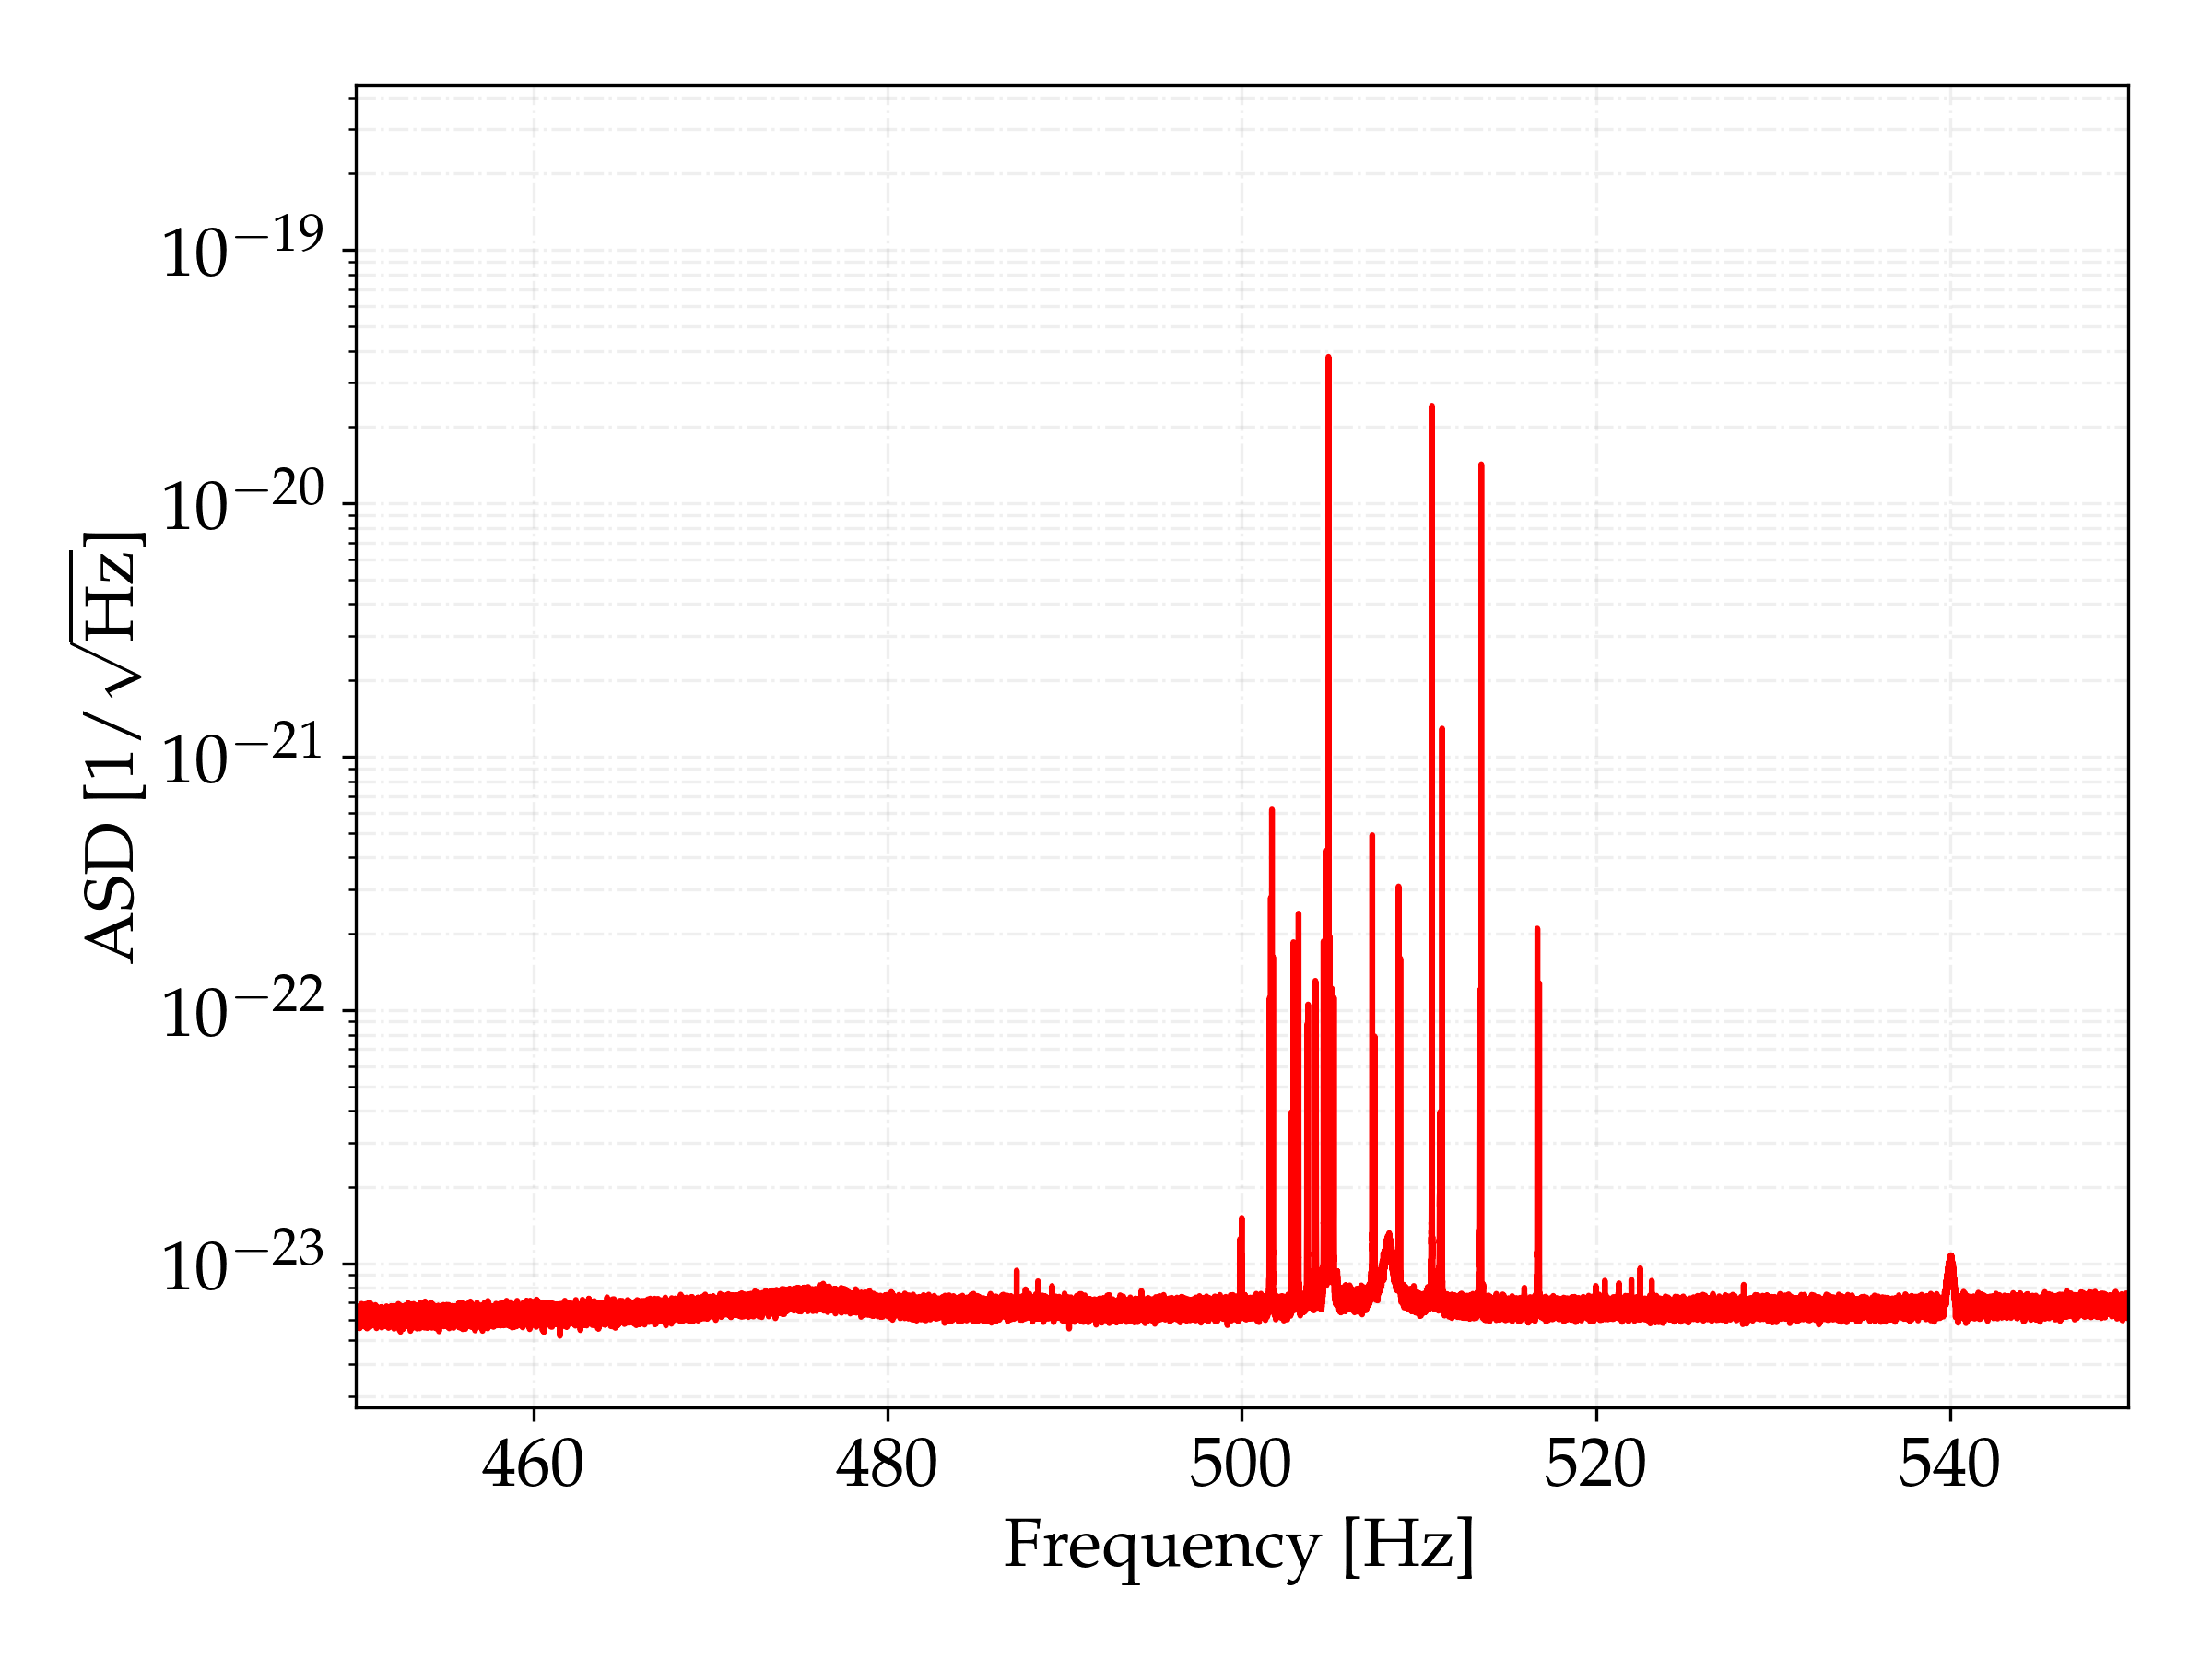
I've created average spectra from days May 8, 9, 10, 11 and 12. You can see the plots in this link: https://ldas-jobs.ligo-wa.caltech.edu/~pep.covas/O3/MaySecondWeek/H1_clean-epoch_amp-wght/
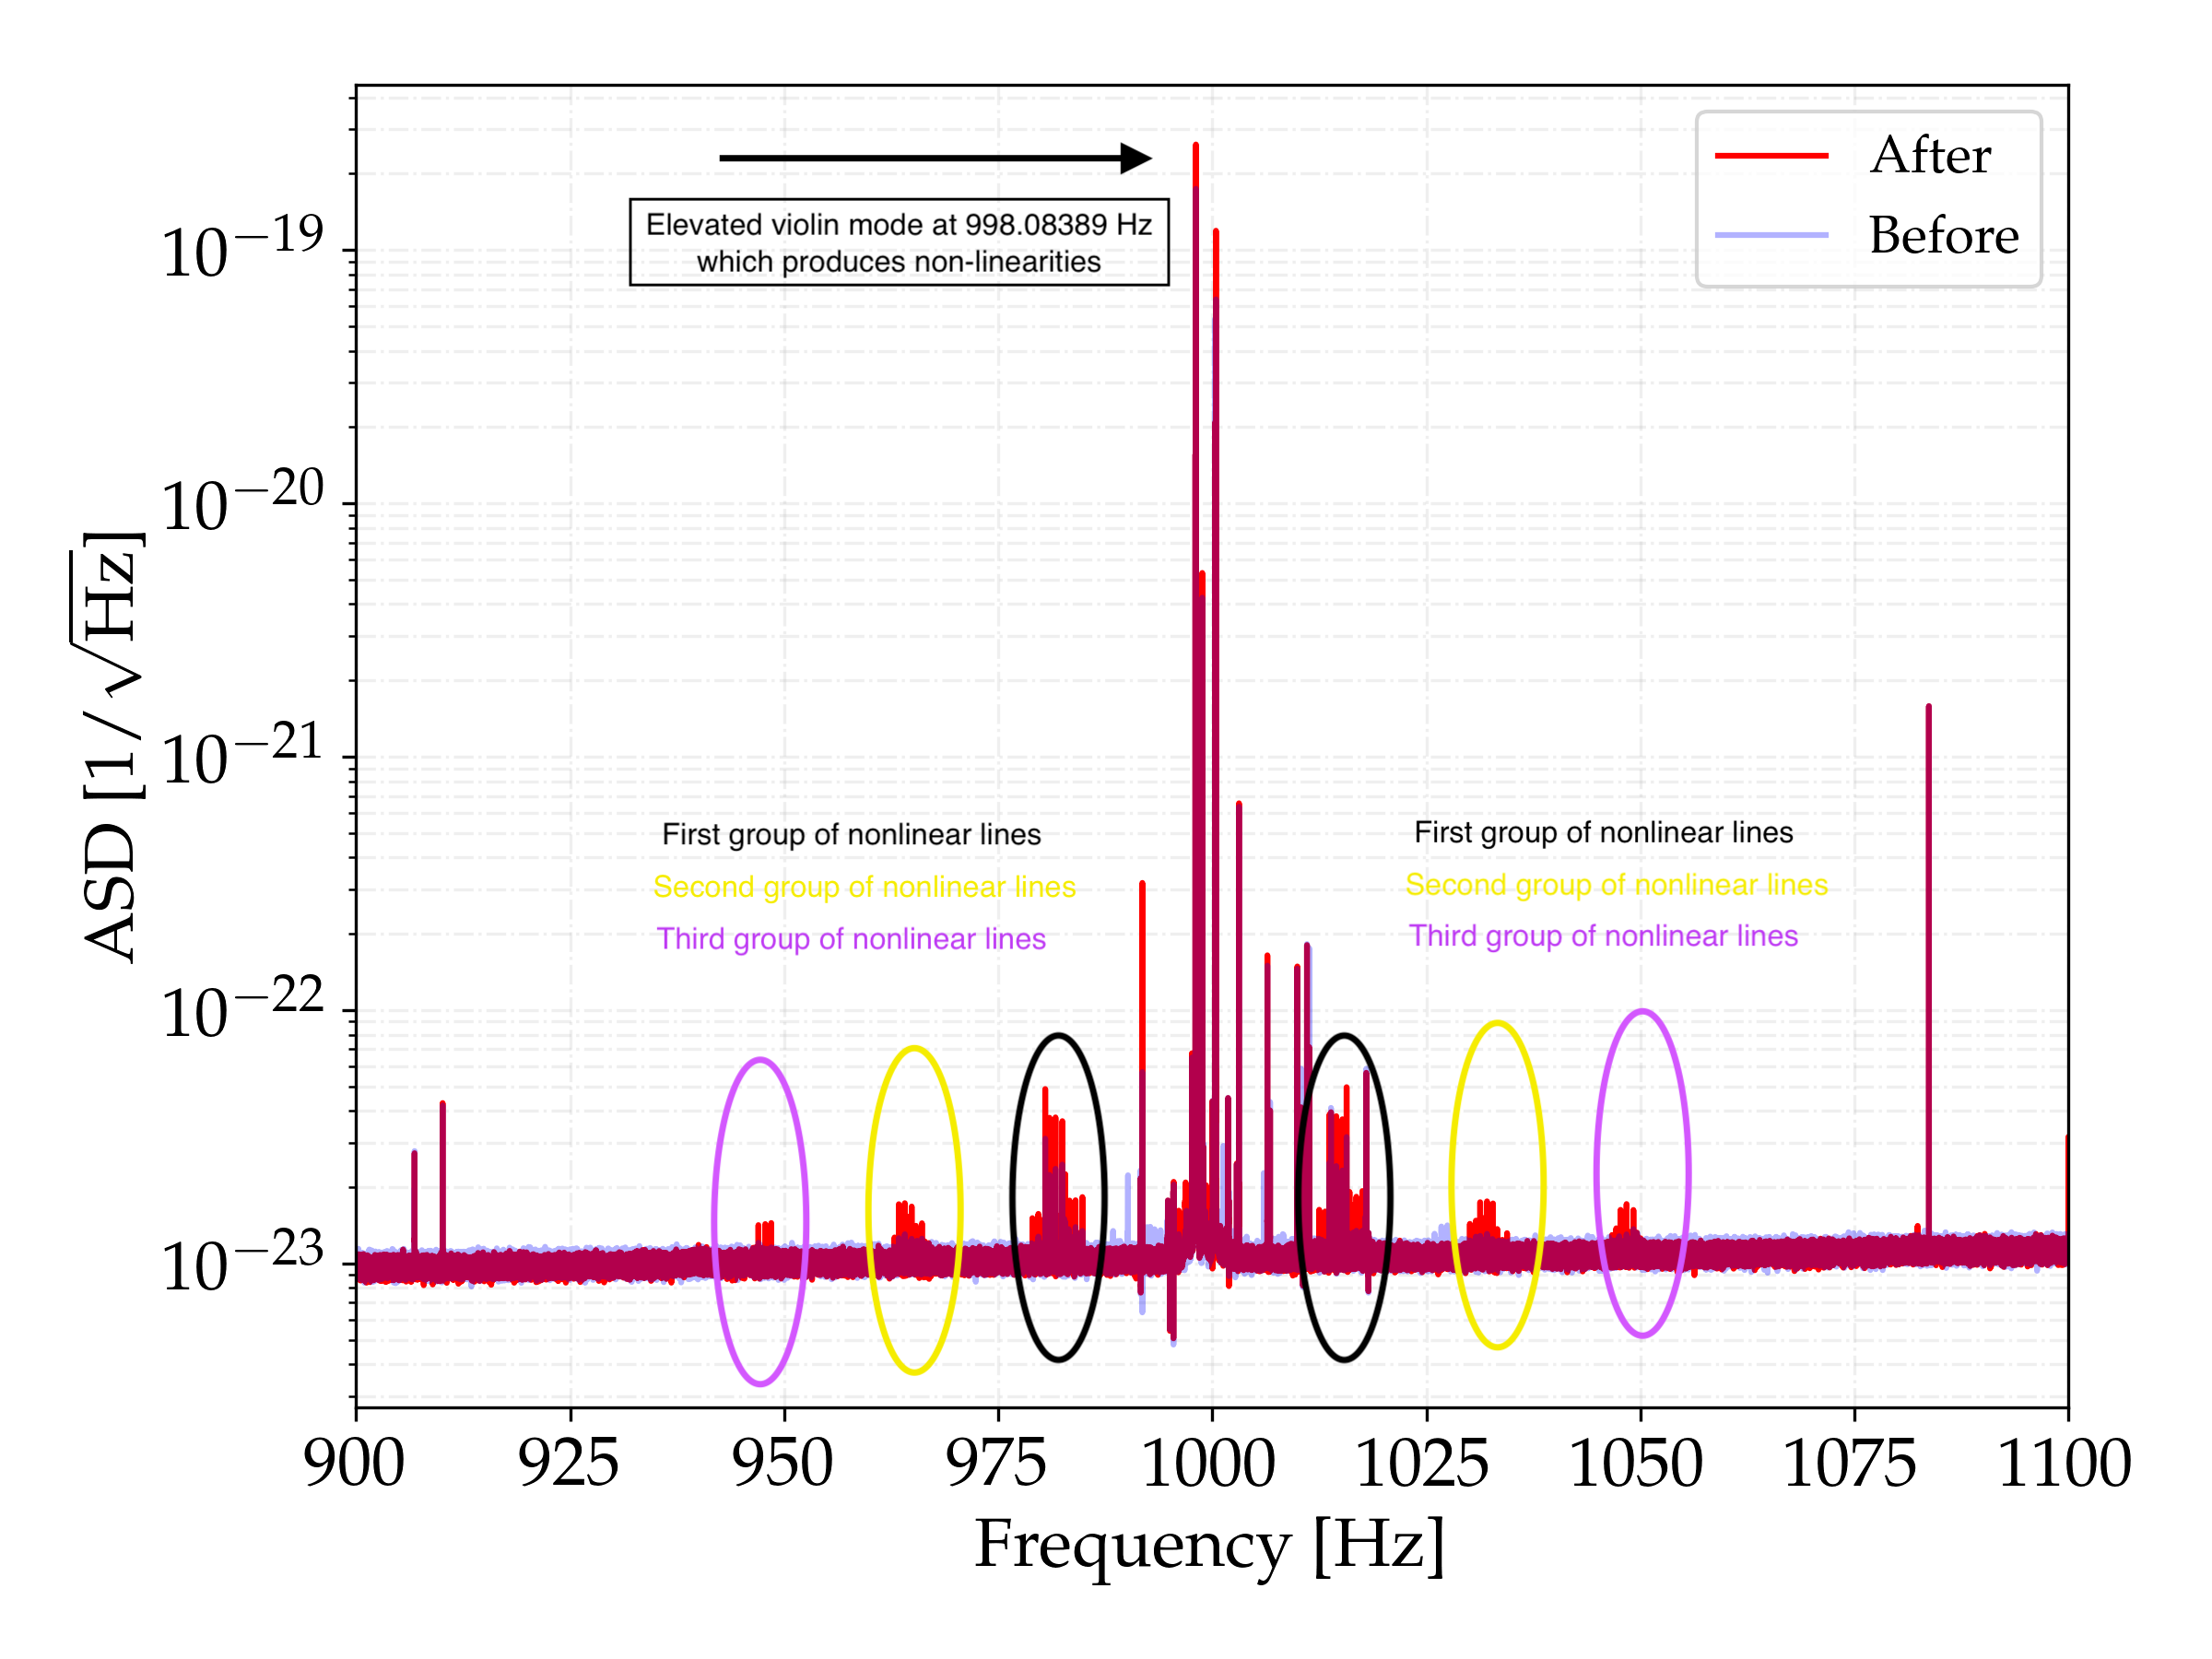
One interesting new feature is around the 2nd order violin mode harmonics. Many new lines have appeared around the frequency 998.083889 Hz, which is a violin mode of ITMX which has been more excited than usual.
The first attachment shows a comparison with a previous week where this mode was not as excited (the second one is a zoom). You can see that 3 groups of lines have appeared on each side of this violin mode. Each of these groups of lines contains lines which are exactly located at frequencies which are a combination of the violin mode and one of the four calibration lines (15.6, 16.4, 17.1, 17.6), like 998.083889 - 17.6 Hz or 998.083889 + 15.6 Hz (all of these lines show values of bicoherence close to 1). In a previous alog (https://alog.ligo-wa.caltech.edu/aLOG/index.php?callRep=48161) this behaviour was already noticed, but now it seems that more than one group of nonlinear lines is created around the violin mode. The extra groups of lines are also located at nonlinear frequencies like 998.083889 - 2*17.6 Hz or 998.083889 + 3*15.6 Hz and also show values of bicoherence close to 1 (bicoherence between a calibration line and the previous group of nonlinear lines). I'm not sure if these extra lines are created due to a trilinearity (e.g. ASD(f1)^2 * ASD(f2) -> ASD(2*f1+f2) ) and higher order features or due to a bilinearity between the firstly created new nonlinear lines (closest group to the violin mode) and the calibration lines.
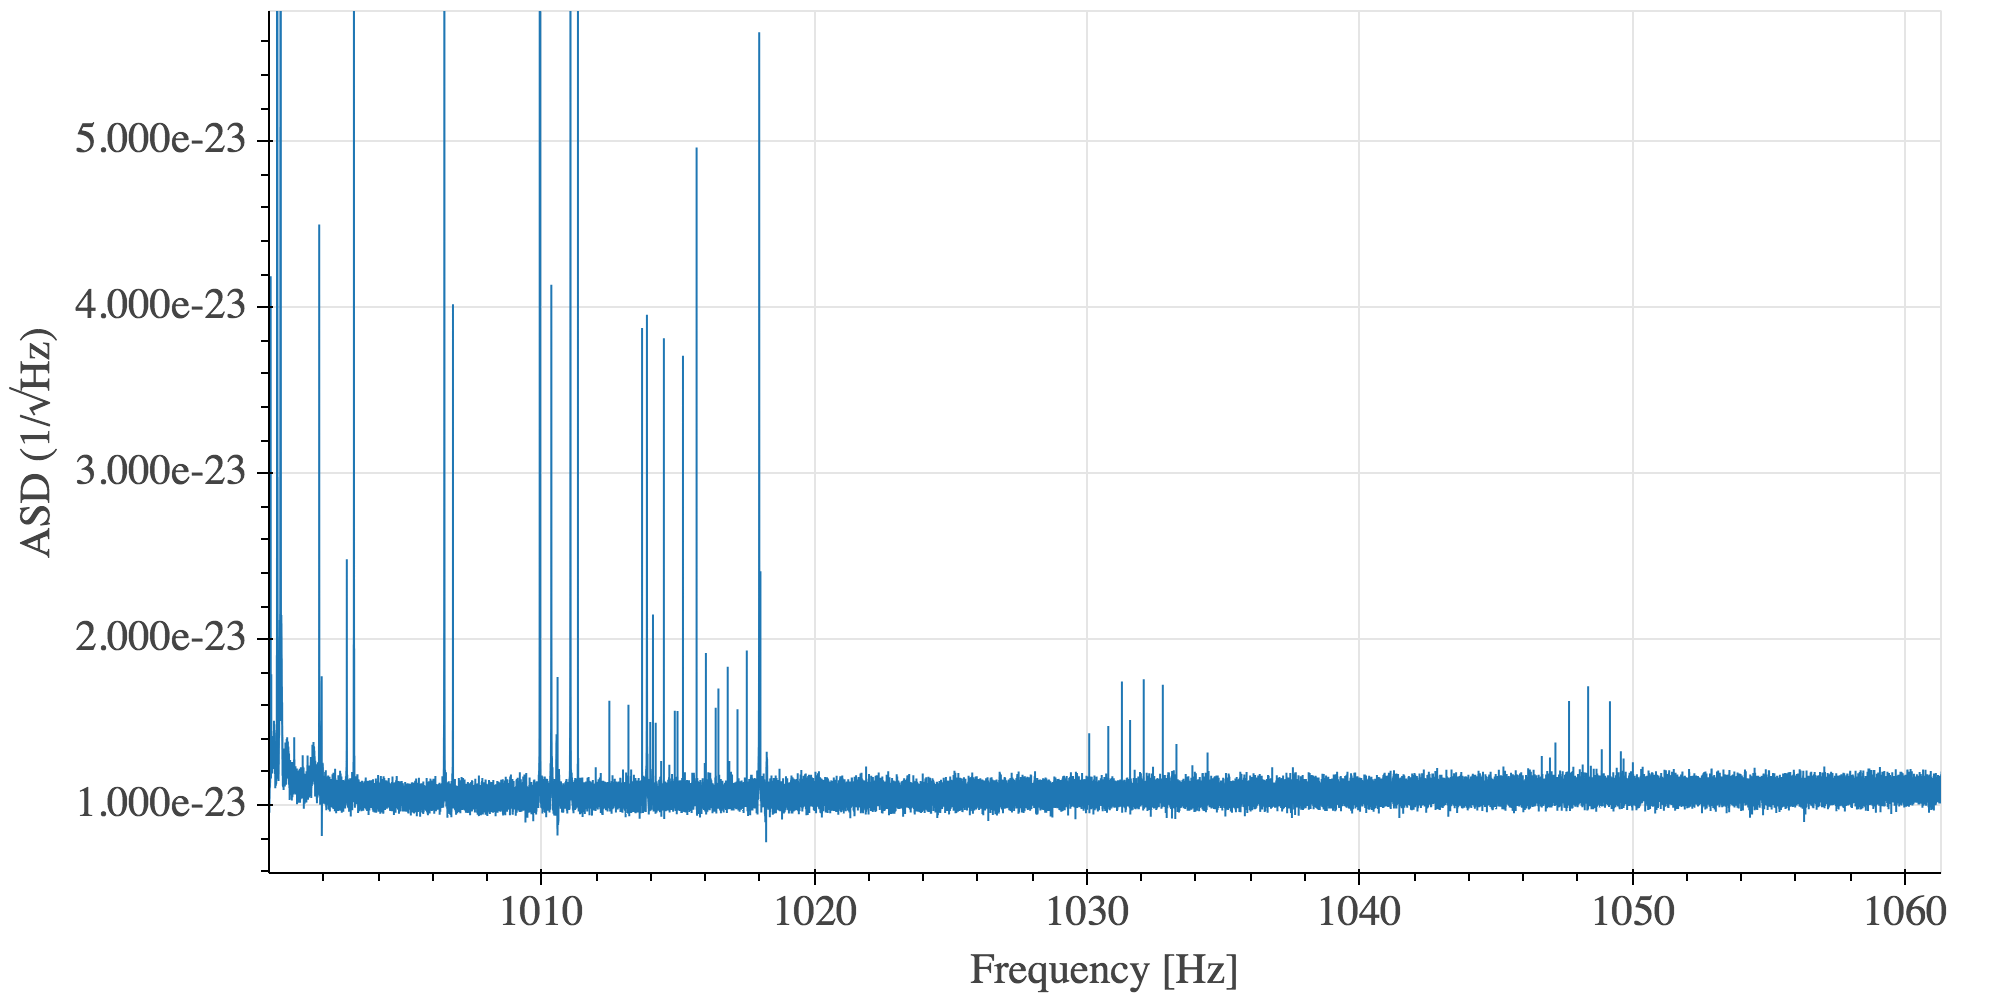
In the third image you can also see some lines around the first violin mode harmonics which are due to nonlinearities, as noticed in the past, although only one group at each side of the mode can be seen.
In order to prevent this (which is highly contaminating the spectrum and impacting CW searches), we should try (if possible) to better damp the violin modes as soon as they are increased above "nominal" values, decrease the amplitude of the calibration lines or improve the behaviour of the DACs when driving near saturation (https://alog.ligo-wa.caltech.edu/aLOG/index.php?callRep=48357).