M. Wade, A. Viets
I have finished creating DCS calibration filters files for the C01 h(t) frame production. The first epoch for C01 h(t) frames will use filters file
aligocalibration/trunk/Runs/O3/GDSFilters/H1DCS_C01_1239472998.npz
I have attached plots from sanity checks run using this filters file on data from GPS times 1239720596-1239723372. The first attached plot is an ASD comparison of data calibrated with this filters file (expected C01 data), the corresponding C00 data, and the corresponding CAL-CS data. The second plot is the ASD ratio of these three strain products. The third plot is the response function as derived from the expected C01 data and the CAL-CS data compared to the pyDARM model response, and the fourth plot is a zoom-in on the ratio of this response function comparison. All of these tests indicate that this filters file is ready for use on C01 data, giving the expected level of agreement in each comparison.
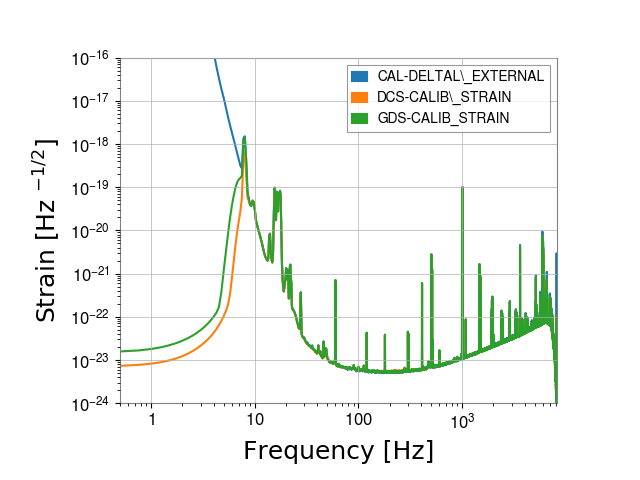


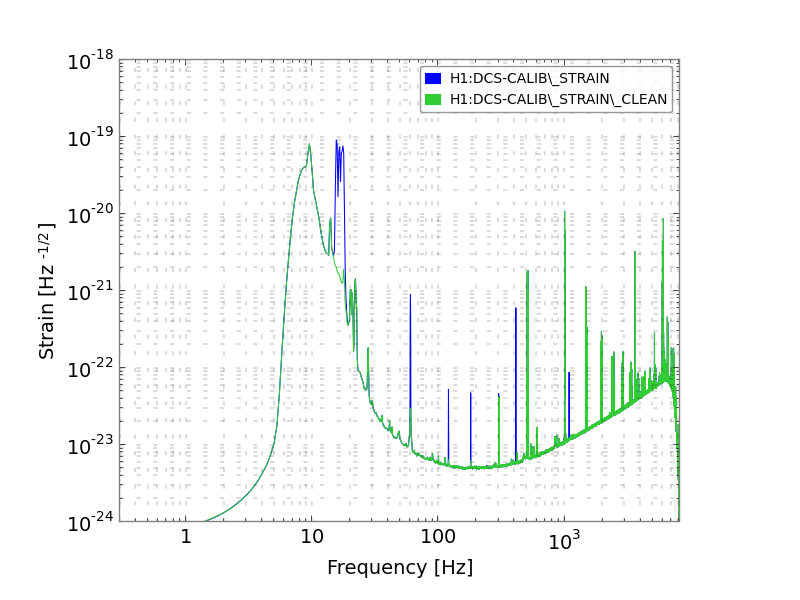
I've made a few more plots to test these filters. The first three show the filters' effect on real data, compared to the frequency-domain model. The actuation filters show some apparent deviation at low frequencies, but this is likely due the the large dynamic range spanned in that frequency range, as it does not show up in the response function plot. The fourth plot shows the response function produced by the filters, compared to the frequency-domain model (same type of plot as in the above aLOG, but uses a different transfer function algorithm in an effort to reduce noisiness). The fifth plot shows ratios of DeltaL / Pcal at the calibration line frequencies. The points labeled "DCS" include compensation for all time dependence except for that of the SRC. The points labeled "+SRC" additionally include compensation for time dependence of the SRC. A significant improvement is seen at the 17.1 Hz line. The sixth plot shows comparisons of h(t) to the cleaned data, to show that it is working.


I analyzed some longer stretches of data to assess the impact of SRC tine-dependence on calibration accuracy. Unfortunately, it has been difficult to analyze more than a day at a time, for two reasons:
- There are frequent dropouts in the C00 data
- Compensating for SRC detuning time dependence requires re-calibrating the data, which takes a while to do.
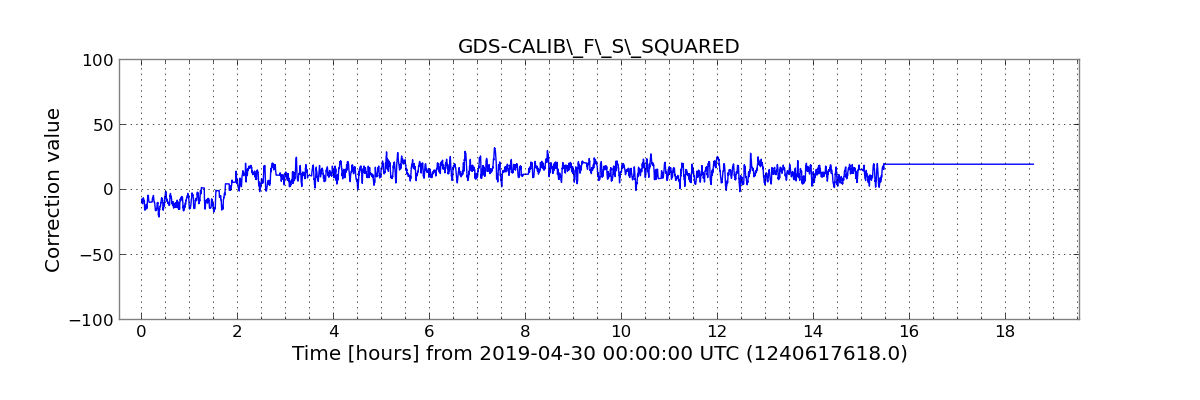
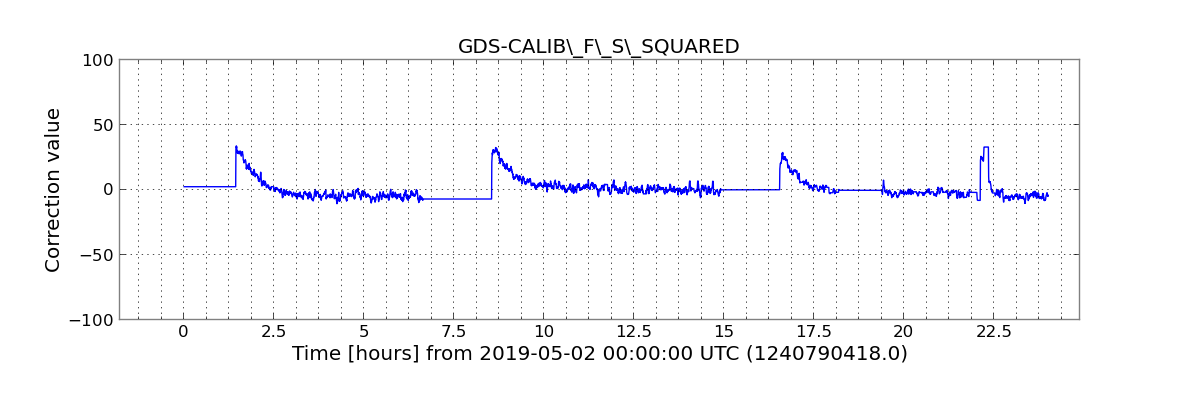
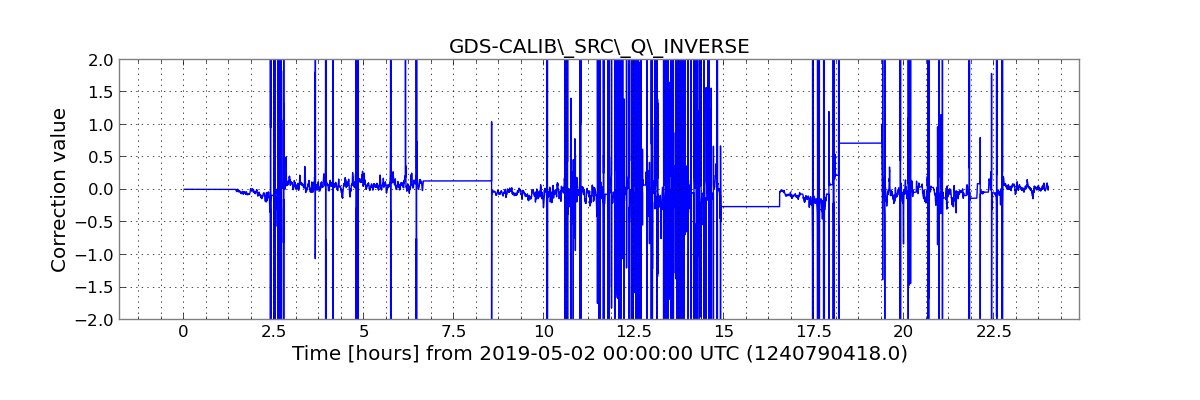
I chose 2 days to use, due to interesting features apparent on the summary pages. The first three plots are from April 30, where a well defined change occurs in the SRC's optical spring frequency, which appears to change from a pro-spring (fs2 < 0) to an anti-spring (fs2 > 0) early in the day. The next three plots are from May 2, where there are multiple lock losses and lock stretches. The spring frequency changes significantly in the first ~hour of each lock stretch.
The plots show time series of fs2 and 1/Q for roughly a day, as well and trends of DeltaL / Pcal at the Pcal line frequencies. For this data, compensating for all time dependence consistently leads to a significant improvement in calibration accuracy relative to Pcal at the Pcal line frequencies. Note that compensation for fs and Q time dependence is not the only distinction between the two data sets being compared. The C00 data at the time did not include compensation for kappa_PUM or kappa_UIM either. A check of the summary pages from those days, however, suggests that the impact of kappa_PUM and kappa_UIM may be less significant than the time dependence of the SRC.
The wildly fluctuating behavior of 1/Q is expected and not cause for concern. At times when fs is close to zero, the effect of Q on the calibration is small, and it is therefore difficult to measure and has very little impact in such cases.