[Gabriele, Marek]
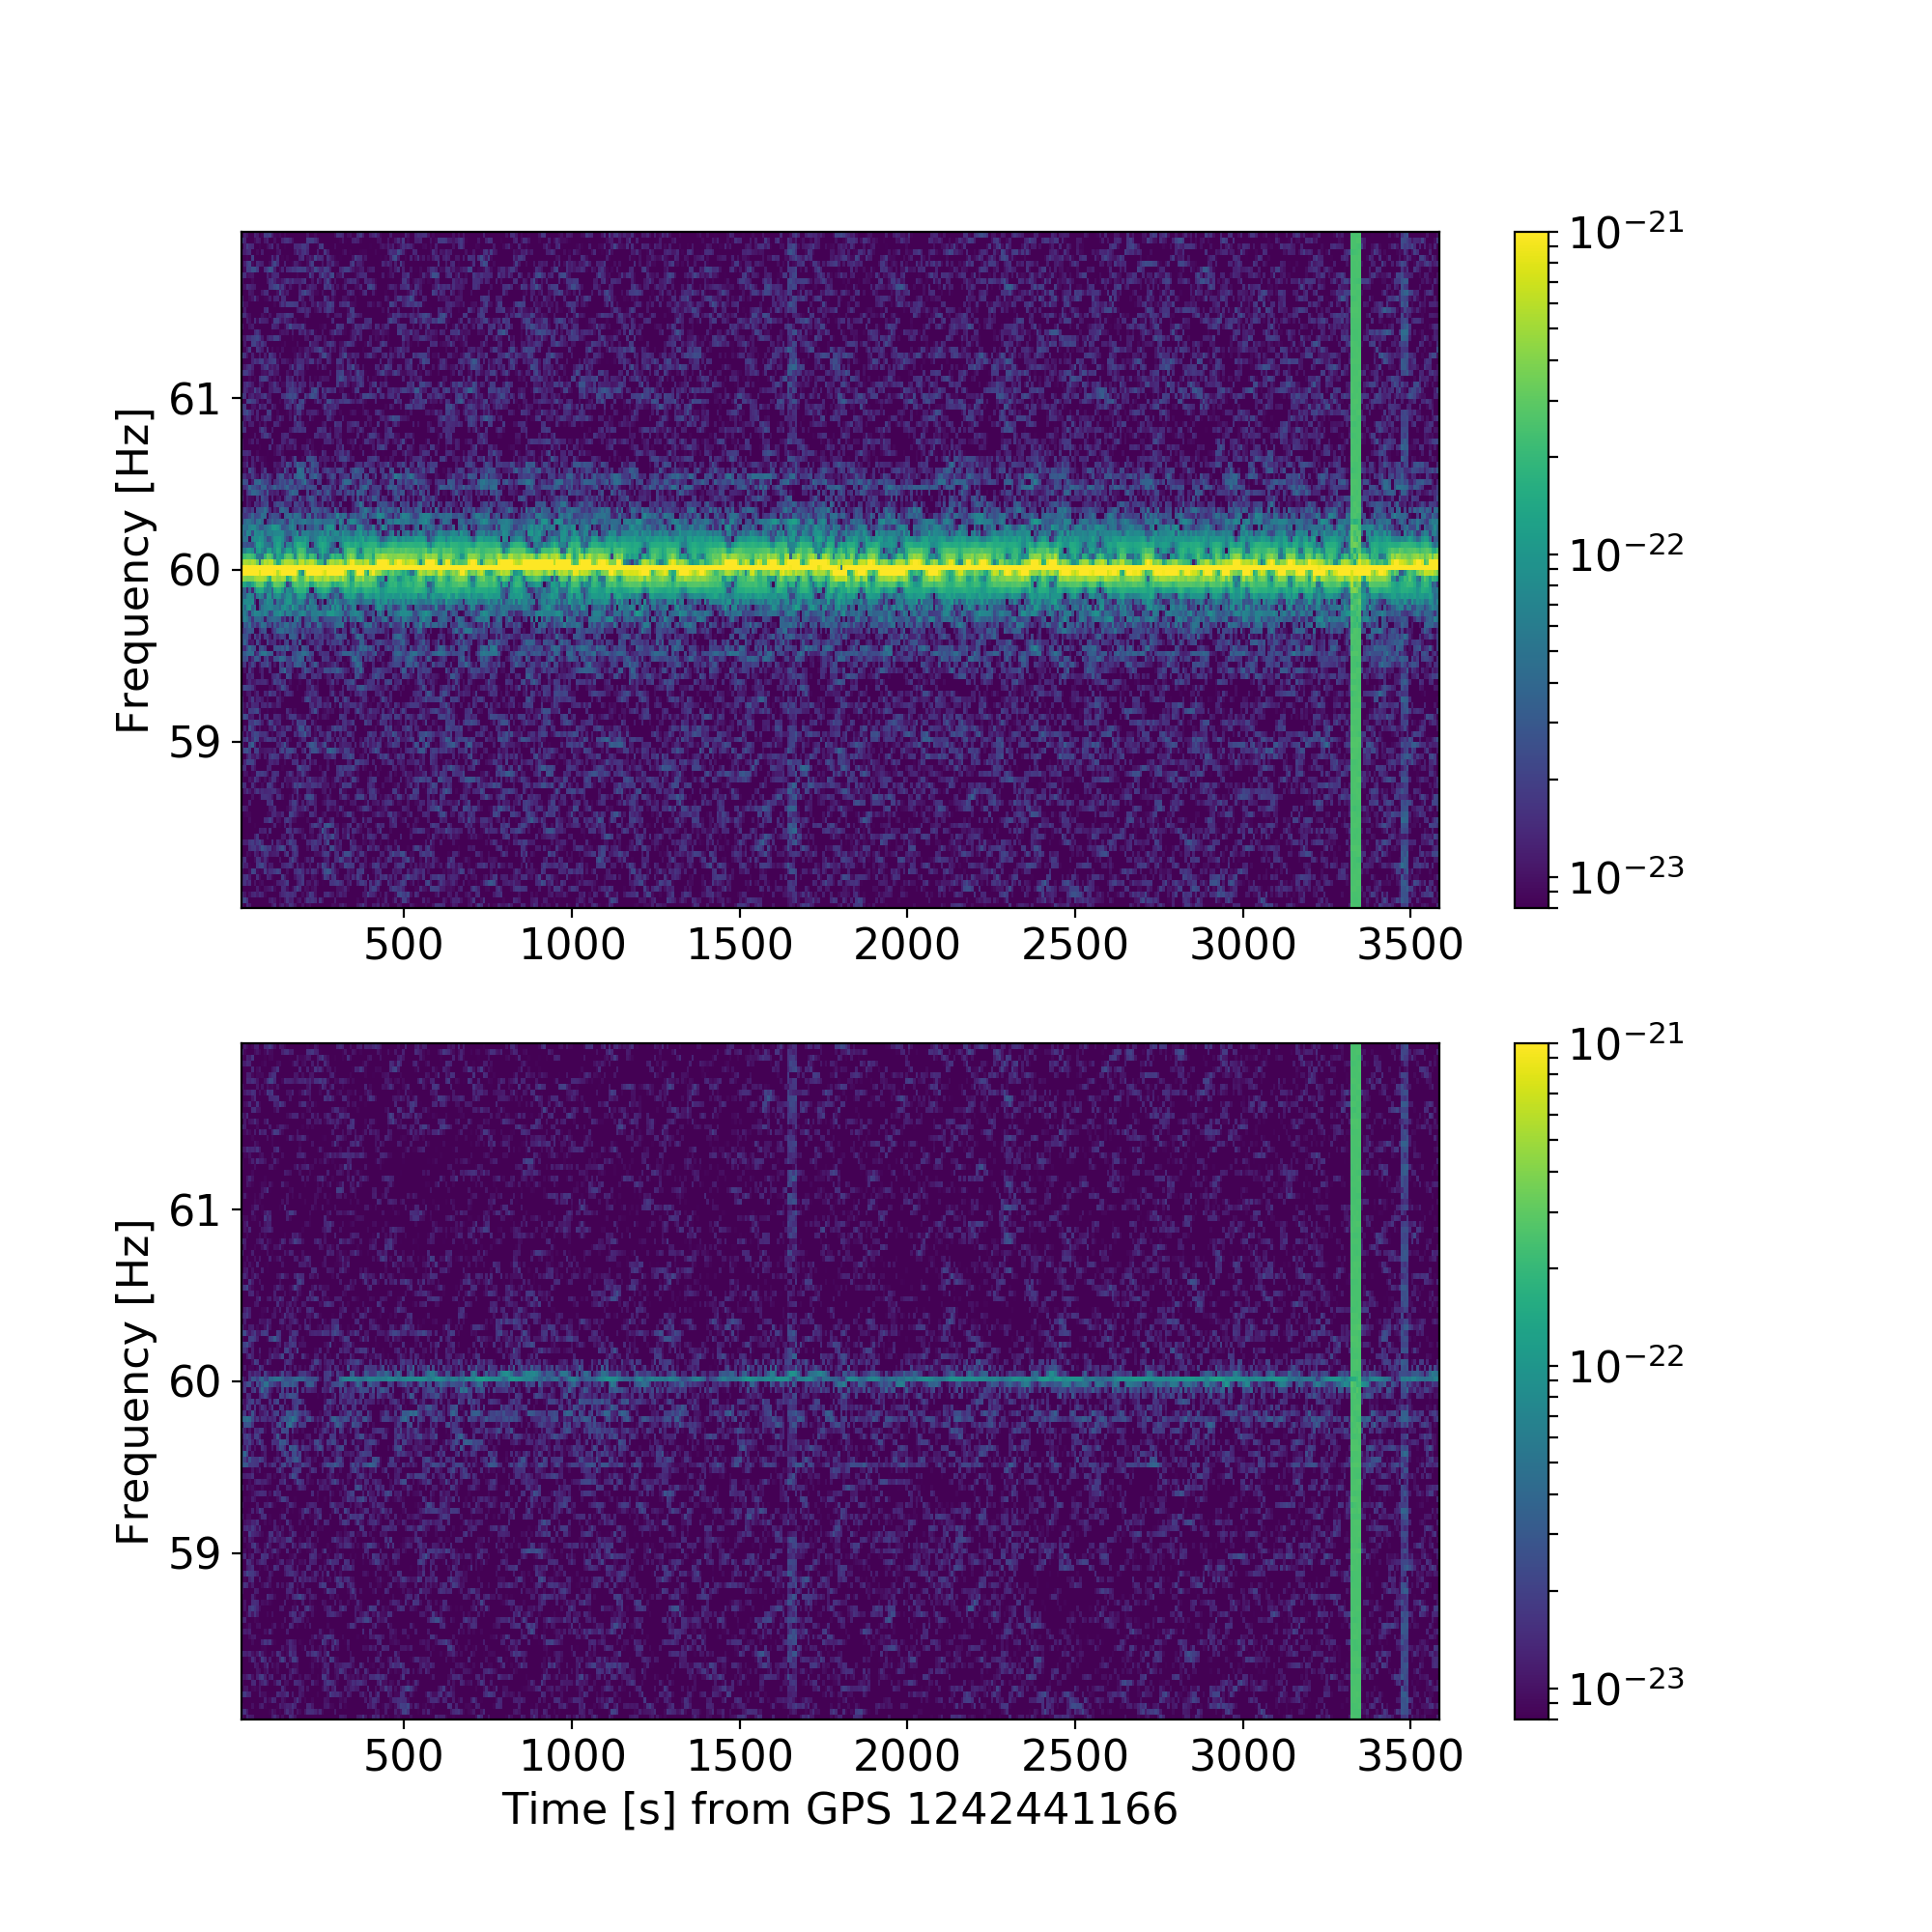
The 60 Hz line is quite large and accompanied by sidebands that spread over a 4 Hz band around the line. Those sidebands look like modulation of the 60 Hz line by IFO motion.
We used the machinery of non-stationary noise subtraction to see if we could subract the broad noise around the line. Details in the links below [1-3].
We used H1:GDS-CALIB_STRAIN for the sensitivity and H1:PEM-CS_MAINSMON_EBAY_1_DQ to measure the 60 Hz line. Then we used all ASC input error signals to describe the modulation.
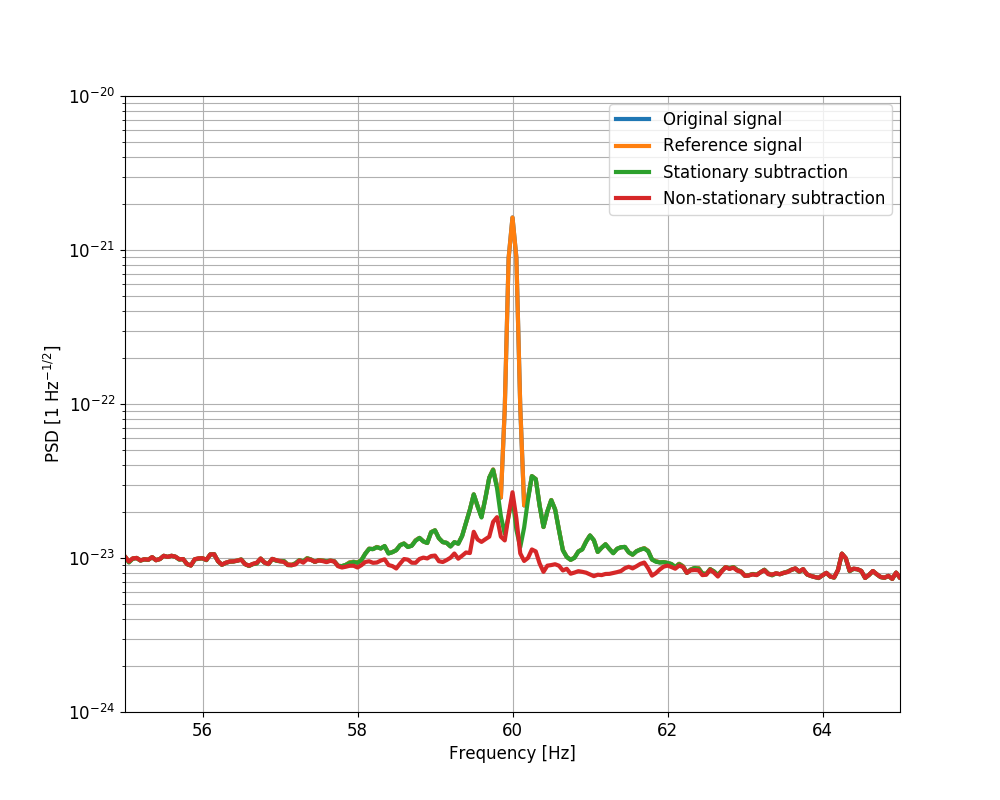
The algorithm builds a parametric description of the modulations. The result is shown in the first plot attached below (blue and orange are equal and are the h(t) signal before subtraction, green is the best subtraction with only the linear coupling of the PEM mains monitor, red is the best subtraction when including non-stationary modulation due to ASC signals).
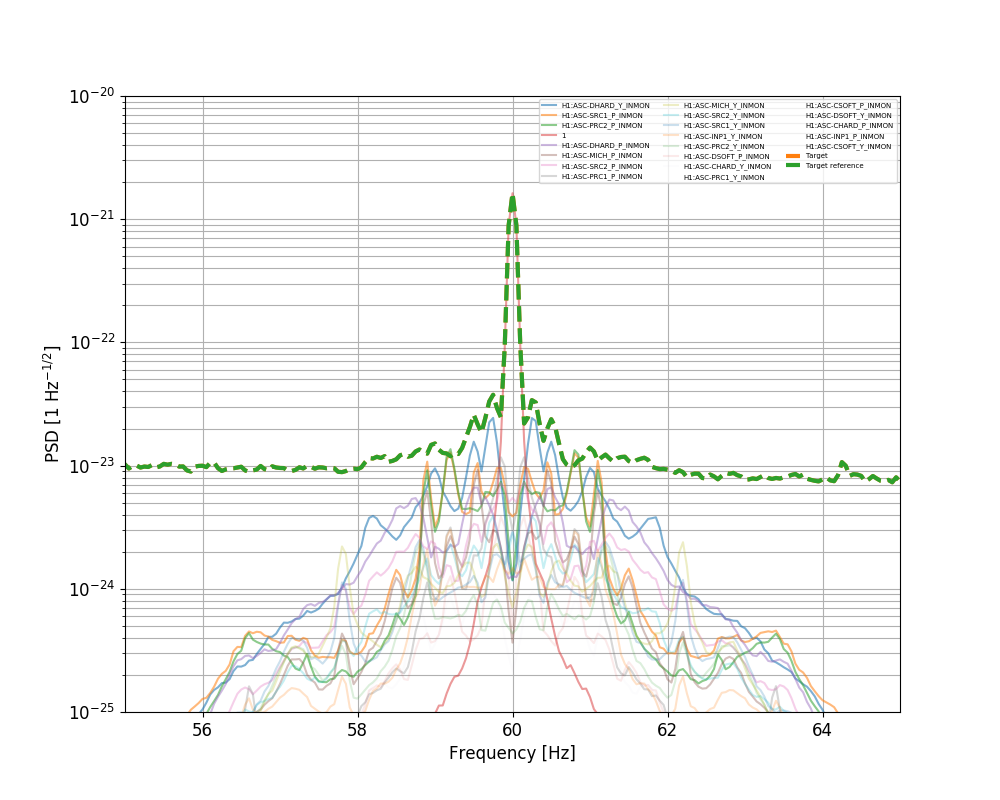
The second attached plot shows each contribution: apart for the reference signal, each trace corresponds to the PEM mains monitor modulated with one of the ASC signals with optimal time-domain filter.
[1] NonSENS code https://git.ligo.org/gabriele-vajente/nonsens
[2] Subtraction of non-stationary noise couplings https://dcc.ligo.org/LIGO-T1800525
[3] Non-stationary / non-linear noise subtraction https://dcc.ligo.org/LIGO-G1900397
The effectiveness of the subtraction of this non-stationary bump is even more evident from a spectrogram.
This is based on a time domain subtraction. A time series of the subtracted strain is available upon request.