Summary: No drop in magnetic coupling level over the 2 – 10 Hz measurement range was noted after removing eddy current damping magnets on M0 and L1. This was not unexpected because we had previously noted that there was also excess coupling at L2. The slit L2 parts are here and I suggest that we install these on ITMY and measure coupling again when possible.
We recently (here) found that large magnetic injections produced motions of ITMY that, when scaled linearly, suggested that ambient magnetic fields would produce motions that were orders of magnitude larger than our sensitivity goal at 10 Hz. Further tests (here) suggested that the coupling level was the same when SUS and ISI cables were disconnected and HEPI shut down, that the coupling was similar at ETMY, and that the coupling occurred at multiple suspension levels. We also found that coupling was within a couple of percent of linear for magnetic fields that were varied by a factor of 3 at both the ITM and the ETM. Comparisons of BOSEM and OSEM injections to magnetic injections showed that coupling was excessive at L1 and L2 as well as M0, so the suggestion was made that in addition to removing the M0 ECDs, we also remove the blade spring ECDs and that we slit parts around the AOSEMS at L2, the penultimate level, in order to prevent eddy current circuits (here). For the test reported here, we removed the ECDs, but did not replace the L2 parts, so we expected coupling at L2 to be unchanged.
Figure 1 shows that coupling, as measured by the optical lever reflecting off of the ITMY test mass, has not significantly changed. For an ambient magnetic field background of 10 pT, the graph predicts about 1e-16 radians/sqrt(Hz) of motion. The point at 63 Hz measured in Aug. has been left off of the graph because there was no clear indication of the 63 Hz peak in the one 12 hour injection I had time for this month. For the previous measurement at 63 Hz, cables were installed and damping was on. Thus one possibility is that the point at 63 Hz may have indicated coupling to the cables, but not directly to magnets on the quad. For all measurements here, except for one of the 3.5 Hz measurements, the SUS cables were disconnected and ISI and HEPI were off.
As a next step, I suggest that we install the slit L2 parts (Betsy says they can be installed in situ), and re-test magnetic coupling when possible.
Optical lever calibrations
We used two independent methods to re-calibrate the optical lever. First, the original DC method, calibrating beam spot motion by moving the quad diode on its translation stage and converting displacement to angle using the geometry. We also used an AC method to cross check the calibration; we injected 5000 counts at 1 Hz into M0 pitch or yaw, measured the beam spot displacement at the photodiode using a scale, and then calibrated the photodiode output using a 500 count injection (to be in the linear region of the photodiode) and assuming the amplitude of beam spot motion was 1/10 of the motion measured for the large injection (we confirmed actuation linearity with a 2500 count injection). The independent calibrations differed by 4% in yaw and 15% in pitch. We used the average of the two calibrations for the gain; Pit: 23.38, Yaw: 24.74. The August gain values are still on the MEDM screen because I did not want to change gains in the middle of collecting data, so the calibration was corrected off-line.
Peak disappeared when beam was blocked
We had previously tested for coupling of our injected field directly to optical lever electronics by blasting the electronics with large magnetic fields (here). This time I checked by blocking the optical lever beam while injecting a 5.5 Hz magnetic field. A flashlight was used to bring the signal level from the diode segments up to their nominal signal levels either in total RMS or at 5 Hz. The 5.5 Hz peak in the optical lever signal disappeared in both cases.
Set up
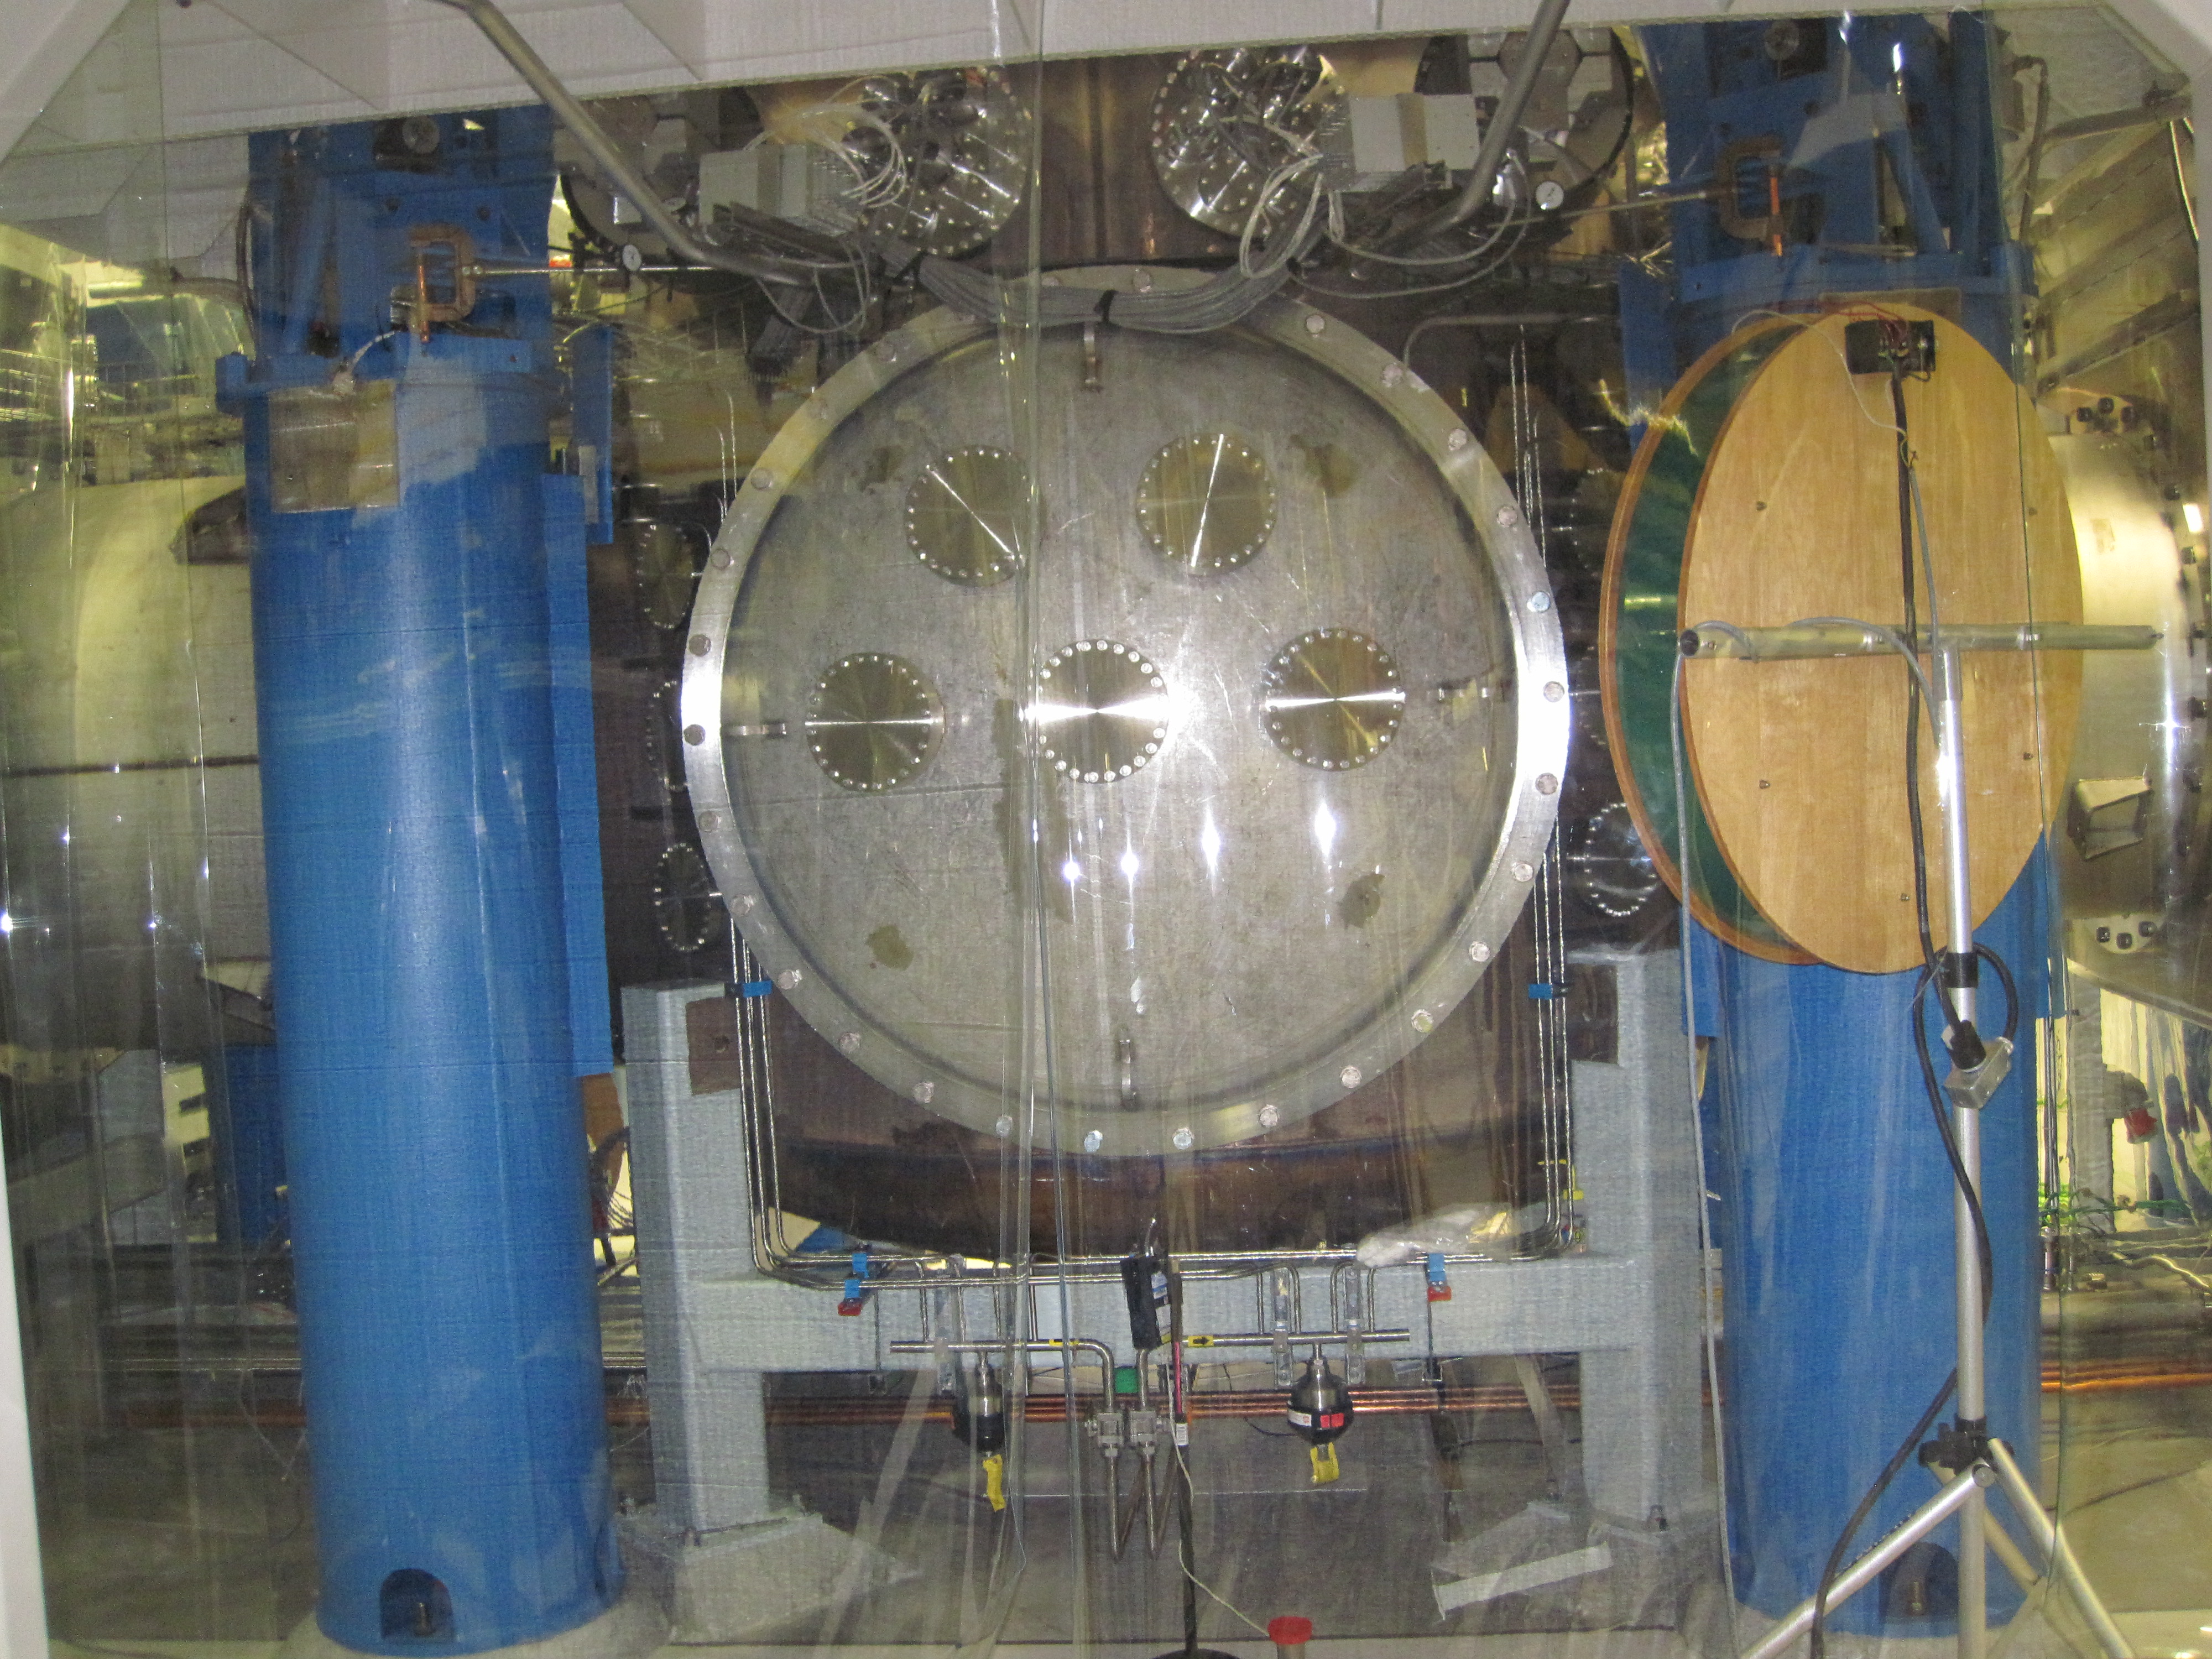
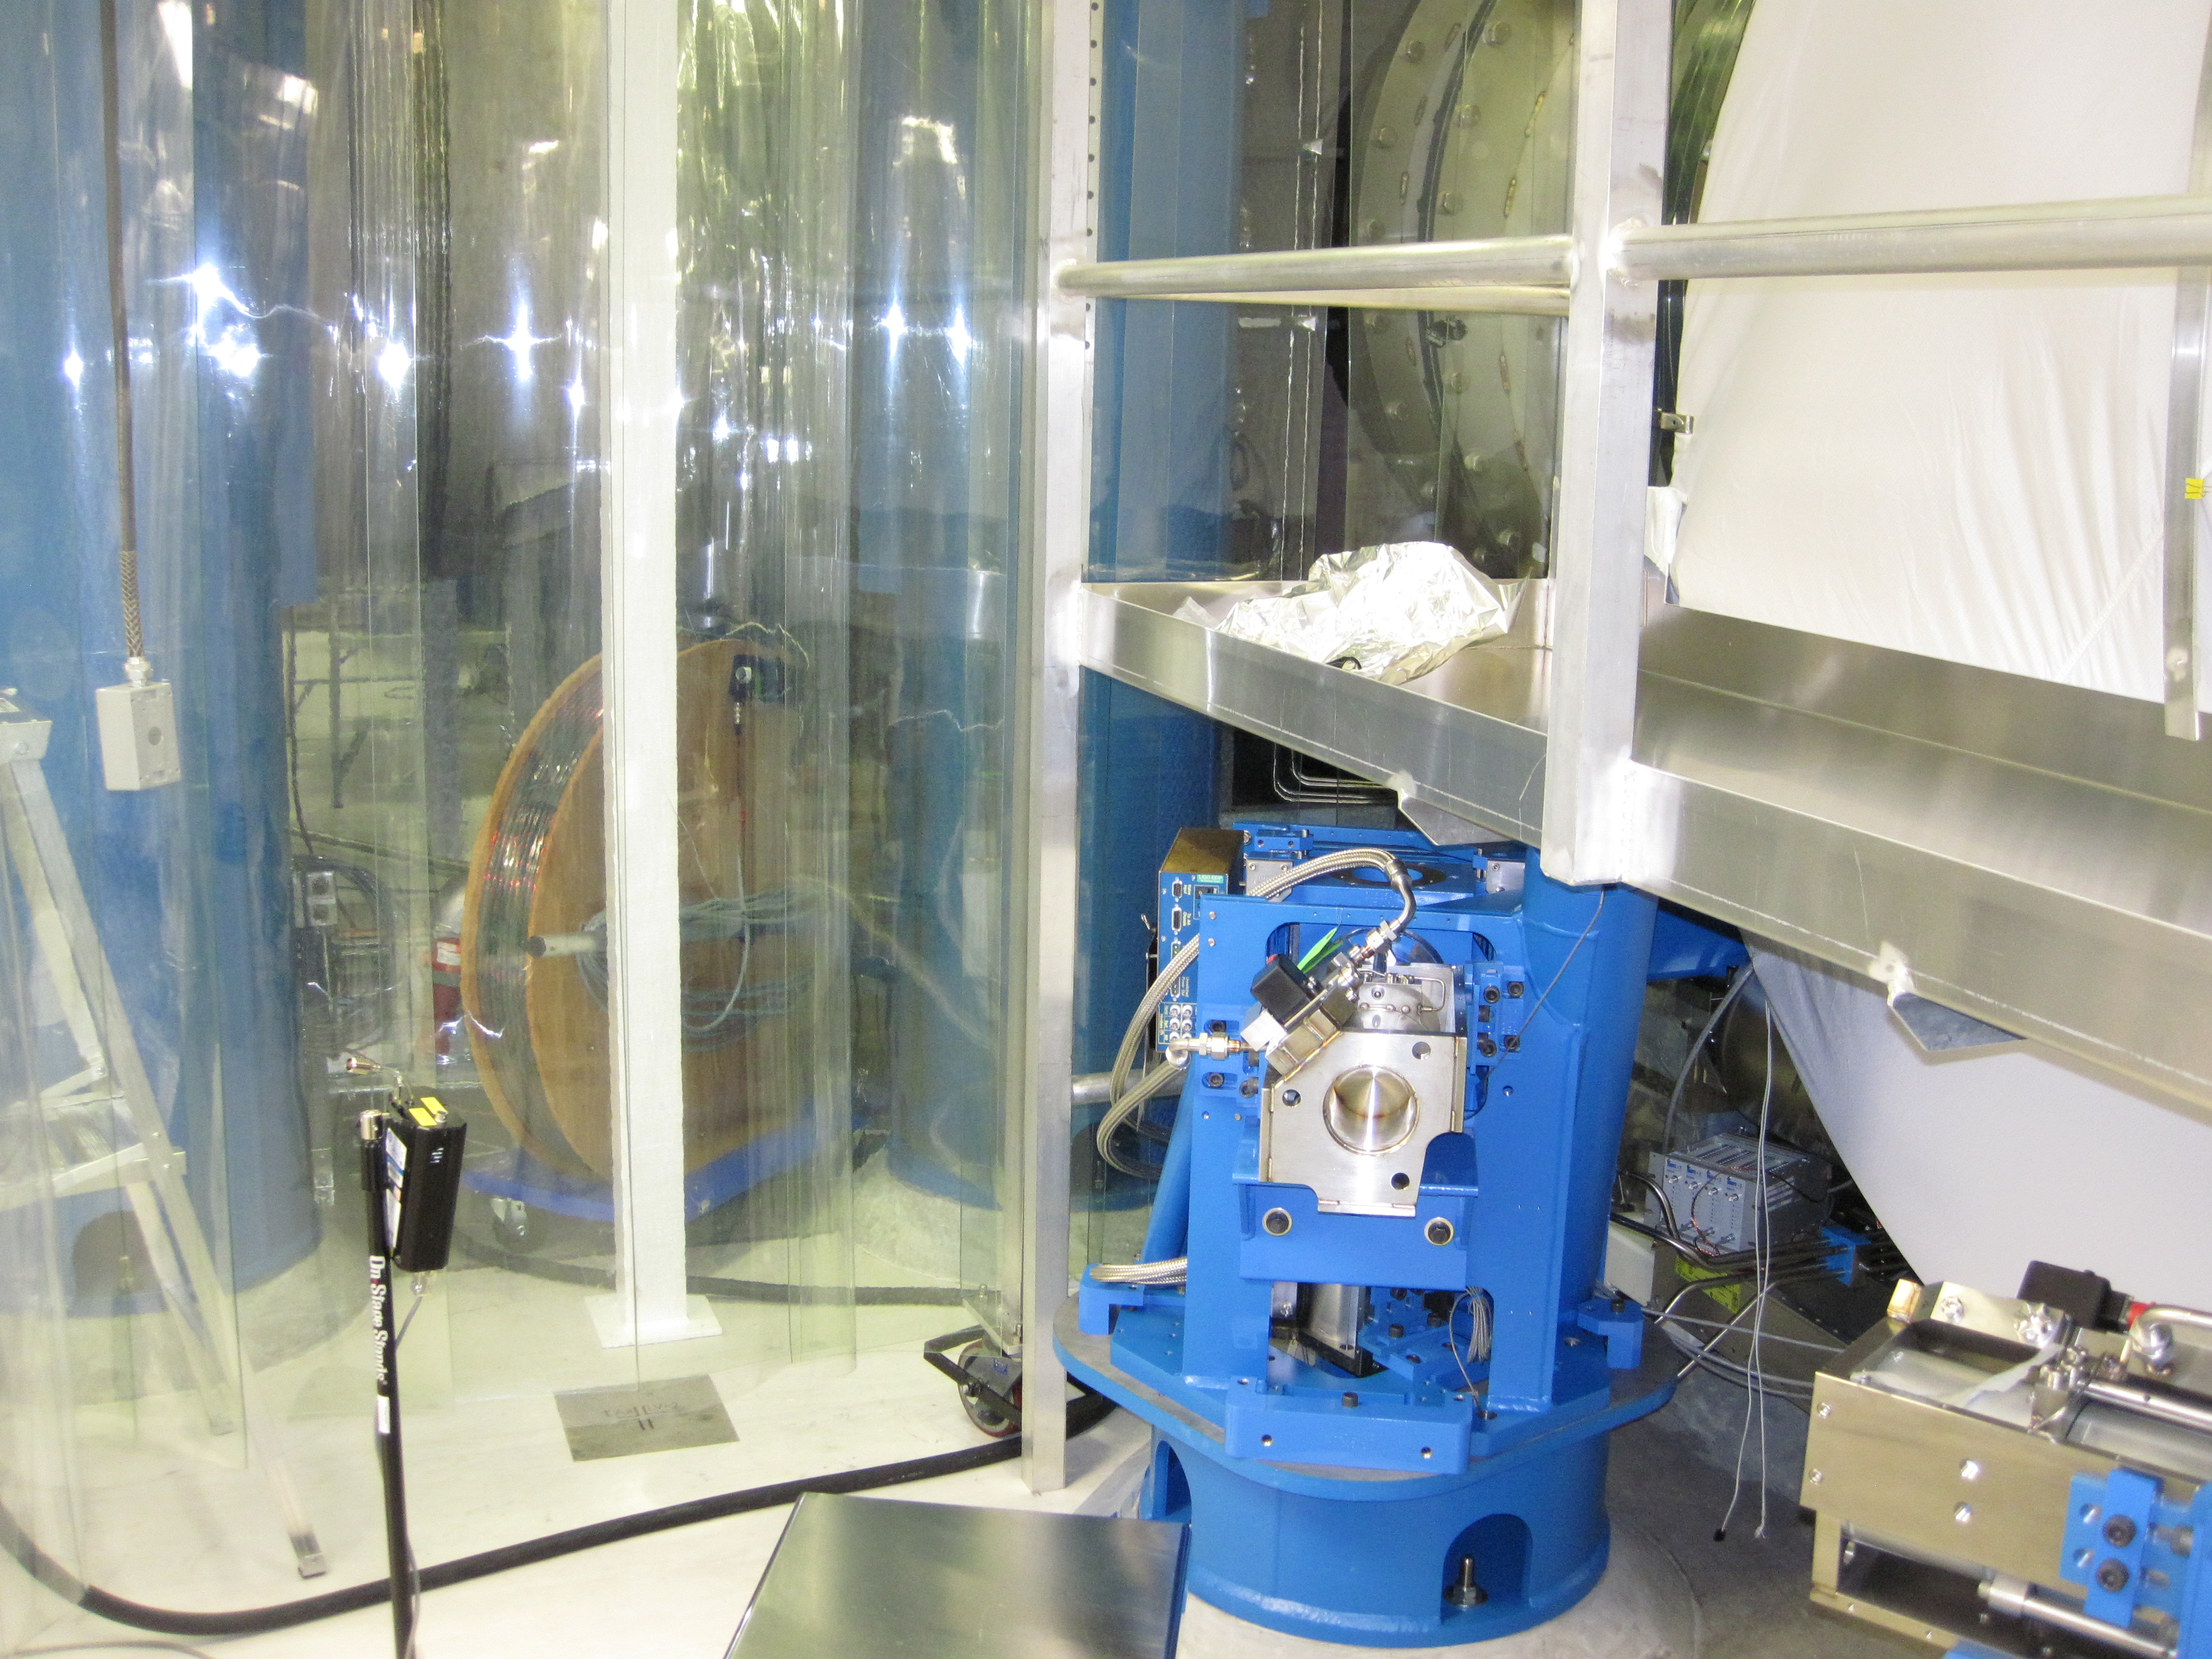
The setup was similar to what was used before. The attached photos show the coils. We ran 12 amps through these coils for most injections, producing magnetic fields at the test mass of several tens of micro Tesla. We have measured injected fields inside a BSC for a similar coil configuration and found the ratio of gradients to fields for the injection to be about the same as for ambient 60 Hz fields (here). The magnetometer, used in determining radians per Tesla of injection, was placed 10 cm under the center of BSC1. 10X attenuators were used and the amplifying filter box was bypassed in order to get the large magnetometer signal on scale. The magnetometer was calibrated in situ using a small calibration coil.
Robert S., Thomas V.