kara.merfeld@LIGO.ORG - posted 21:46, Sunday 02 June 2019 (49603)
ALS glitches and rain uncoorelated
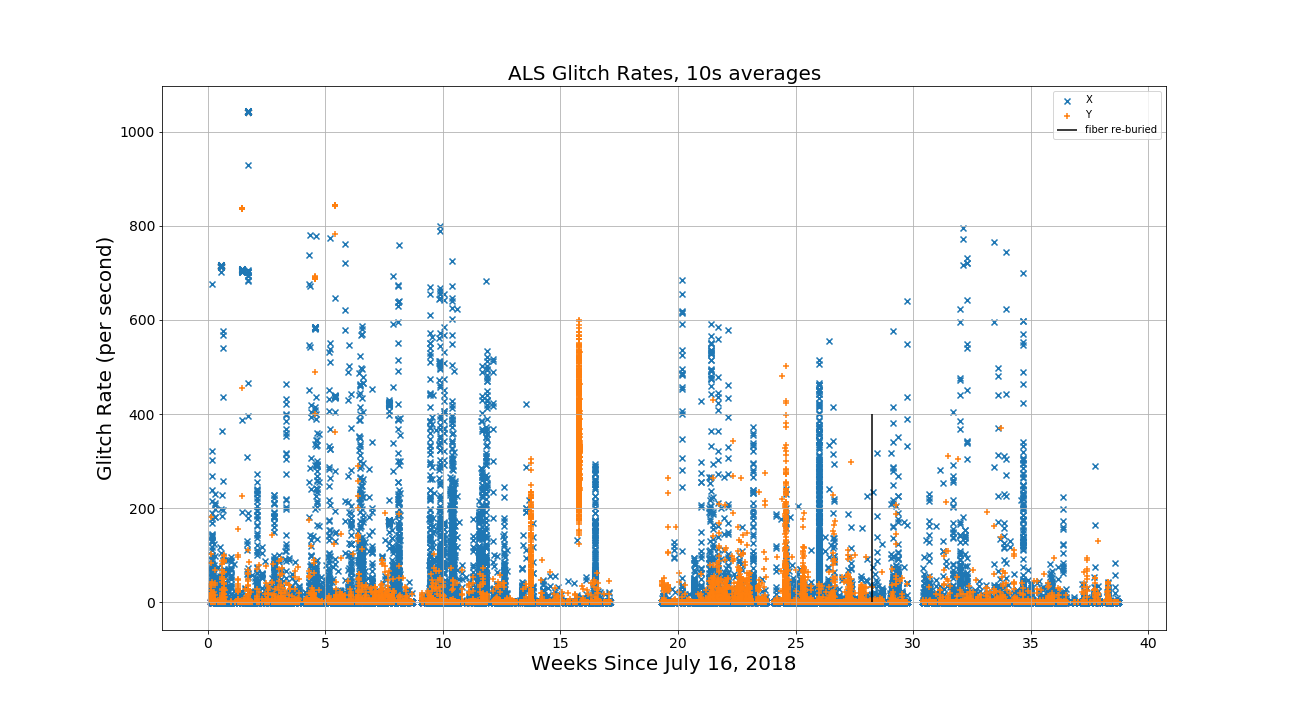
In an attempt to identify the source of the ALS glitches, I calculated the glitch rates over several months of time, and plotted them in Figure 1.  The glitches were identified by first high-passing the raw data from channels H1:ALS-C_TRX_A_LF_OUT_DQ and H1:ALS-C_TRY_A_LF_OUT_DQ, and then counting the number of times the high-passed signals exceed .1.  The glitch rates are per second, and each data point is an average glitch rate over a 10s time interval.  Only times when we were locking the interferometer were taken into account.

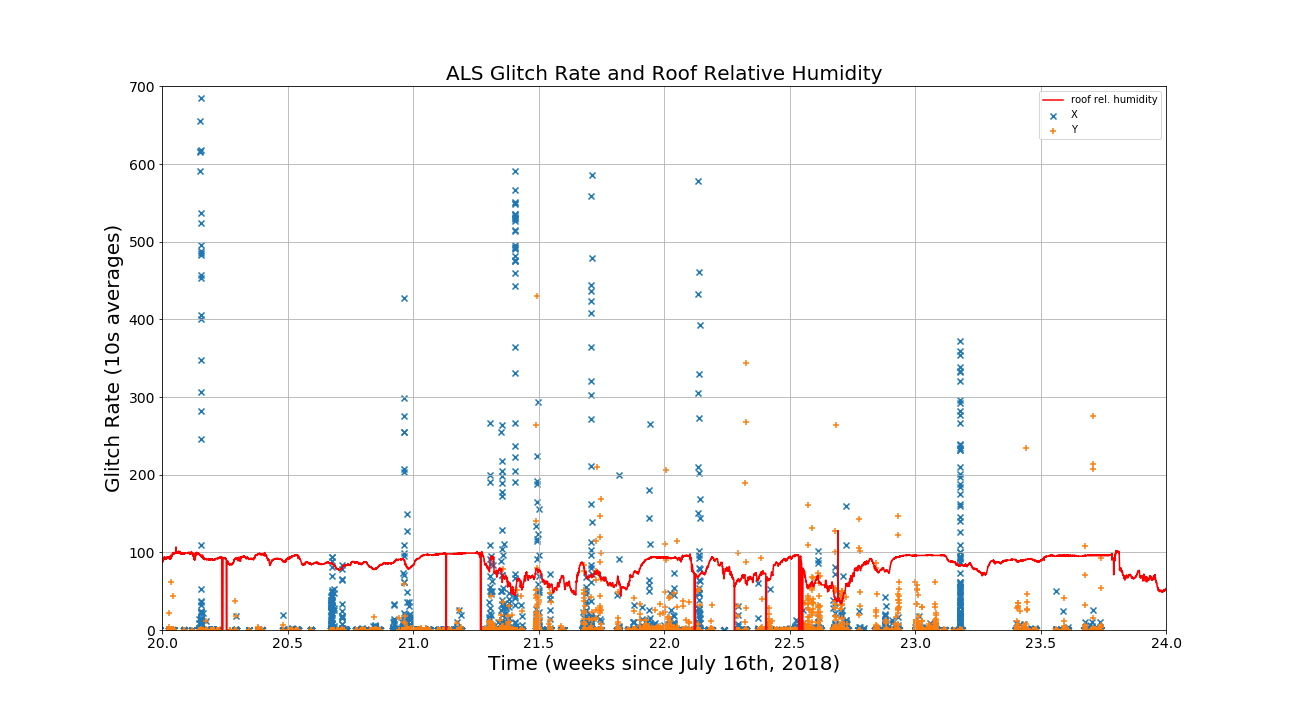
It has been hypothesized that the glitches could be connected to rainy days.  So I chose a month of time when there were both rainy and dry spells, and overlayed my glitch rate plot with the data from the relative humidity sensor on the roof.  This is displayed in Figure 2.  There does not appear to be any strong correlation between the glitch rates and the outside humidity.
Images attached to this report