Laurence Datrier, Sheila Dwyer
A repeat of the analysis in 49542 along with a look at the impact of wind on BNS range.
We used the maximum wind speed of the three max. 1min and 30min trends for the H1 EX, EY, CS wind channels for O3 up to 2 June 2019.
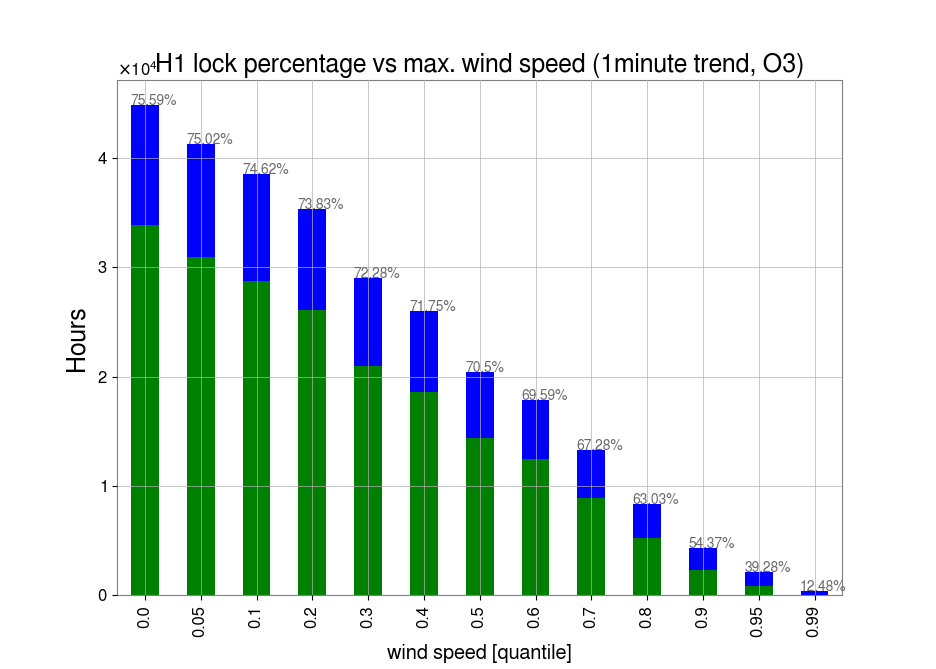
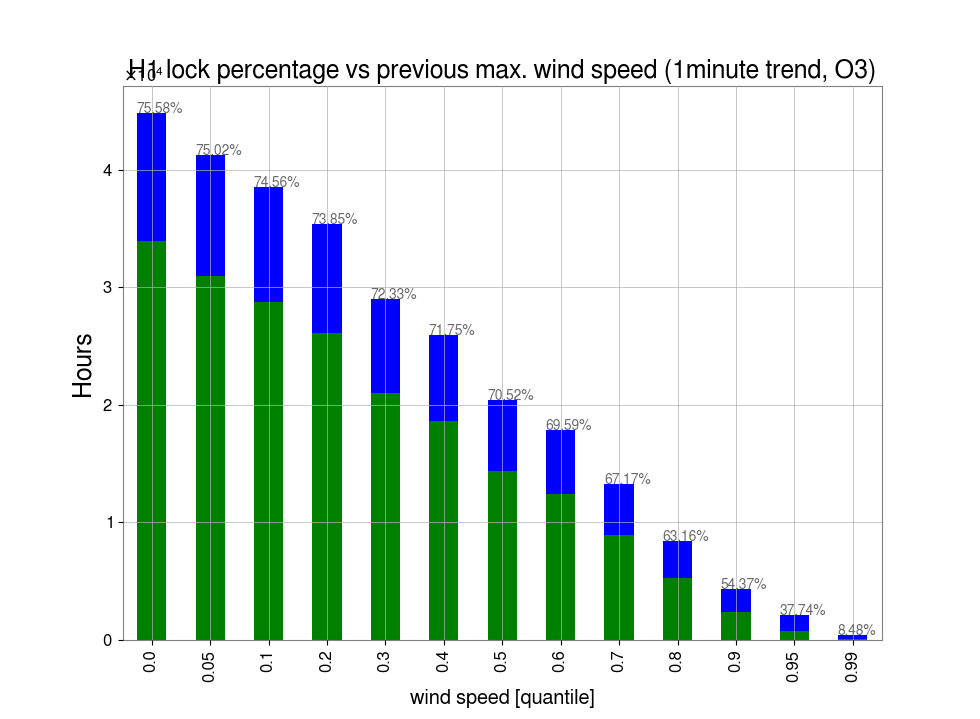
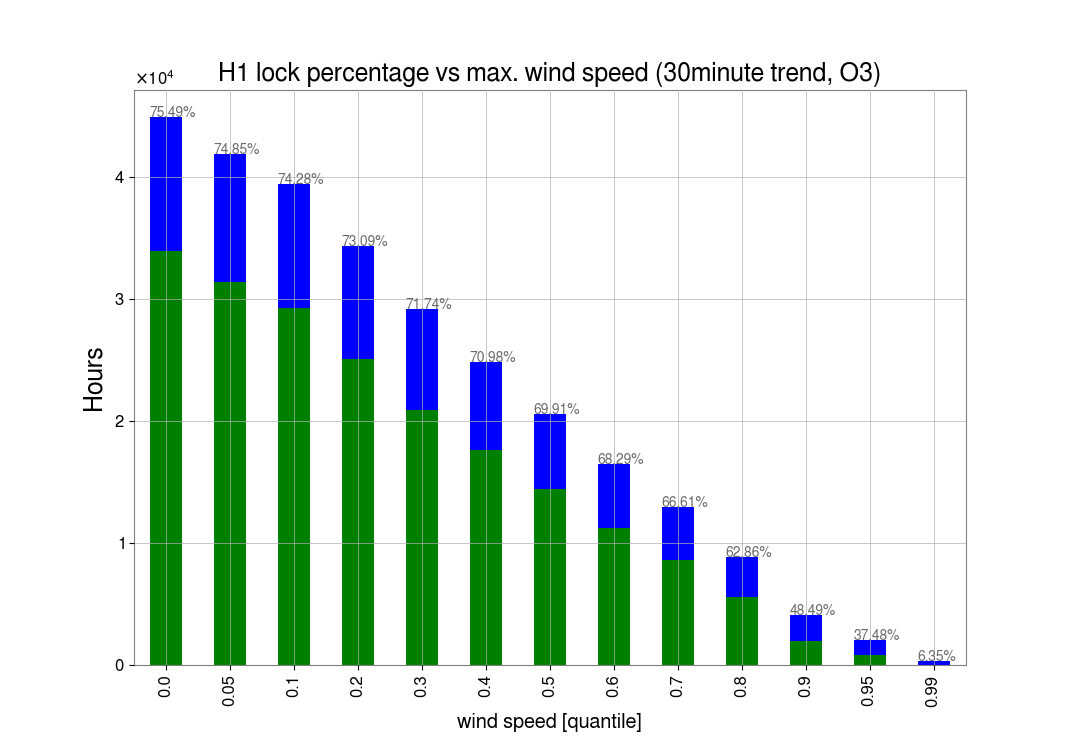
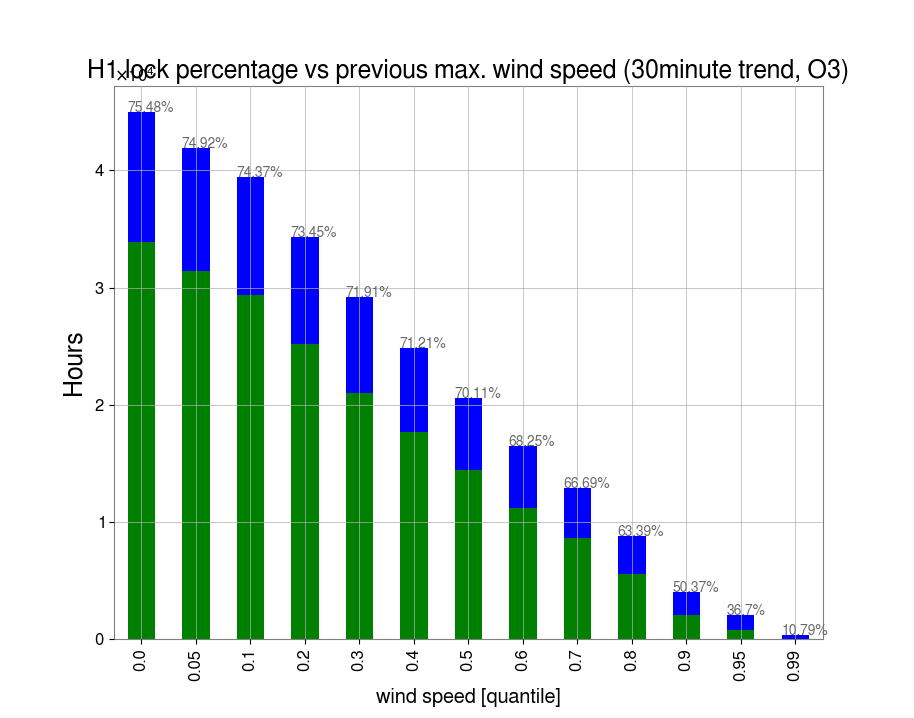
The first histograms and trend line show duty cycle vs wind speed percentiles, for wind speed vs lock status and previous wind speed (max. of previous 1 or 30 min) vs lock status. Looking at the previous wind speed shows more down time due to high winds. Percentiles and wind speed values are (in mph):
| percentile | 5 | 10 | 20 | 30 | 40 | 50 | 60 | 70 | 80 | 90 | 95 | 99 |
| 1min trend wind speed [mph] | 4 | 5 | 9 | 8 | 9 | 11 | 12 | 14 | 17 | 21 | 25 | 35 |
| 30min trend wind speed [mph] | 6 | 7 | 9 | 11 | 13 | 15 | 17 | 19 | 22 | 27 | 31 | 43 |
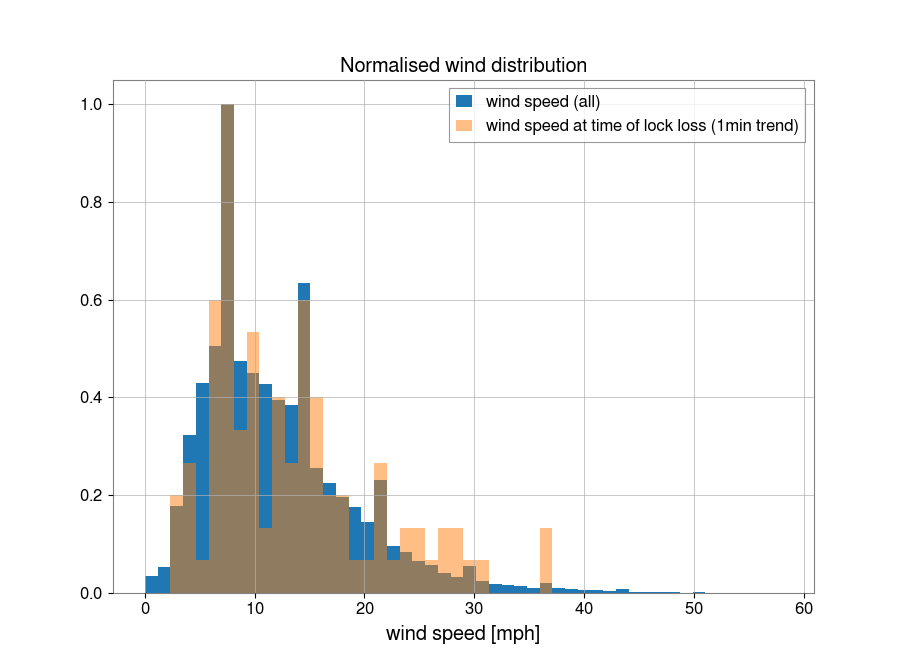
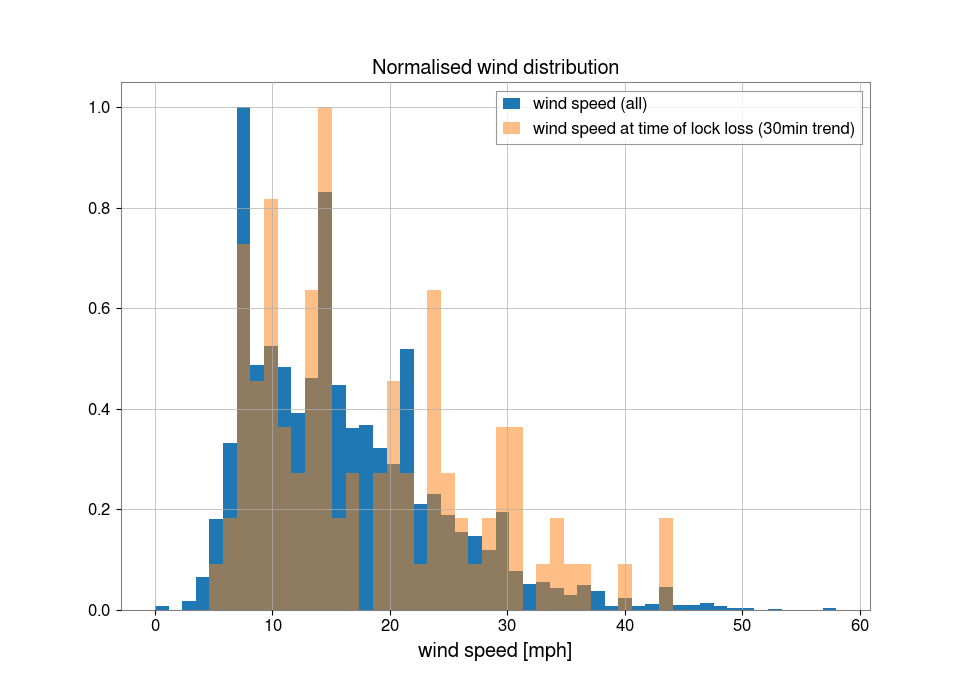
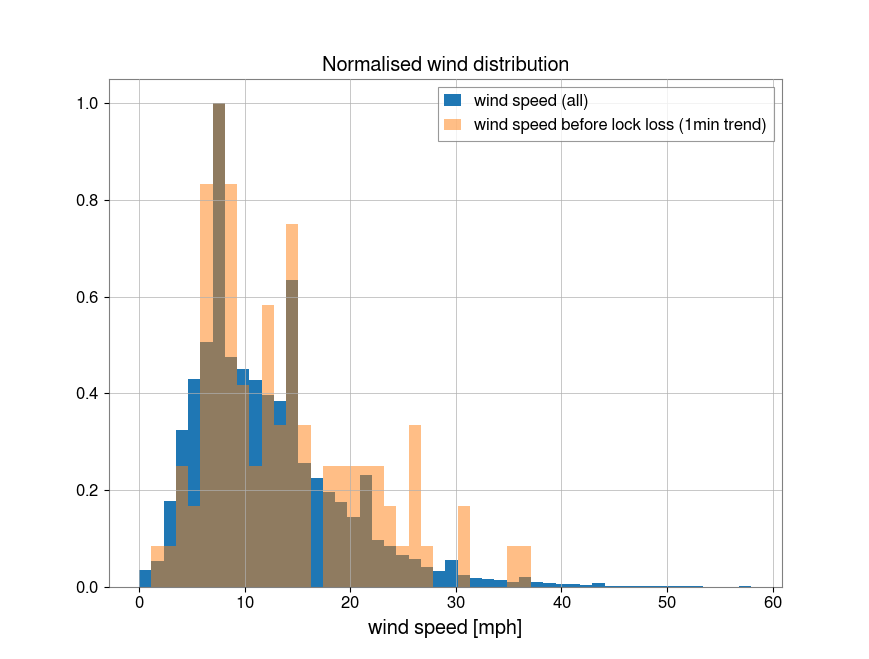
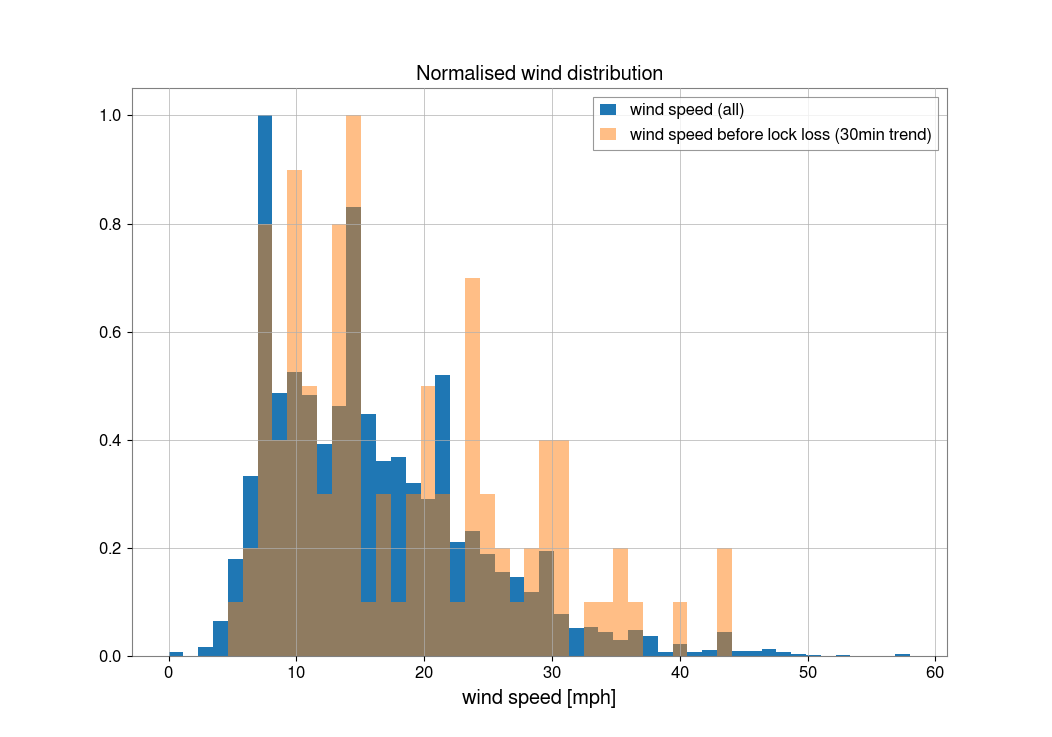
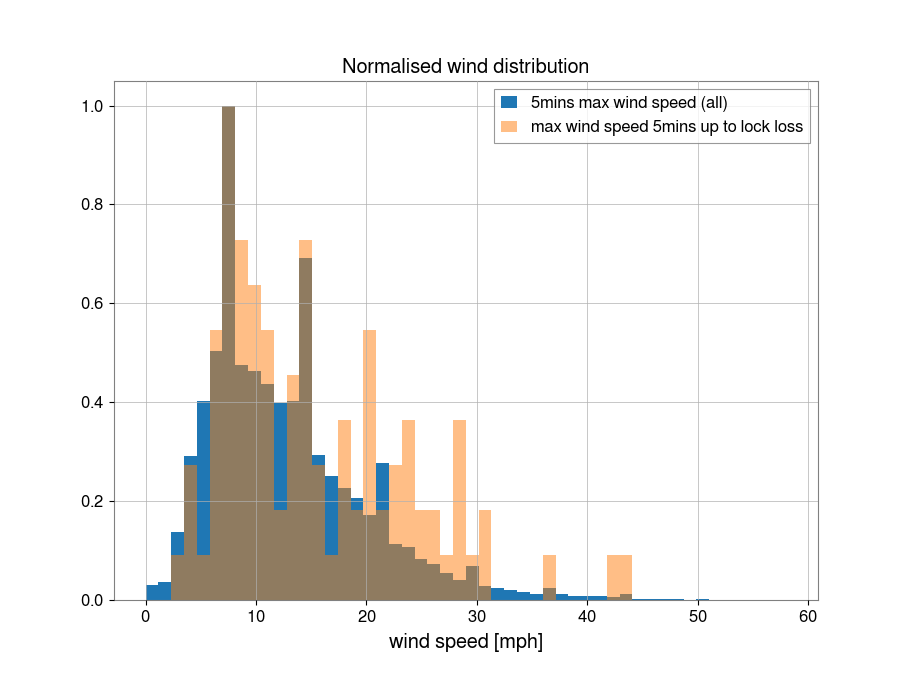
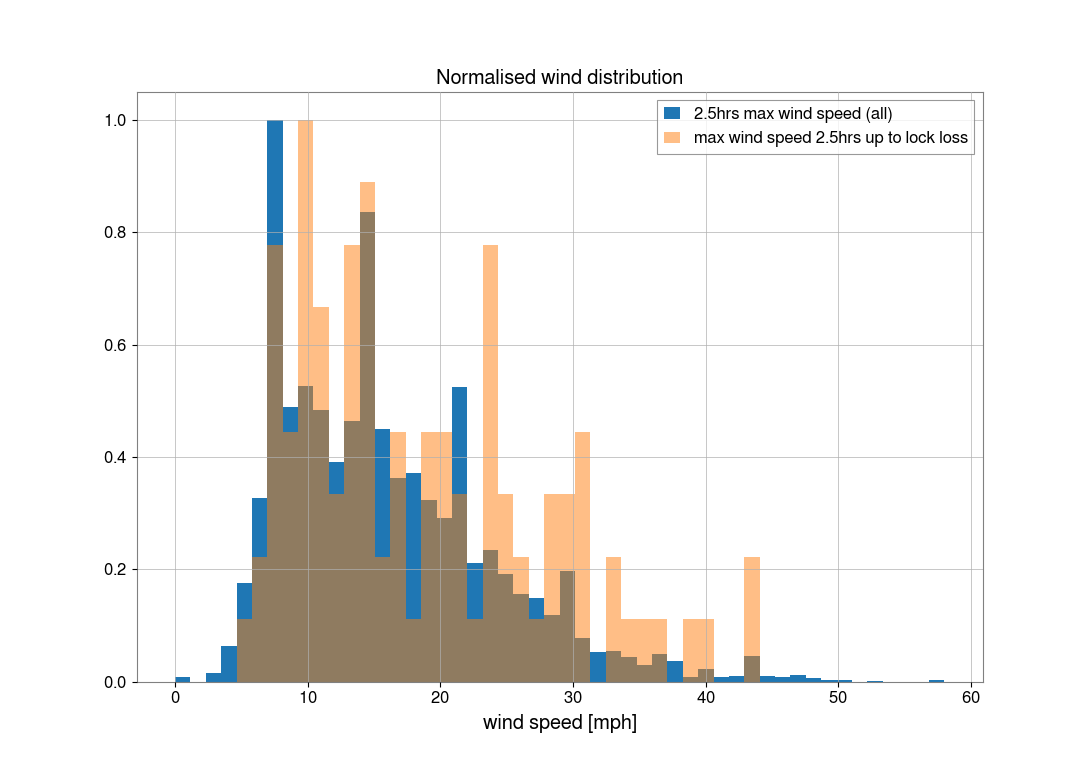
The following histograms are the normalised distributions for wind speed at:
- Instant of lock loss (1min and 30min trend)
- Instant before lock loss (1min and 30min trend)
- Time leading up to lock loss (1min trend: 5mins up to lock loss, 30min trend:2.5hrs up to lock loss)
Compared to the normalised distribution at all times (blue).
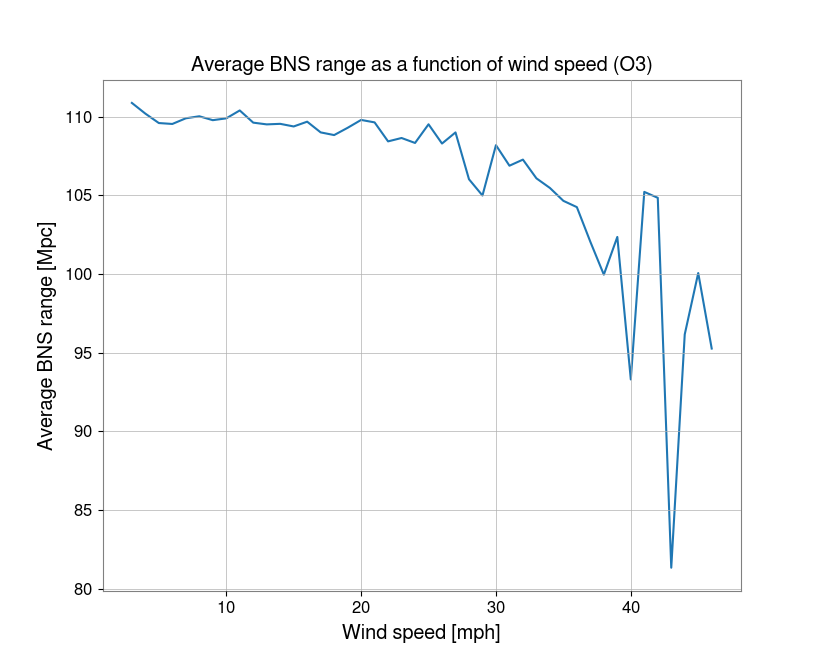
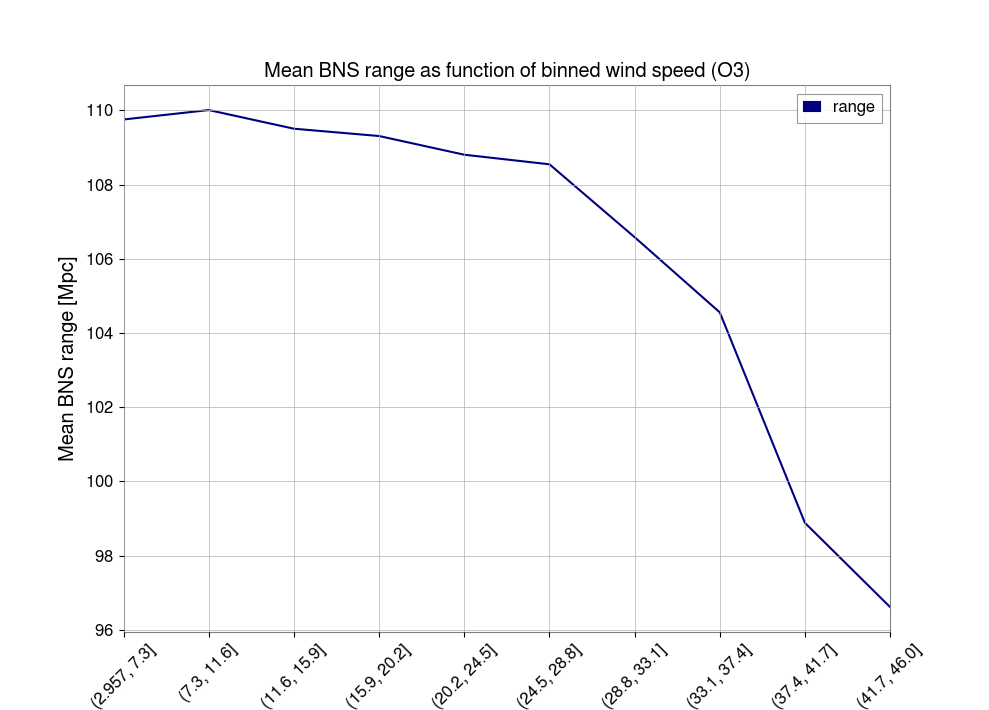
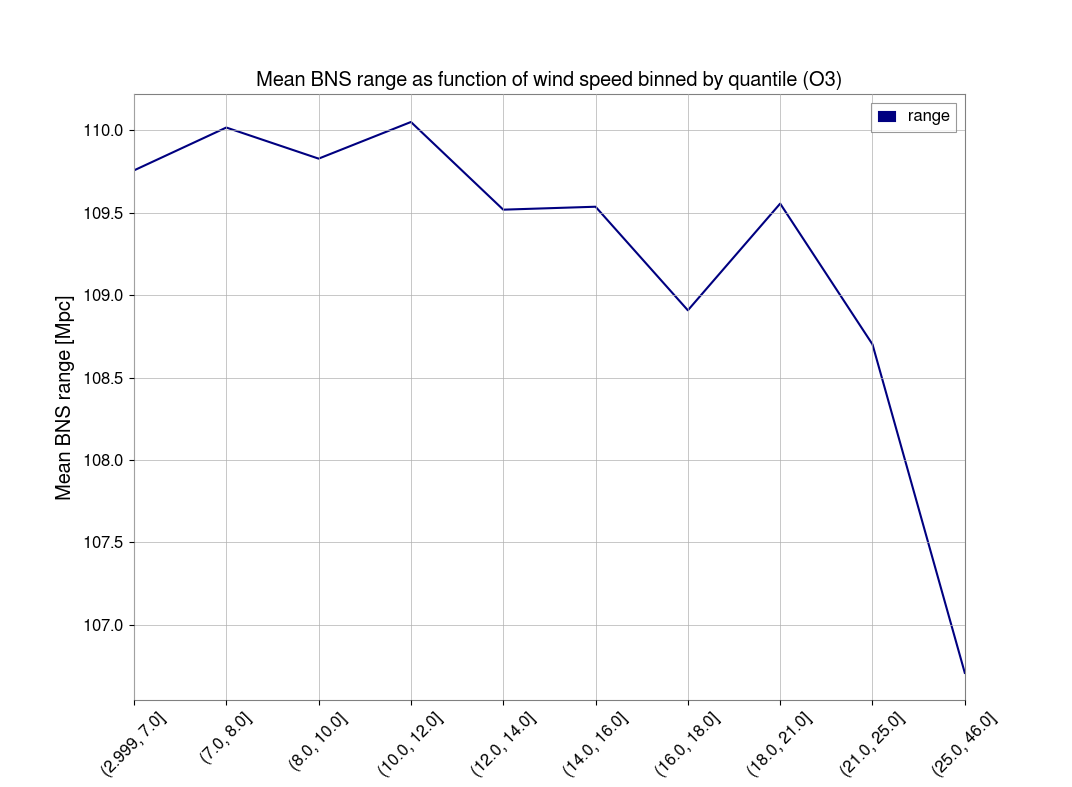
The following plots look at the BNS range as a function of wind speed while the interferometer is locked. Again, the maximum wind speed of the three max. 1min trends for EX, EY and CS wind channels are used.
- Average BNS range as a function of wind speed
- Average BNS range per percentile of wind speed
- Average BNS range per binned wind speed [equally spaced]
- Average BNS range per binned wind speed [quantiles]
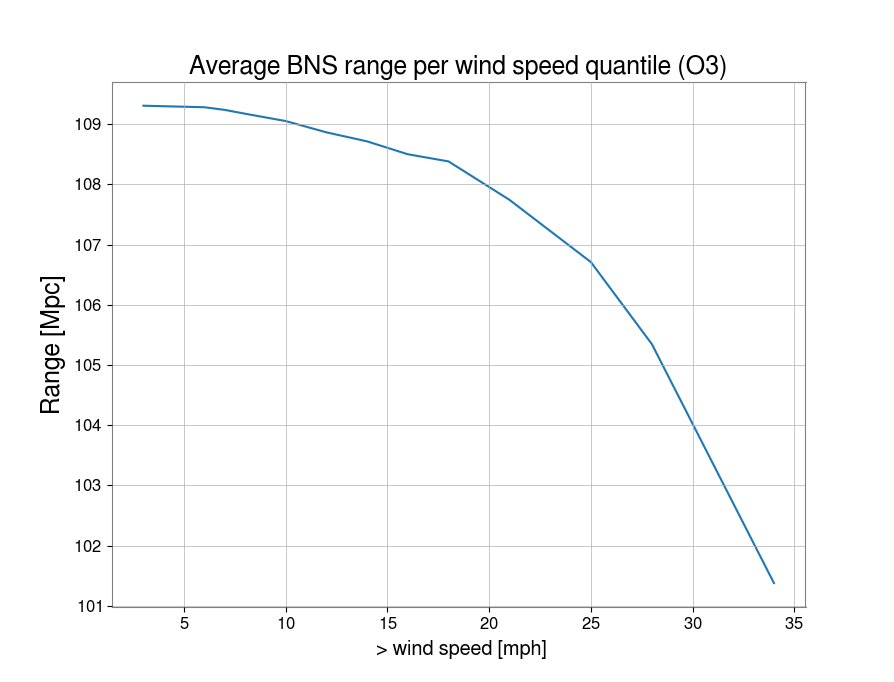
Thanks for looking into the effect of wind on lock loss and BNS range in the first two months of O3. I've used the BNS Range vs Wind Speed reported above, convolved with the yearly wind speed PDF (based on ~8 yr of data) to calculate the effect on yearly average BNS range and BNS detection rate (volume) in the attached notebook. I calculate ~1.2 MPc BNS range increase (or ~1.5 MPc for the windy season). This amounts to a ~3% increase (~4% in the windy season) in the detection rate (volume x time) for BNS.
The DetChar group has been asked to look into the effect of wind on BBH range and any glitches which might negatively effect searches such as Bursts.

