J. Kissel, J. Driggers, E. Merilh
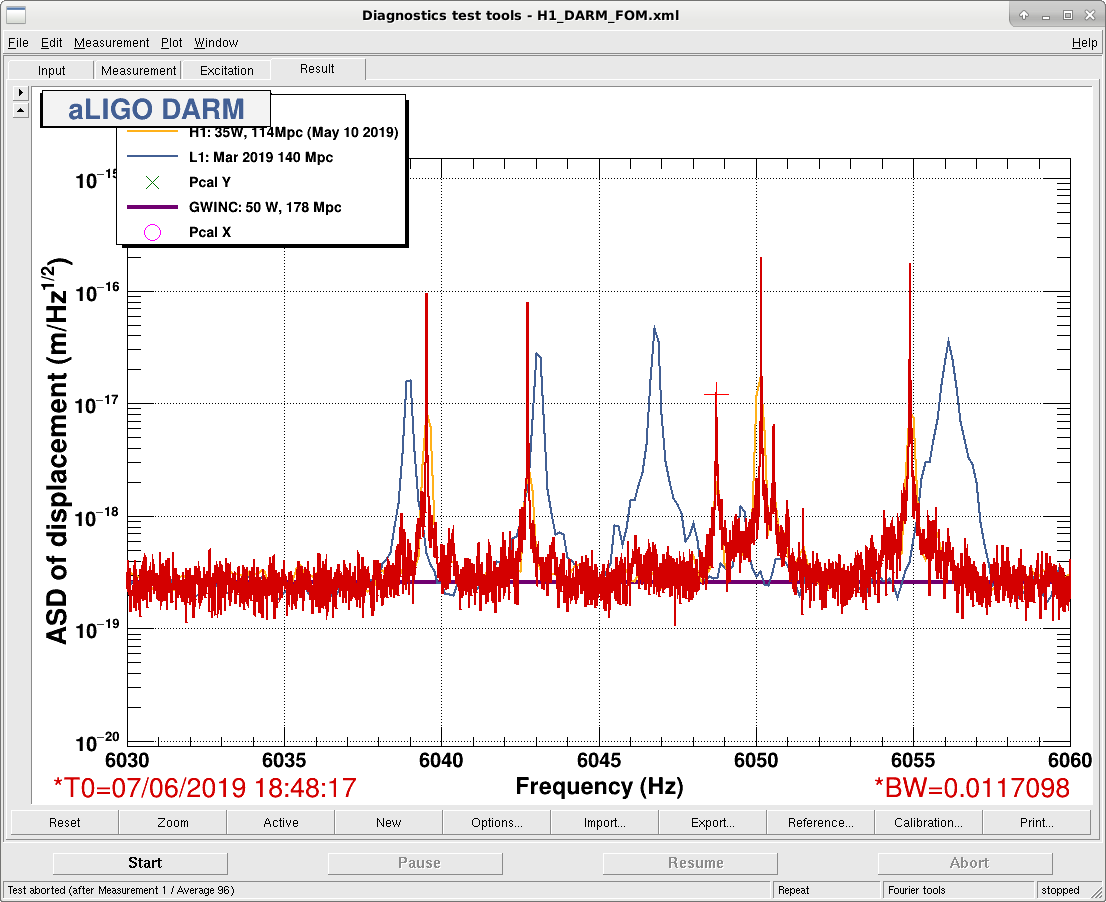
While watching the wall spectrum during a tour, we began to notice a 6 kHz line appear to be increasing in amplitude in the last part of the lock stretch with ended 2019-Jun-07 20:51 UTC. Upon a bit more of a zoom, it's actually 5 prominent lines at
6039.5 Hz
6042.7 Hz
6048.7 Hz
6050.1 Hz
6054.8 Hz.
Unclear if these growing lines were the cause of the lock loss (or the agressive amounts of wind that has suddenly kicked up), but it's worth a note in case we see this happen again.
This is the standard wall trace, so red is live H1 DELTAL_EXTERNAL, yellow is the same, but a reference trace from 2019-May-10, blue is a reference trace from L1 (2019-Mar), and purple is the 50W (without squeezing) GWINC model.
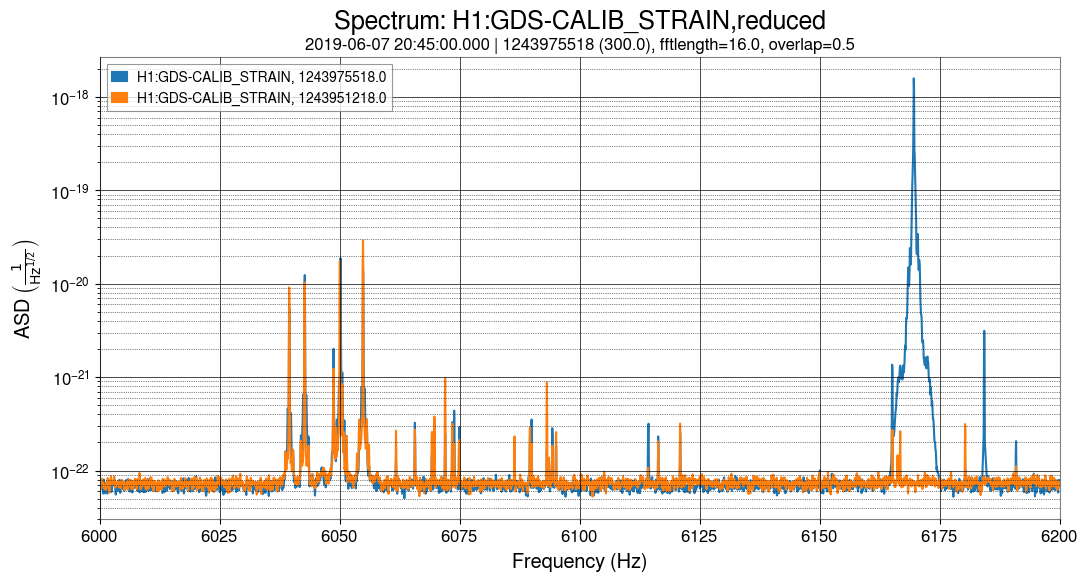
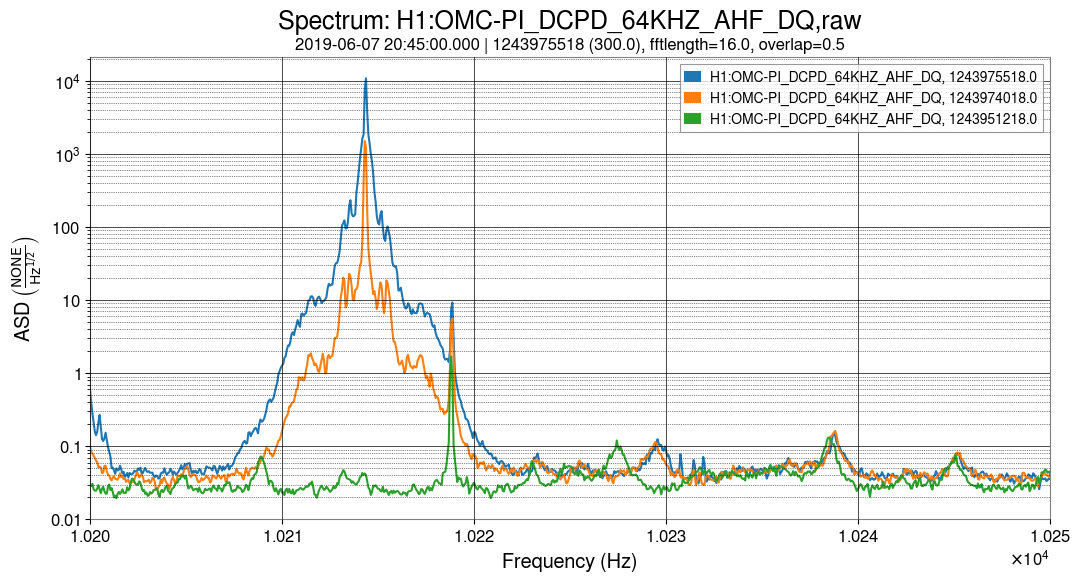
The five lines are actually there earlier in the lock - the line that is ringing up is a bit higher (plot 1). It seems to be aliased down from 10,214 Hz (plot 2). This looks like another PI ringup, at a slightly lower frequency than the one yesterday (alog 49704).
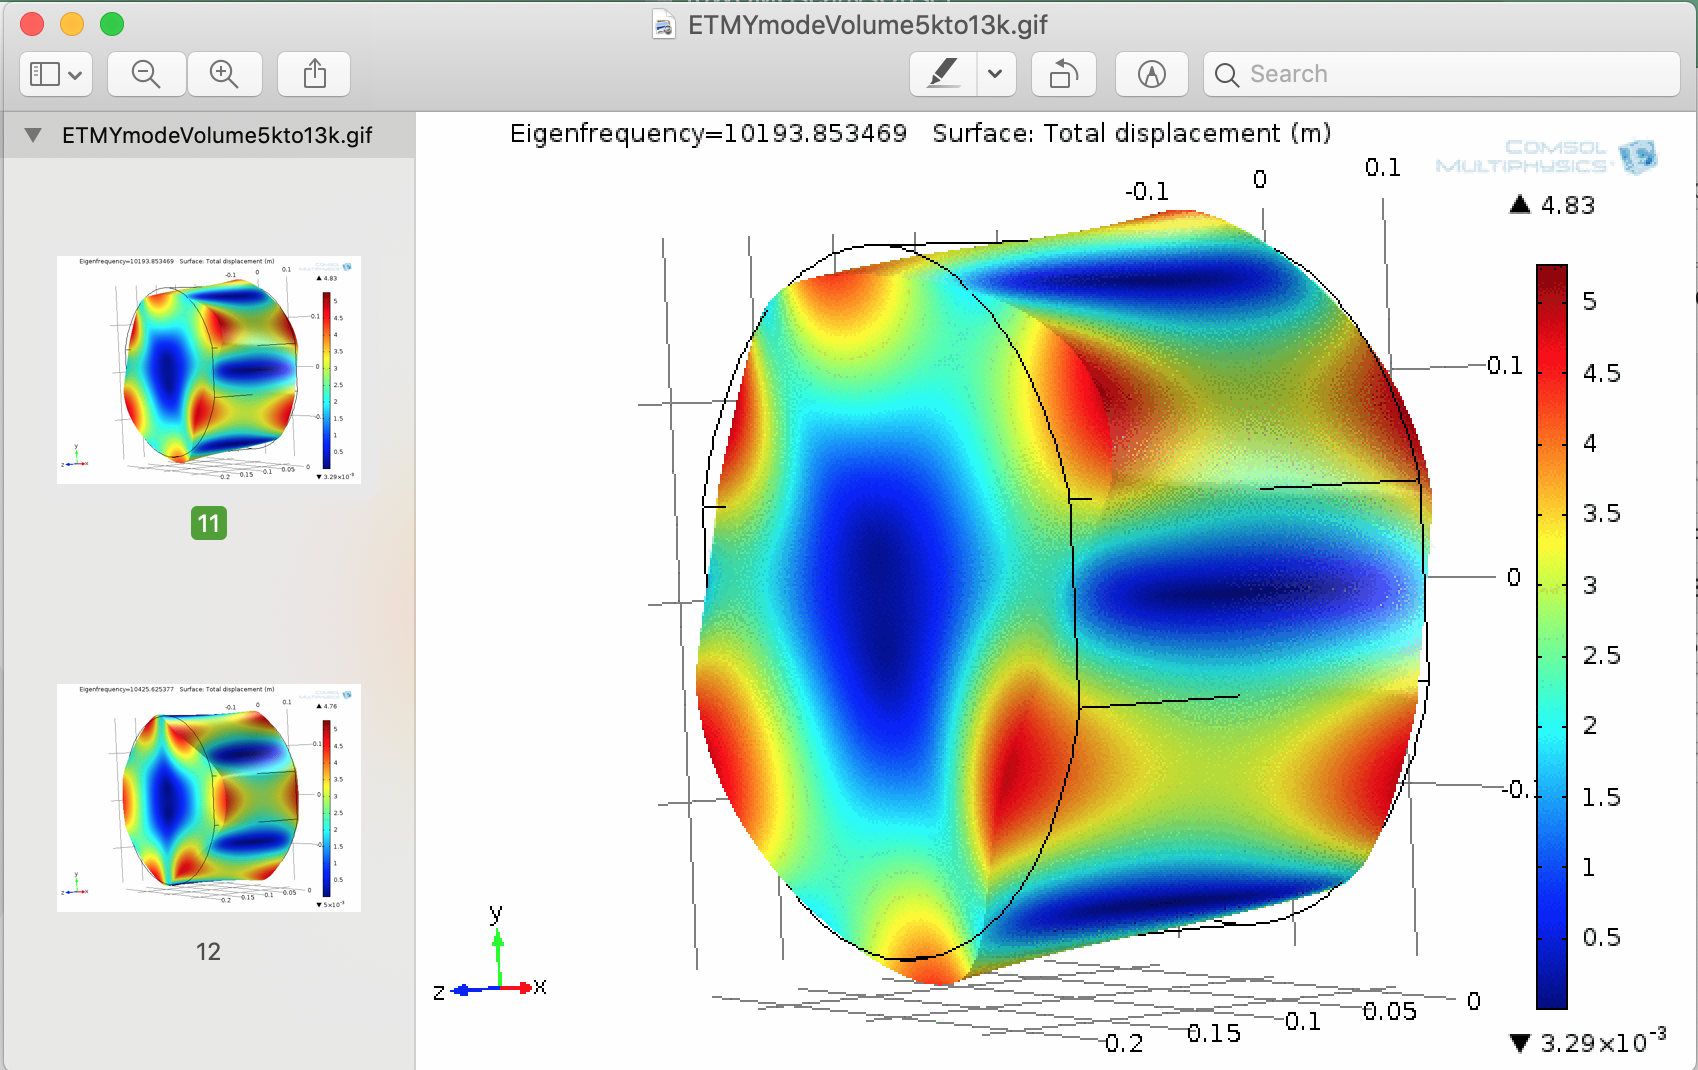
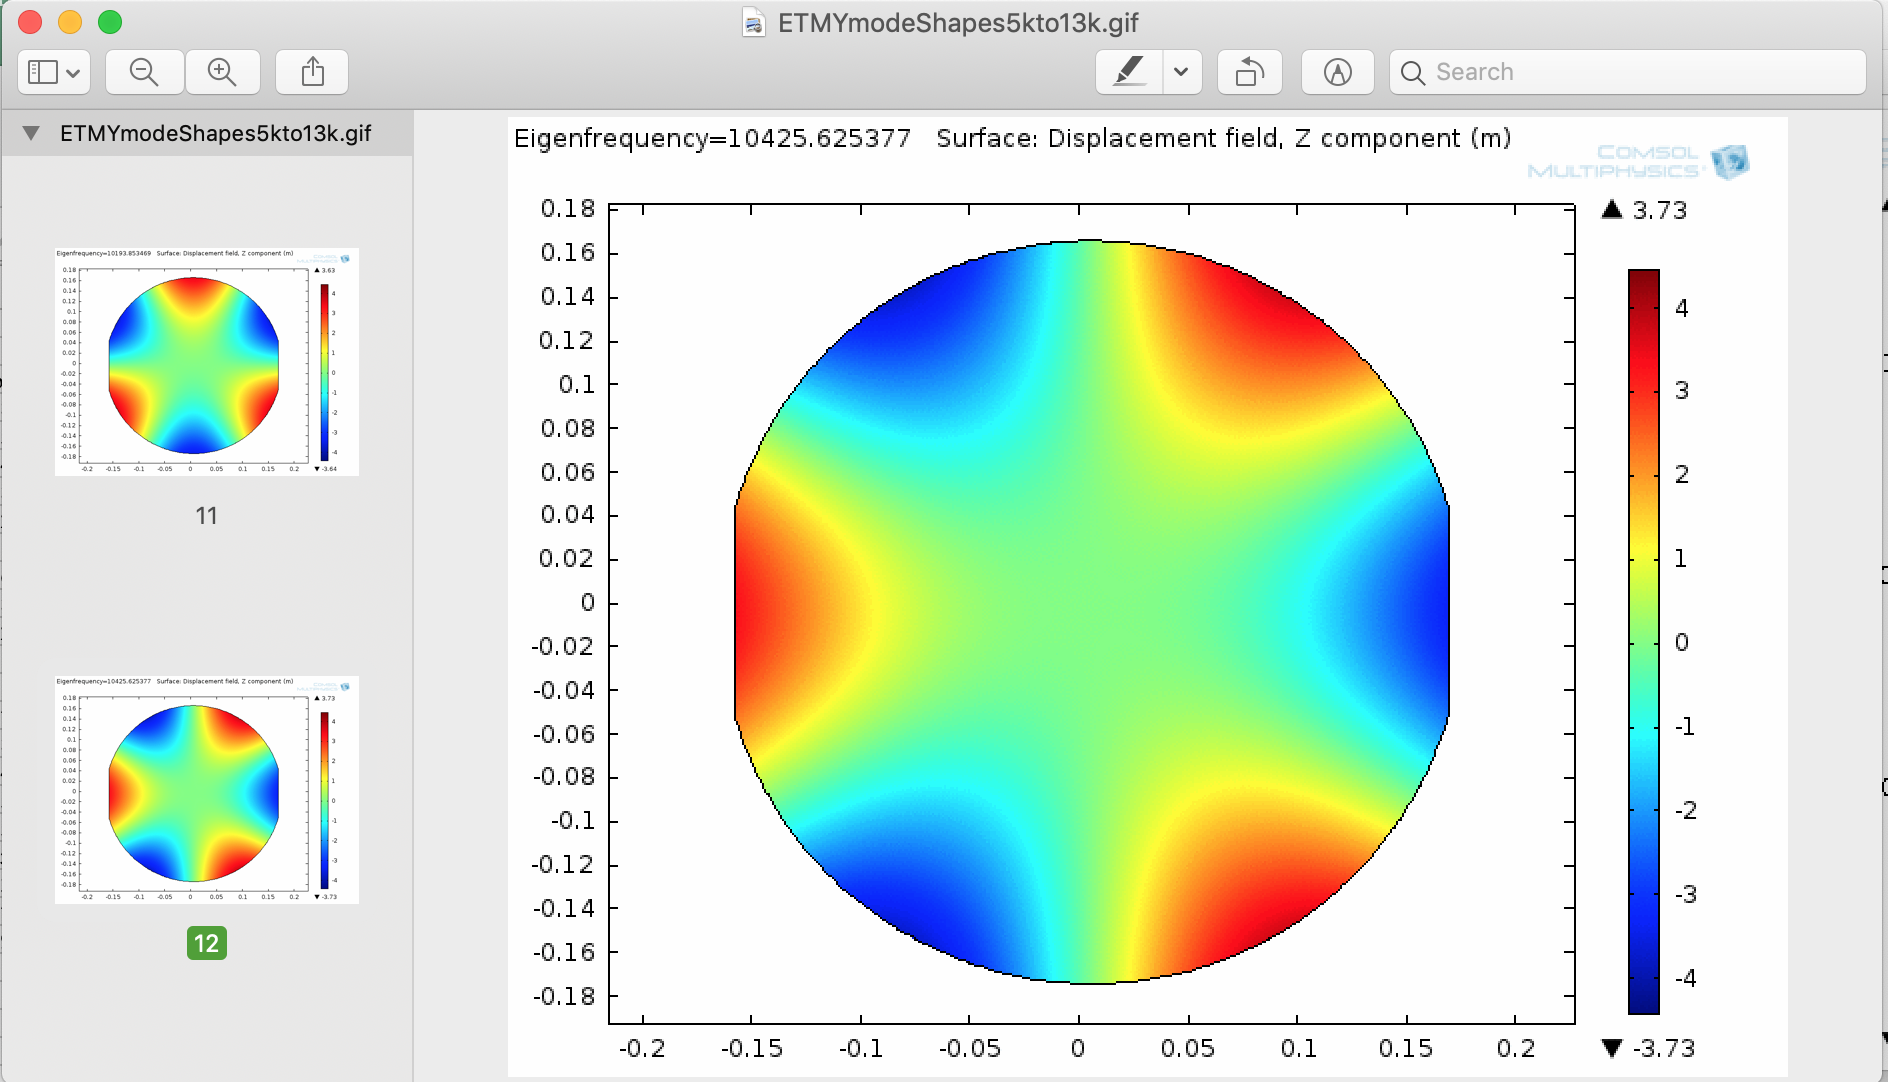
These are the second butterfly shape mechanical resonant modes of the optics (one for each test mass and some other things I'm not so sure about) see images from comsol simulation attached, the previous mode visible in the thumbnail is the first butterfly mode at 5.93kHz. They are always visible in DARM and modes like these breath up and down by as much as an order of magnitude. They can be rung up with the ESDs. It looks like you have different bandwidth which may be confusing when assessing if they are rung up. If they ring up significantly they will be visible in the 3-8kHz BLRMs on the PI summary page. As Andrew pointed out the mode that does ring up is dominant in the 8-12kHz band on the summary page.
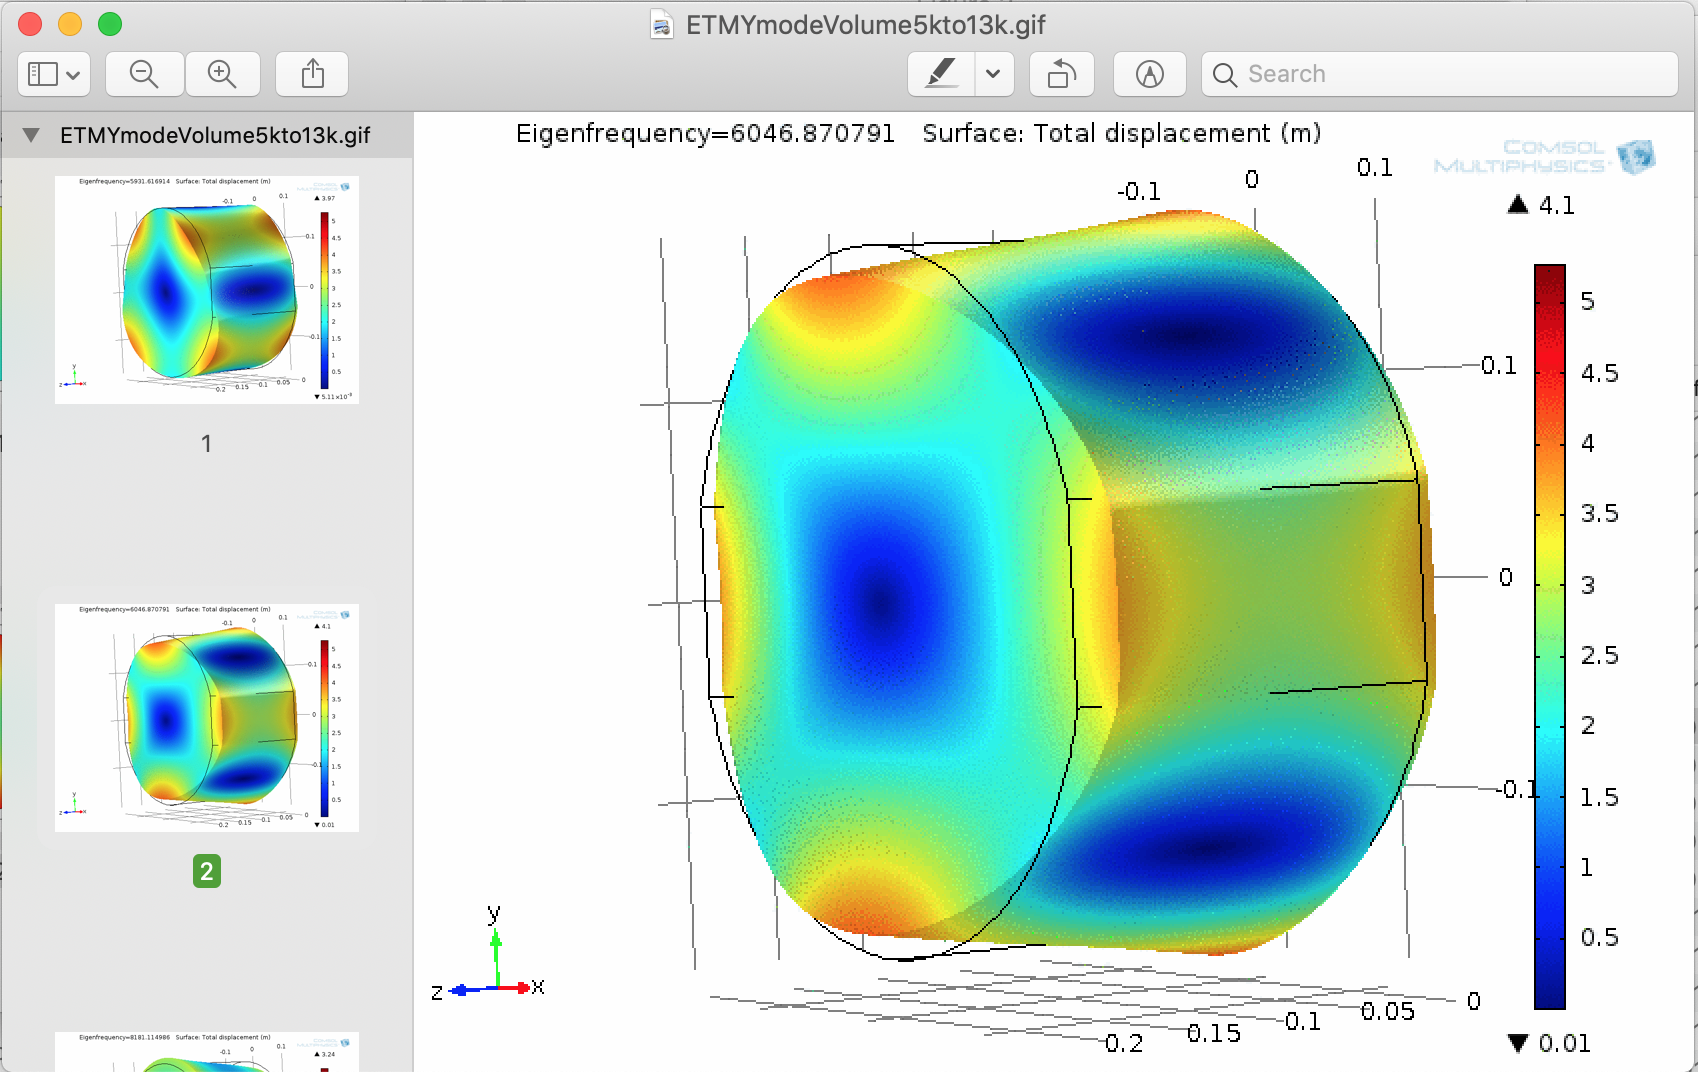
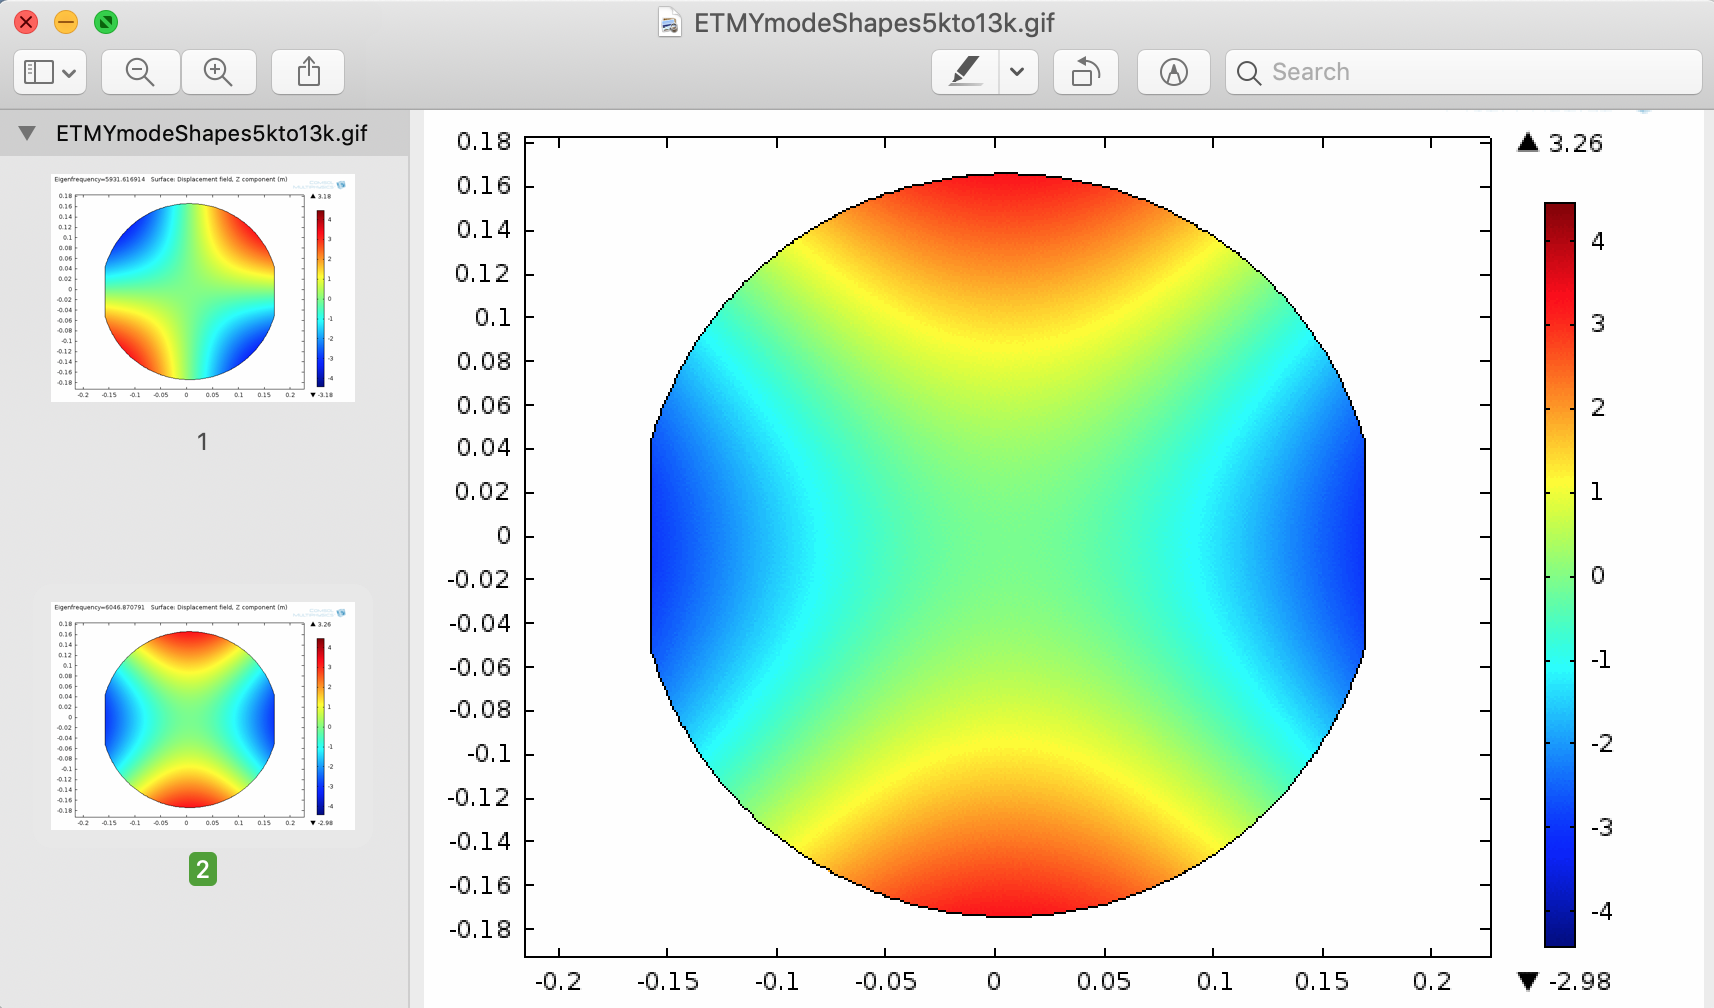
There are two modes of the same mode shape (rotated) in the simulation of the mechanical modes of the test mass at 10426Hz and 10194Hz. This mode is what I thought was the less likely mode of the two that are close to frequency of the first observed instability. These modes should not overlap with HG11 or LG10 type optical modes. However if the beam is not perfectly in the middle of the optic then I think the simulated coupling will increase. I attach gif animations from the simulation so all the modes 5-13Khz can be seen. Also the mode shape a surface deformation for the 10194Hz mode are attached as static figures.