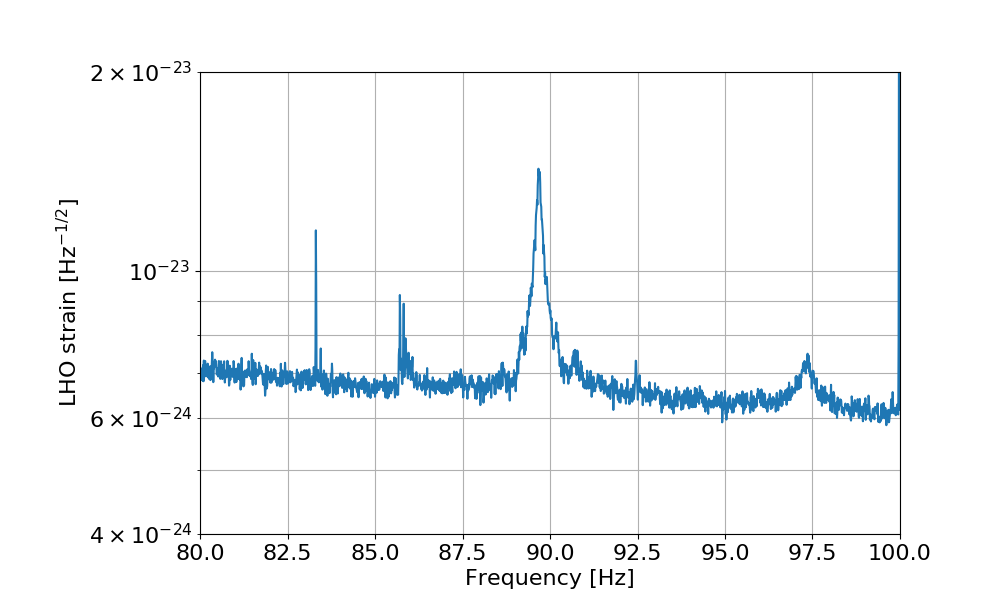
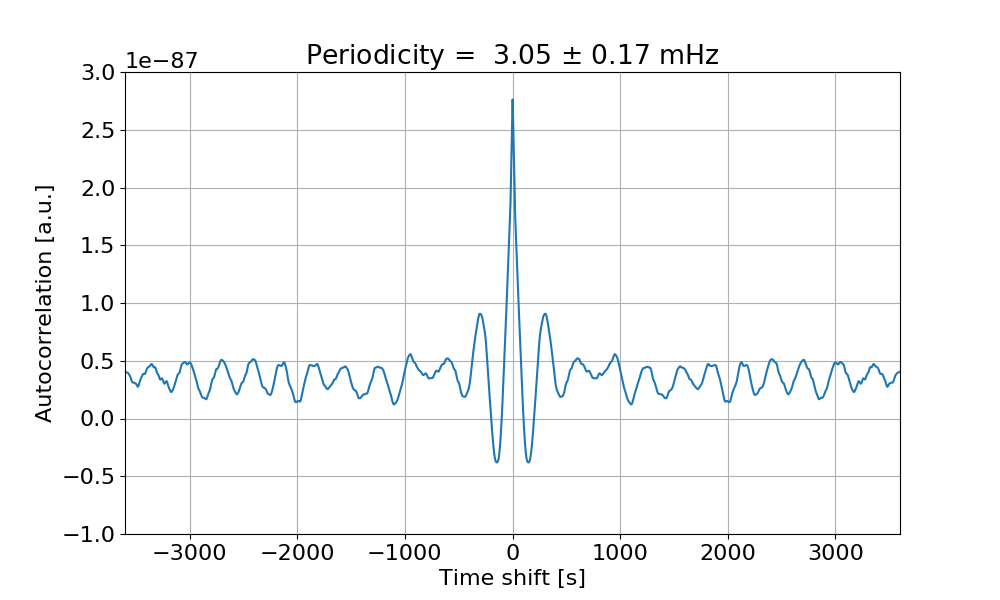
The bump at ~90 Hz is breathing with a very prominent periodicity of about 3 mHz. Any idea where this oscillation could come from?
The first plot shows a zoom around 90 Hz, where the bump is quite clear.
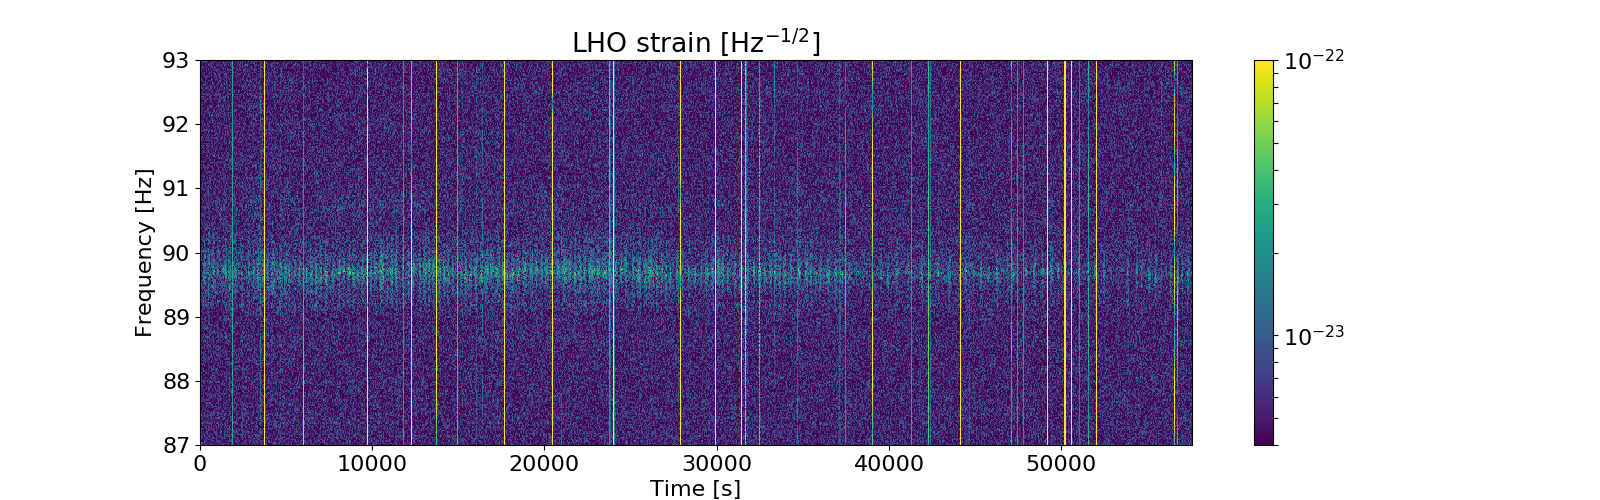
The second plot is a spectrogram of the same 16 hours of data (from 1245974418), showing the non-stationarity of the bump.
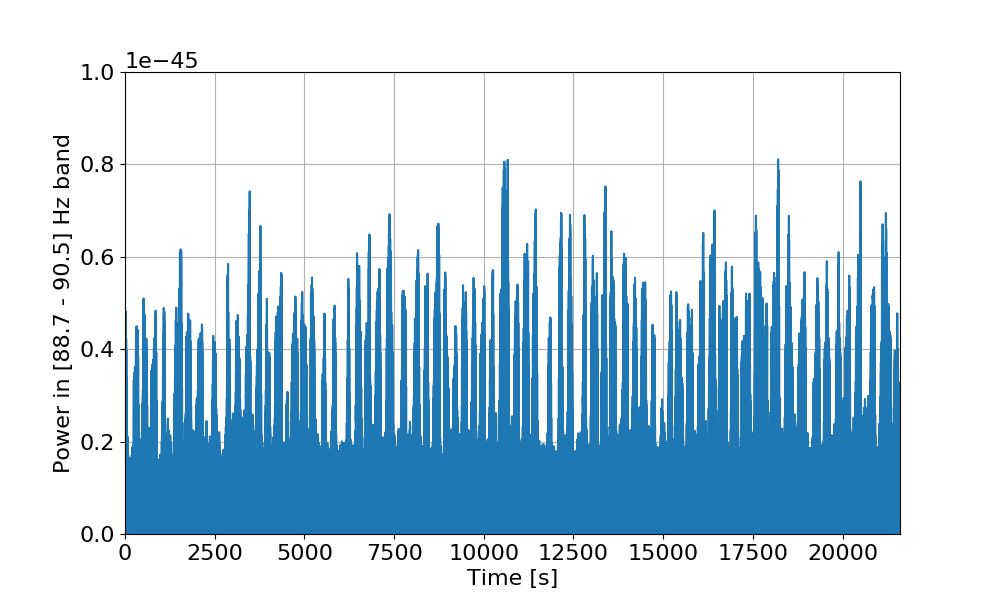
The third plot shows the band-limited RMS computed on the bump (between 88.7 and 90.5 Hz), with large glitches removed. The periodic "on and off" behavior is quite evident.
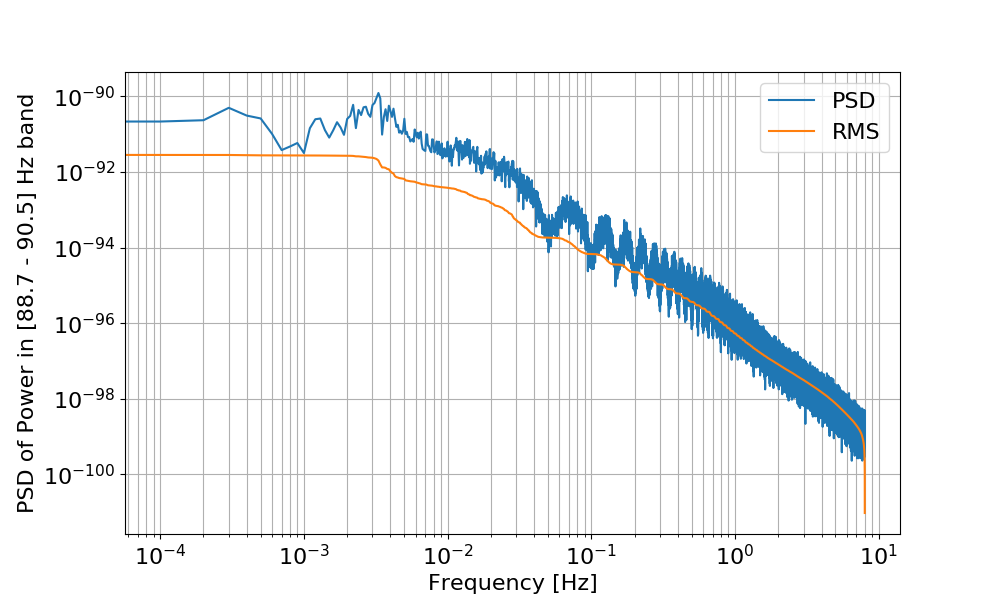
The fourth plot shows the PSD of the time series of the BLRMS, and the integrated RMS. There is a peak at 3 mHz. This is even more visible if one computes the autocorrelation of the BLRMS series: the fifth plot shows that the autocorrelation has a clear signature of a 3 mHz periodicity.