evan.goetz@LIGO.ORG - posted 12:51, Thursday 18 July 2019 (50558)
Investigating H1 spectral artifacts below 100 Hz
In order to investigate the origin of spectral artifacts observed by averaging 1800 s long FFTs (CW group calls these Short Fourier Transforms, SFTs), I have also created 1800 s long FFTs of some auxiliary channels in addition to the standard h(t) derived SFTs. Sheila suggested looking at the HAM6 ISI motion while Anamaria has suggested looking at the OUTPUTOPTICS magnetometer channels. These noise artifacts are most prevalent below 100 Hz, so that is the focus of this investigations

I have created run-averaged, noise weighted spectra from 1800 s long SFTs (using lalapps_spec_avg_long):
H1:GDS-CALIB_STRAIN
H1:PEM-CS_MAG_LVEA_OUTPUTOPTICS_X_DQ
H1:PEM-CS_MAG_LVEA_OUTPUTOPTICS_Y_DQ
H1:PEM-CS_MAG_LVEA_OUTPUTOPTICS_Z_DQ
H1:ISI-HAM6_BLND_GS13X_IN1_DQ
H1:ISI-HAM6_BLND_GS13Y_IN1_DQ
H1:ISI-HAM6_BLND_GS13Z_IN1_DQ
H1:ISI-HAM6_BLND_GS13RX_IN1_DQ
H1:ISI-HAM6_BLND_GS13RY_IN1_DQ
H1:ISI-HAM6_BLND_GS13RZ_IN1_DQ
as well as run-averaged coherence between H1:GDS-CALIB_STRAIN and the auxiliary channels listed above.

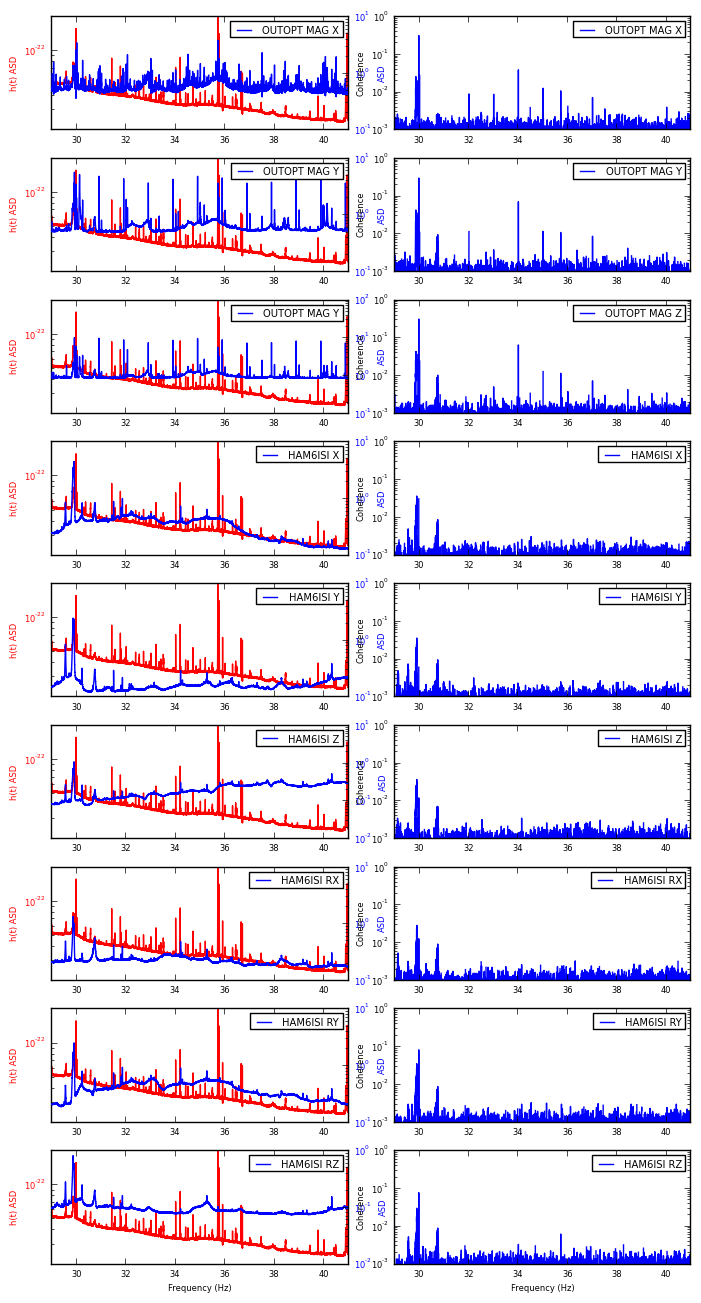
Attached are zoomed plots for every 10 Hz (1 Hz overlapping so we can see artifacts near 10 Hz boundaries). Apologies that some figure labels somewhat overlap. I couldn't make more space in between the columns to separate the labels (Blue "ASD" label belongs to the left column and "Coherence" label belongs to the right column plots). Left hand plots show spectra (h(t) in RED, auxiliary channel in BLUE); right hand plots show coherence between auxiliary channel and h(t).

Unfortunately, nothing really jumps out at me as an indicator of correlation or coherence between the above listed auxiliary channels. The auxiliary channels show plenty of structure, but not much overlap with h(t). It has been suggested by Sheila that perhaps the coupling may change with time, thus degrading coherence measure. I tried to overcome this by simply averaging over the whole O3 run up until now between h(t) and auxiliary channels.

Below are listed the top 10 coherences by frequency in the 10-100 Hz band between h(t) and auxiliary channels for each channel, excluding 60 +/- 0.5 Hz and calibration lines +/- 1 mhz. Columns are:
Frequency | coherence | (rough) empirical SNR

Here, the (rough) empirical SNR is simply the calculation: [coherence - mean(coherence)]/std(coherence)

OUTPUTOPTICS_MAG_X
29.9694 0.3250 76.9
17.7983 0.2893 68.5
17.7989 0.2804 66.4
17.7994 0.2774 65.6
17.7978 0.2681 63.4
17.8000 0.2630 62.2
17.8022 0.2432 57.5
17.8044 0.2386 56.4
17.8033 0.2354 55.7
17.7972 0.2352 55.6

OUTPUTOPTICS_MAG_Y
29.9694 0.3097 205.2
99.9989 0.2094 138.7
99.9983 0.0961 63.5
34.0000 0.0732 48.3
29.8511 0.0441 29.0
29.8539 0.0422 27.7
29.8572 0.0407 26.7
13.1506 0.0405 26.6
29.8528 0.0403 26.5
89.9089 0.0402 26.4

OUTPUTOPTICS_MAG_Z
29.9694 0.3245 179.7
99.9989 0.2055 113.7
99.9983 0.0951 52.5
17.8311 0.0902 49.8
17.8283 0.0848 46.8
17.8306 0.0820 45.2
17.7983 0.0805 44.4
17.8289 0.0754 41.6
17.8272 0.0702 38.7
17.8244 0.0701 38.6

HAM6_ISI_X
99.9989 0.1801 122.9
99.9983 0.0667 45.3
15.1039 0.0646 43.9
15.1044 0.0584 39.6
15.1033 0.0549 37.2
13.1478 0.0483 32.7
13.1439 0.0405 27.4
17.7956 0.0386 26.1
17.8056 0.0381 25.7
29.8878 0.0379 25.6

HAM6_ISI_Y
99.9989 0.1955 143.6
99.9983 0.0807 59.1
15.1033 0.0504 36.8
15.1039 0.0483 35.2
15.1044 0.0421 30.7
13.1478 0.0407 29.6
13.1417 0.0375 27.3
29.8878 0.0373 27.1
13.1439 0.0365 26.5
13.0956 0.0362 26.3

HAM6_ISI_Z
99.9989 0.1337 93.7
15.1039 0.0629 43.9
15.1044 0.0559 39.0
15.1033 0.0539 37.6
99.9983 0.0480 33.4
13.1478 0.0467 32.5
13.1439 0.0415 28.8
13.1456 0.0395 27.4
29.8878 0.0382 26.5
13.1661 0.0375 26.0

HAM6_ISI_RX
99.9989 0.1363 99.5
15.1039 0.0474 34.4
15.1044 0.0431 31.2
13.1478 0.0419 30.3
17.7983 0.0401 29.0
15.1033 0.0398 28.8
13.1439 0.0392 28.4
13.1033 0.0392 28.4
13.1178 0.0384 27.8
17.8028 0.0383 27.7

HAM6_ISI_RY
99.9989 0.1030 76.3
29.9694 0.0851 63.0
15.1039 0.0633 46.7
15.1044 0.0553 40.8
15.1033 0.0539 39.8
13.1478 0.0474 34.9
13.1439 0.0397 29.2
13.1456 0.0386 28.4
13.1661 0.0372 27.3
29.8878 0.0366 26.9

HAM6_ISI_RZ
99.9989 0.1683 156.6
29.9694 0.0796 73.9
99.9983 0.0724 67.2
15.1039 0.0538 49.8
15.1044 0.0528 48.9
15.1033 0.0483 44.7
13.1478 0.0335 30.9
89.9089 0.0333 30.7
13.1661 0.0316 29.1
29.8878 0.0309 28.4

It's possible that some frequencies (like the 99.9989 Hz) line is polluting many different channels, so it shows up in both magnetometers, ISI sensors, and h(t). Maybe fixing some of these in the top-list will also fix other lines that are polluting h(t), especially in the 20-70 Hz band, where the line density is worst.

Some further investigative work is needed on additional auxiliary channels. Other ideas?
Images attached to this report