anne.baer@LIGO.ORG - posted 10:18, Friday 26 July 2019 (50841)
O3 Blip Glitch Studies
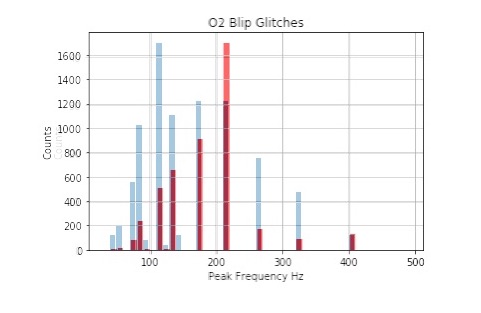
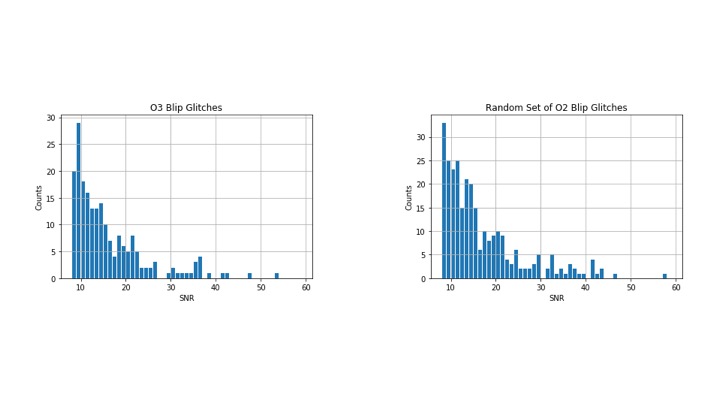
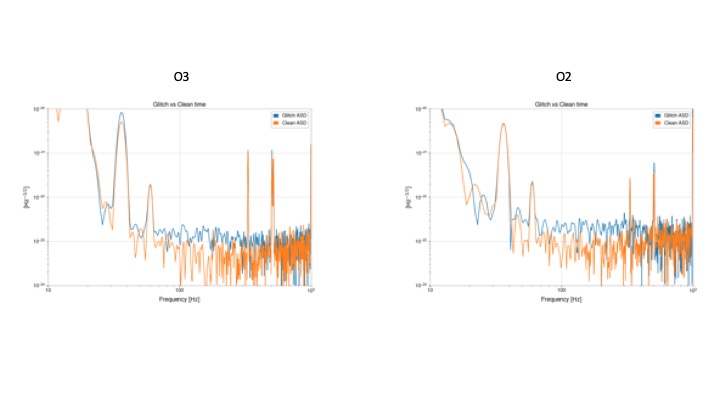
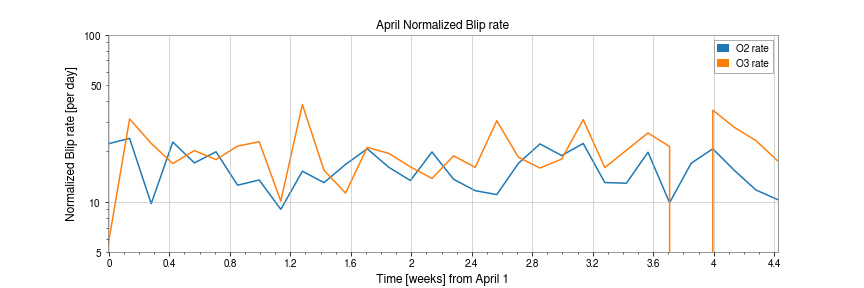
Anne Baer, Adrian Helmling-Cornell, Siddharth Soni, Derek Davis

Summary: Blip glitch behavior at Hanford has changed slightly between O2 and O3, but generally appears with the same features as before. Blip glitches do not appear related to the high-SNR glitches seen in O3.


We investigated blip glitches at Hanford and how they have, or have not, changed from O2 to O3 using the blip data from GravitySpy.

Comparing the displayed quality factor, and the distributions of SNR and peak frequency of the blips, we found that the peak frequency seems to have shifted lower for O3 (see attachment 1, O2 in red, O3 in blue). The distributions of SNR show only a minimal difference between O2 and O3. Notably, this suggests that blip glitches do not account for the large number of high-SNR glitches observed in O3 (see attachment 2).

The minimum frequency also appears to have slightly dropped in O3, but we are unsure whether this is a statistical noise or not. However, this does match the expected change from a constant amplitude source.

The ASD curves of the blips from O2 and O3 do not show any significant differences in glitch spectra, nor does the spectra seem to indicate any significant features, looking mostly like white noise after 70 Hz (see attachment 3 for example ASDs)

The distance of the blips from the start or end of a lock segment also seems to be very similar, indicating that the blips are not related to lock loss or acquisition. O3 blips seem to be slightly more likely to be towards the beginning of lock and O2 more towards the end, but neither significantly so. The time duration between individual glitches also appears to follow that expected from a random process.

Comparing the rates of blip glitches in April of O2 and O3 at Hanford, there does appear to be a small increase in the number of glitches (see attachment 4). However, this rate was highly variable in O2, and higher by an order of magnitude during winter months and periods of low internal humidity.
Images attached to this report