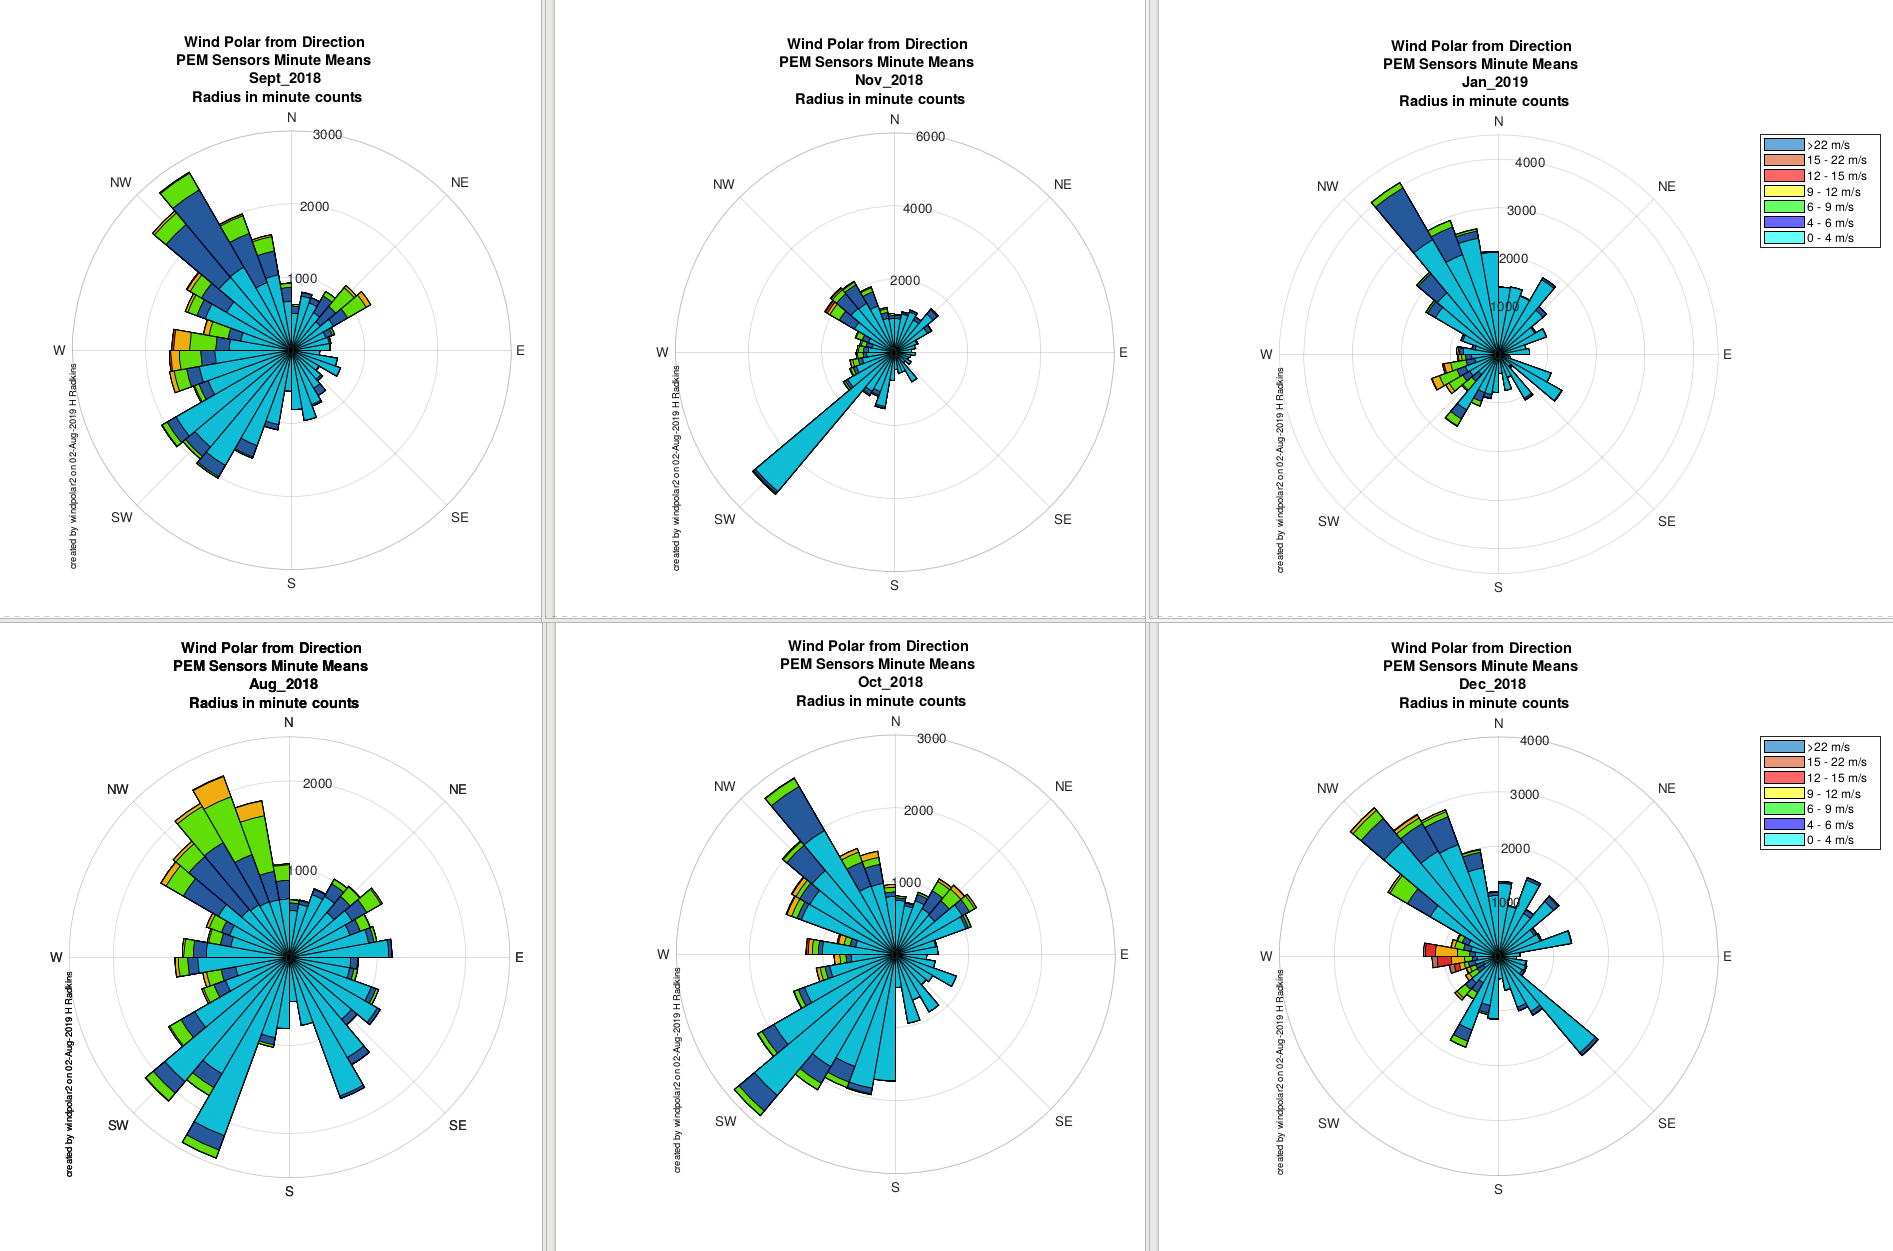
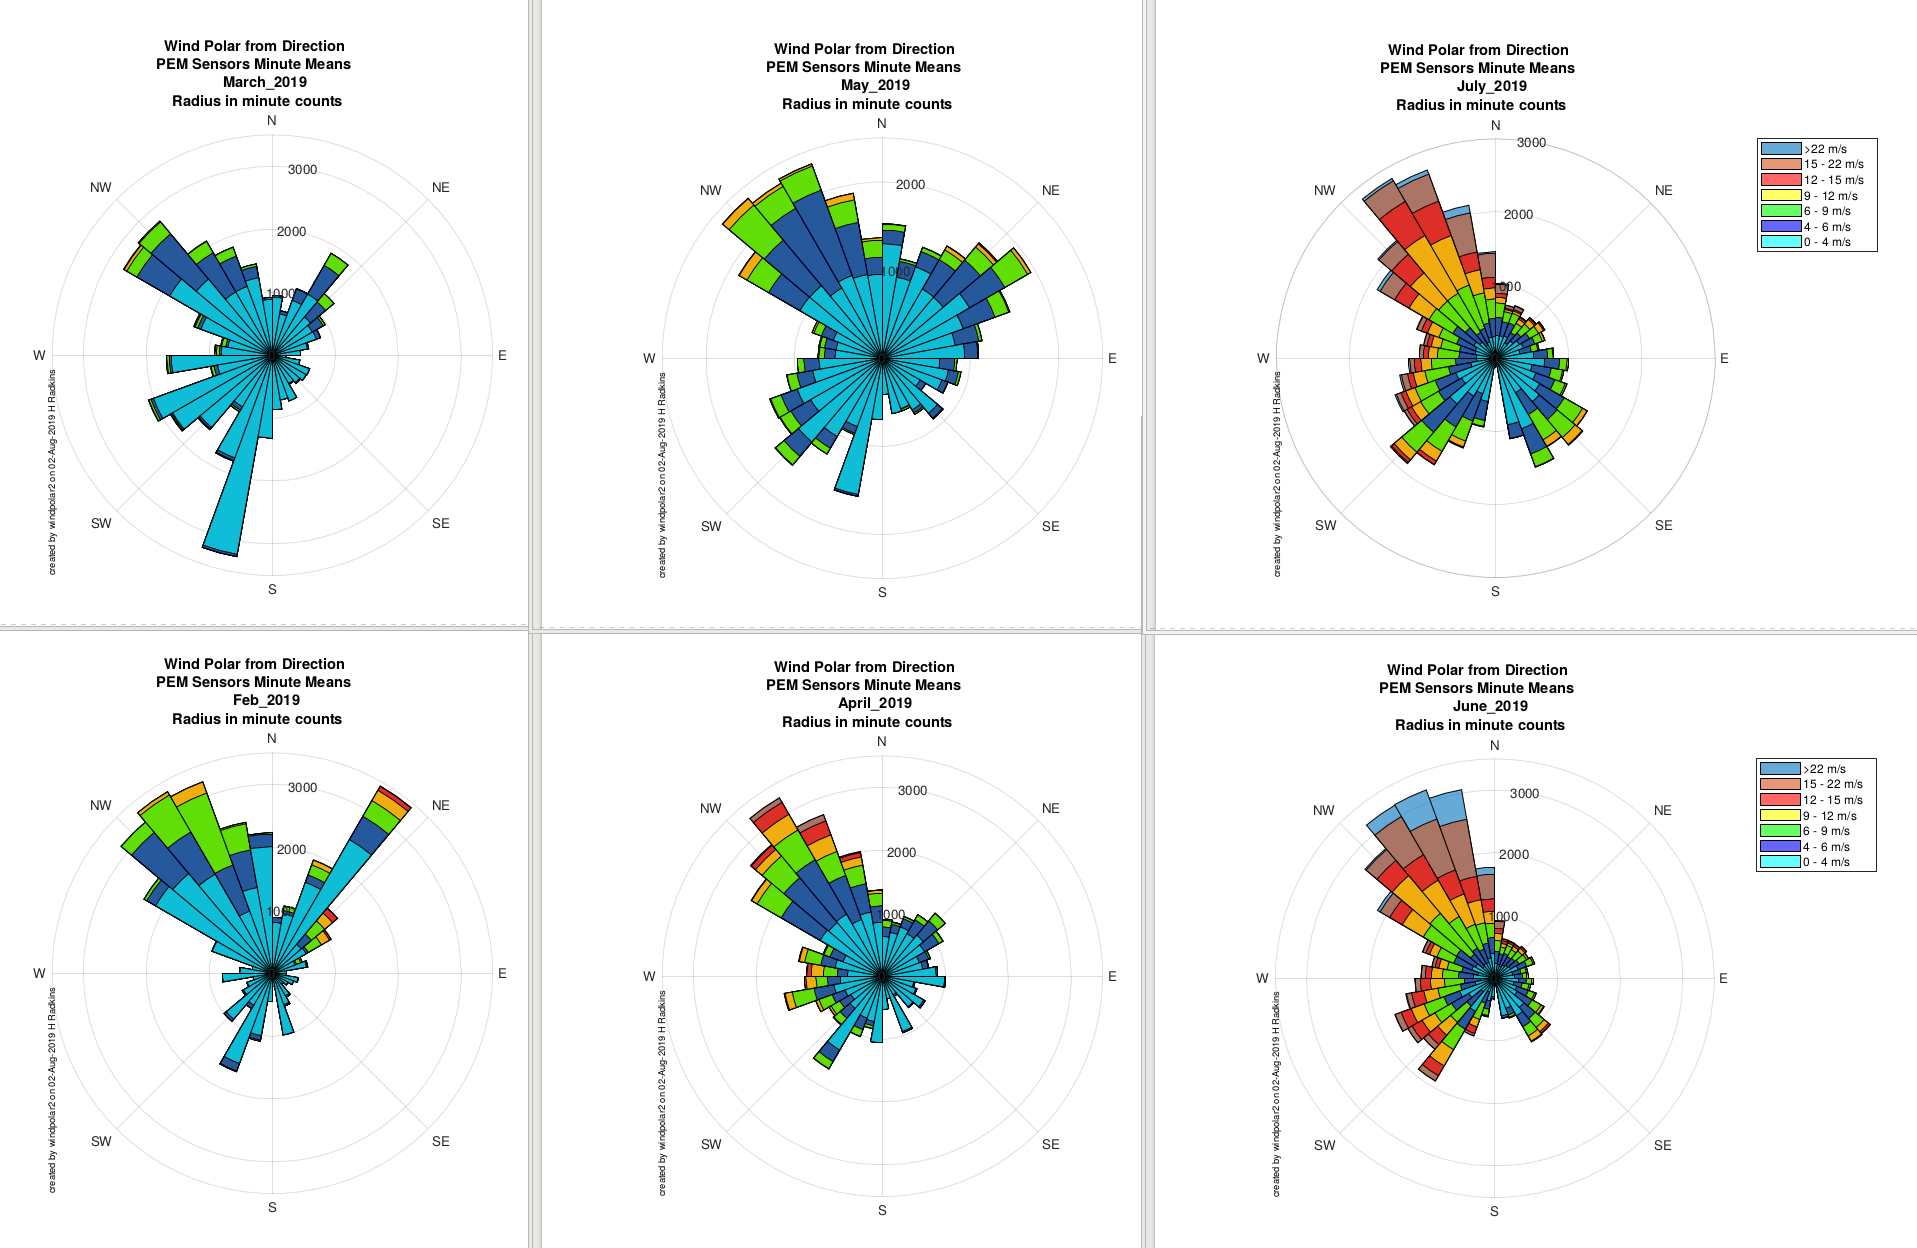
Since we are planning to mitigate wind with a linear fence, it seemed like I should look at our trends to make sure the fence would actually stop our wind.
Our original plan was developed using the historic wind from the Pasco airport, see page 5 of G1800148 (BTL); wind tends to be regional and those results fit our local qualitative observations. And there had been some lingering suspicion about the quality of the PEM directional data hence a reluctance to believe it. But those concerns have mostly been relieved now, see 28445 for direction sense, and most of the sensors have been replaced in the last few years.
The two attachments show the past 12 monthly wind polarhistograms of minute means from the EndX PEM sensors; the colors are velocity bands (see legend) and the radial axis is minute counts. I'm not sure I like this depiction as the most useful but still working on an alternative. The directions here are Crane direction rather than true; that is 'N' is +X and 'W' is +Y. The quick conclusions I'll report are that the majority of winds come from the NW (+Y, +X) followed by the SW and then the NE. The NW direction by far produces the majority of the strongest winds with SW, W, and NE following in that order. Other than the small percentages of stronger winds coming from the NE, the current wind fence plan will address our biggest wind problems and this data is not inconsistant with the Pasco Airport data.
Caveat on the sensors, the PEM anemometers are ~6' above the roof top and the directions and velocities may be strongly influenced by the building itself. I'll repeat this with the Wind Fence sensors farther afield but we've had a few failures so the data may be more patchy.