evan.goetz@LIGO.ORG - posted 15:49, Tuesday 06 August 2019 (50992)
Processing O3 calibration measurements and determining response function uncertainty
Over the course of O3 thus far, Jeff K. and others have made numerous optical plant and actuator measurements. A concern has been about the variability of the optical plant at low frequencies and how this may impact calibration and calibration uncertainty. This aLOG serves as a study of all of the measurements made up to the present date and assess the impact on the optical plant variations on calibration.

Disclaimer: I am not proposing, at this point, to have any new calibration epoch. I merely explore this idea as a possibility given the changing state of the detector as commissioners make changes. Ideally, time-dependent correction factors will track the changing state, provided that the optical plant model remains faithful to the measured state of the instrument. If so, then we would certain time-dependent correction factors to correct the calibration for known systematic errors.

Optical plant measurements, data stored at and under the following dates:
trunk/Runs/O3/H1/Measurements/FullIFOSensingTFs/
2019-03-28
2019-03-29
2019-03-31
2019-04-04 (but labeled in filename as 2019-04-03; this is the measurement used to inform the reference model for O3 installed to date)
2019-04-10
2019-04-17
2019-05-02
2019-05-08
2019-05-09
2019-05-22
2019-05-29
2019-06-06
2019-06-12
2019-06-19
2019-06-27
2019-07-03
2019-07-10
2019-07-17
2019-08-01

UIM actuator measurements, stored at and under the following dates:
trunk/Runs/O3/H1/Measurements/FullIFOActuationTFs/
2019-03-27
2019-04-03 (this is the measurement used to inform the reference model for O3 installed to date)
2019-04-10
2019-04-24
2019-06-06

PUM actuator measurements, stored at and under the following dates:
trunk/Runs/O3/H1/Measurements/FullIFOActuationTFs/
2019-04-03 (this is the measurement used to inform the reference model for O3 installed to date)
2019-04-10
2019-04-24
2019-05-08
2019-06-06
2019-06-26
2019-07-03

TST actuator measurements, stored at and under the following dates:
trunk/Runs/O3/H1/Measurements/FullIFOActuationTFs/
2019-03-27
2019-04-03 (this is the measurement used to inform the reference model for O3 installed to date)
2019-04-10
2019-04-24
2019-05-08
2019-06-06
2019-06-26
2019-07-03

The reference model used to date is trunk/Runs/O3/H1/params/modelparams_H1_20190416

Optical plant measurements have shown variability, especially at low frequencies, probably because of changing parasitic coupling of angle to length via spot position and gain changes of the DHARD control loop. To investigate this behavior, Jeff has associated changes in optical plant parameters with specific commissioning tweaks to the interferometer in LHO aLOG 50966 and in G1901353. It was suggested that because we see 3 different sets of optical plant parameters (especially in optical gain), there may also need to be three different epochs for the calibration of H1 (suggested Apr 1 - Jun 11, Jun 11 - Aug 1, Aug 1 - present). It may be unnecessary to have three epochs, however, if the calibration systematic uncertainty between measurement and model does not differ significantly for these different potential epochs. Alternatively, if time-dependent correction factors do not faithfully track optical plant changes, then different epochs would be difficult to define. Attached are Gaussian Process Regression measurements of the three epochs Jeff described as well as the overall systematic uncertainty for all optical plant measurements made to date.

Fig 1 pdf: "Epoch 1" optical plant residuals and Gaussian Process Regression (Apr 01 - Jun 11)
Fig 2 pdf: "Epoch 2" optical plant residuals and Gaussian Process Regression (Jun 11 - Aug 01)
Fig 3 pdf: "Epoch 3" optical plant residuals and Gaussian Process Regression (Aug 01 - now); note, there is only one measurement. If this is a separate epoch, then this is kind of meaningless until more measurements are made
Fig 4 pdf: all O3 optical plant residuals and Gaussian Process Regression (Apr 01 - now)

To generate these figures, the script is stored at
aligocalibration/trunk/Runs/O3/H1/Scripts/Uncertainty/process_allmeas_writeGPRHDF5_model20190416-C.py

Important notes regarding Figures 1-4:
1) Optical gain and coupled-cavity pole frequency changes, as measured by the MCMC values have been divided out of the measurements. This brings measurements made on different days to the same state as on the reference date. Doing so presumes that the time-dependent correction factors faithfully follow the MCMC values
2) Low frequency spring (or anti-spring) and quality factor have *not* been divided out, because we cannot presume--at least for now--that the time-dependent correction factors track these changes.
3) The input to the Gaussian Process Regression algorithm for these figures has been modified: we don't input every individual measurement residual and instead we input a weighted average and standard deviation of each measurement frequency. The reason for making this change is because we cannot assume the measurement residuals are purely statistical in nature; there is an unmodeled effect that we hope the different measurements capture and thus can compute a standard deviation that well-quantifies the changing state of the optical plant at the cost of increasing uncertainty in the systematic error.

I have similarly generated residuals and Gaussian Process Regression plots for each of the actuators, attached below

Fig 5 pdf: UIM actuator residuals and Gaussian Process Regression
Fig 6 pdf: PUM actuator residuals and Gaussian Process Regression
Fig 7 pdf: TST actuator residuals and Gaussian Process Regression

To generate these figures, the script is stored at
aligocalibration/trunk/Runs/O3/H1/Scripts/Uncertainty/process_allmeas_writeGPRHDF5_model20190416-A.py

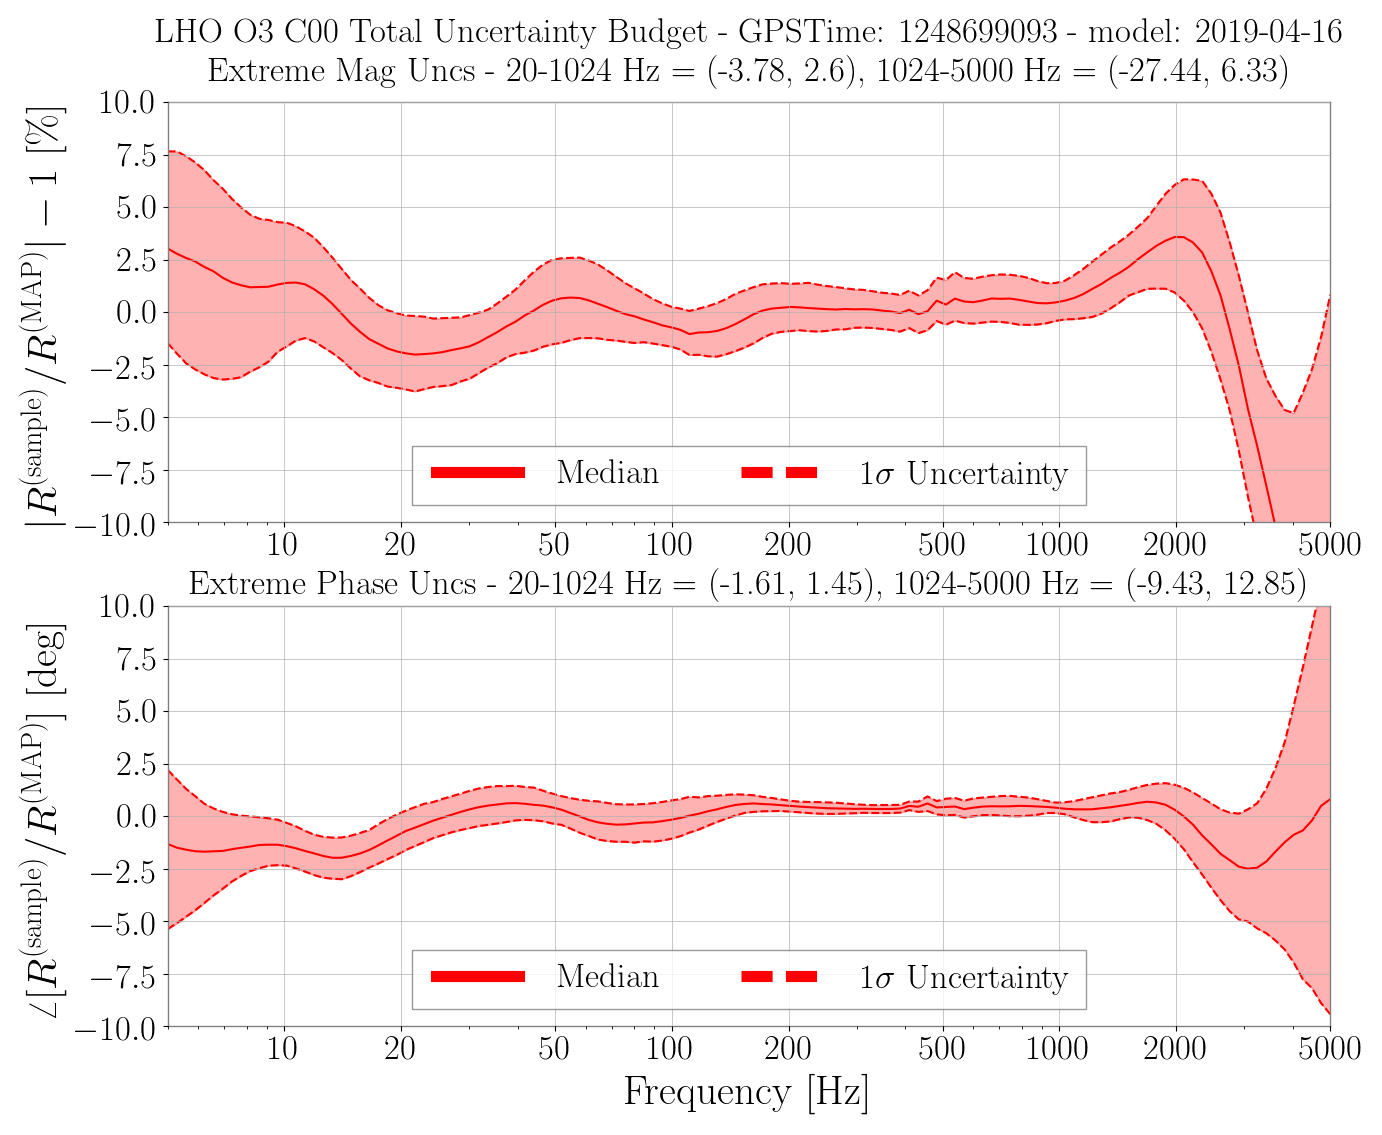
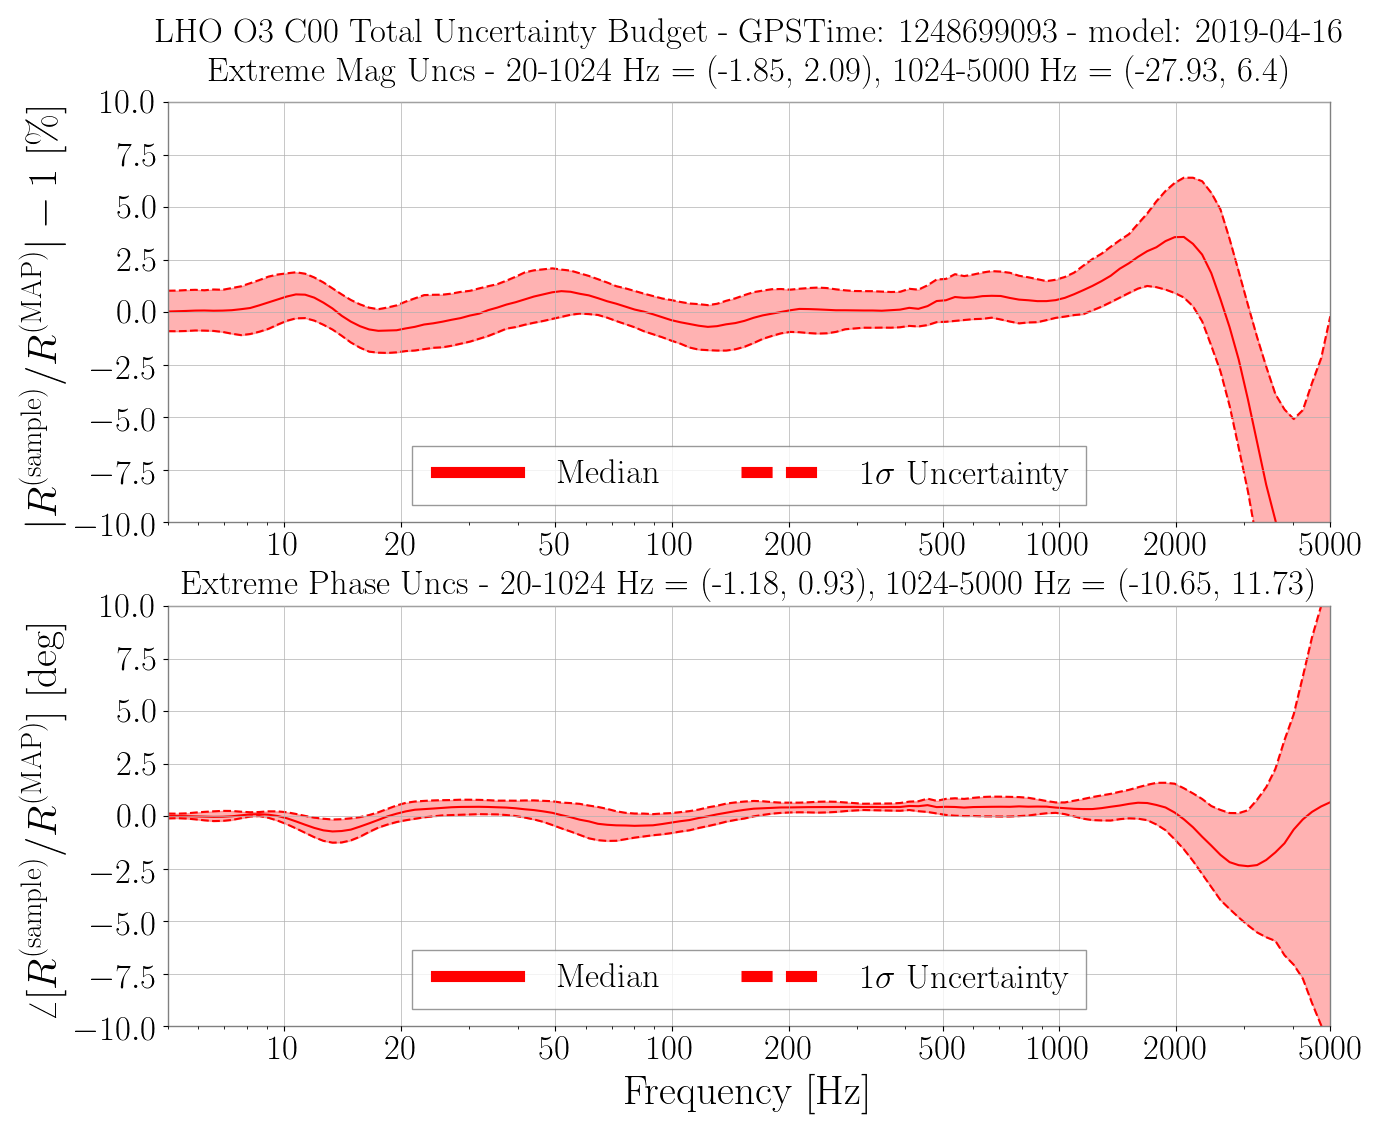
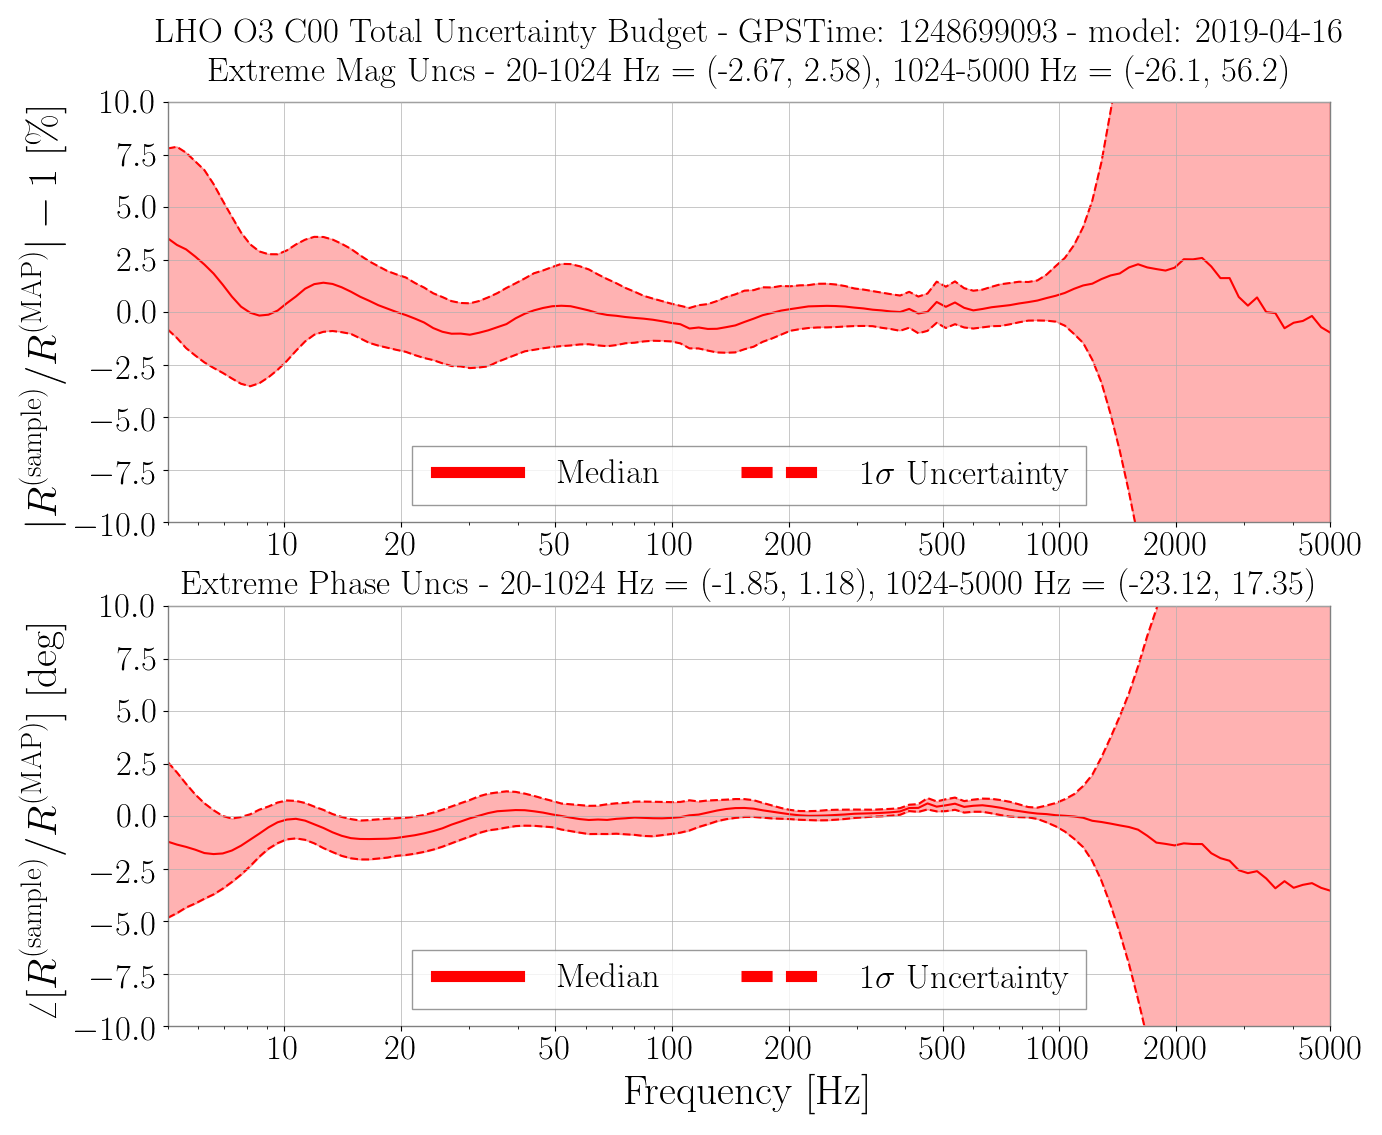
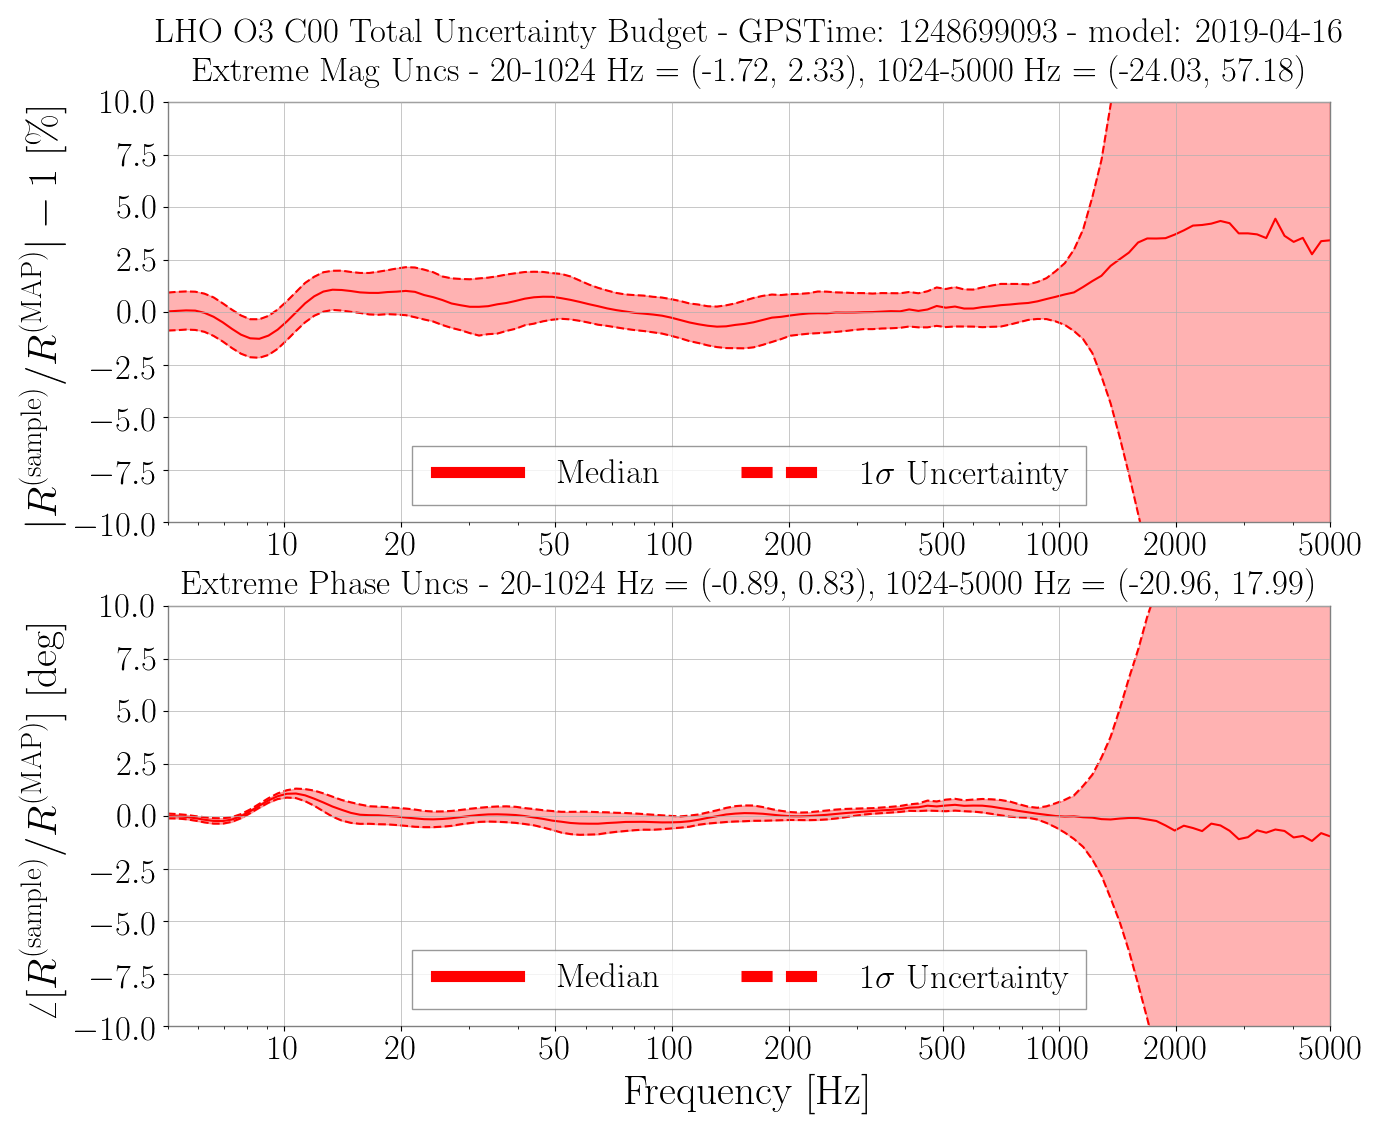
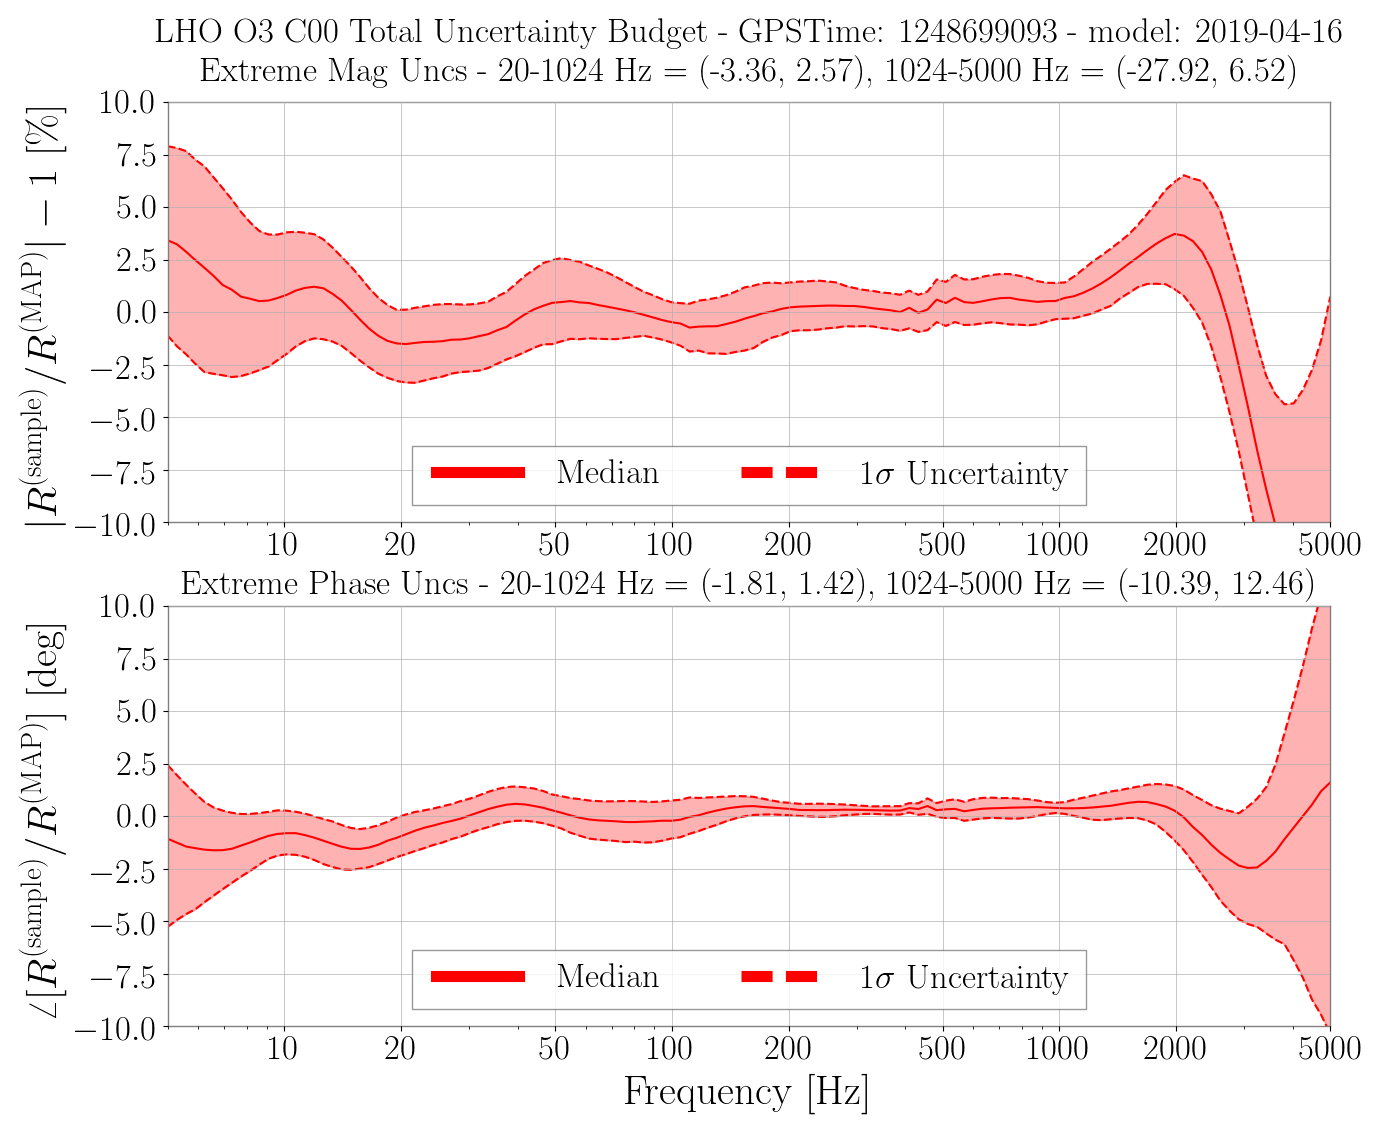
To understand the final impact on the systematic uncertainty, we run the RRNom.py script on the HDF5 files that contain the maximum a postiori and posterior GPR results. Only "epoch 1", "epoch 2", and all the measurements are compared. I chose an arbitrary GPS time, 1248699093 (= Aug 01 2019 12:51:15 UTC):
$ python3 RRNom.py --outDir=../../O3/H1/Results/Uncertainty/ --HDF5_A_MCMCresults=../../Runs/O3/H1/Results/Uncertainty/O3_H1_A_MCMC_20190404.hdf5 --HDF5_A_GPRresults=../../Runs/O3/H1/Results/Uncertainty/O3_H1_A_GPR_20190416_multi.hdf5 --HDF5_C_MCMCresults=../../Runs/O3/H1/Results/Uncertainty/O3_H1_C_MCMC_20190404.hdf5 --IFO=LHO --modelPath=../../Runs/O3/H1/params/ --modelFilename=modelparams_H1_20190416 --IFOmodel=modelPars --gpsTime=1248699093 --sampleNumber=1000 --version=C00 --plot1SigmaUncs --HDF5_C_GPRresults=../../Runs/O3/H1/Results/Uncertainty/O3_H1_C_GPR_20190416_all.hdf5

Fig 1 png: response function uncertainty and confidence intervals for "epoch 1"
Fig 2 png: response function uncertainty and confidence intervals for "epoch 1" removing systematic error and uncertainty of the actuation stages
Fig 3 png: response function uncertainty and confidence intervals for "epoch 2"
Fig 4 png: response function uncertainty and confidence intervals for "epoch 2" removing systematic error and uncertainty of the actuation stages
Fig 5 png: response function uncertainty and confidence intervals for all of O3
Fig 6 png: response function uncertainty and confidence intervals for all of O3 removing systematic error and uncertainty of the actuation stages

The good news is that there is not significant impact on response function uncertainty for different "epochs" at low frequency. The main difference between PNG Fig 1 and PNG Fig 3 is at high frequency: we have only analyzed high frequency measurements once, but we have plenty of data in the can, waiting to be analyzed. Including all optical plant measurements to date, and not correcting for any time-dependent changes does not detrimentally impact response function uncertainty. Between 20 Hz and 1024 Hz, the maximum 1-sigma deviation from nominal is about 3% in magnitude and about 2 degrees in phase. Of course, another GPS time will have somewhat different values.

So, for now, I'd argue that we shouldn't necessarily need a new epoch. We don't know if our optical plant model at low frequencies is actually valid, which may mean that any time-dependent correction factor derived from that model for low frequencies would even correctly track the changes. Perhaps we can stick with this for now and if the commissioning team is able to resolve the coupling between angular control loops at low frequency with the length degree of freedom, then we could start a new epoch.

TODO:
1) analyze high frequency optical plant measurements and include in GPR computation
2) determine to what degree the time dependent correction factors can track and follow the low frequency changes of the optical plant
3) Currently, we are just computing a weighted standard deviation for the input to GPR, but we should instead compute a correct Student's-t distribution measure of the variance for each frequency because we have low number statistics
Images attached to this report

Non-image files attached to this report
