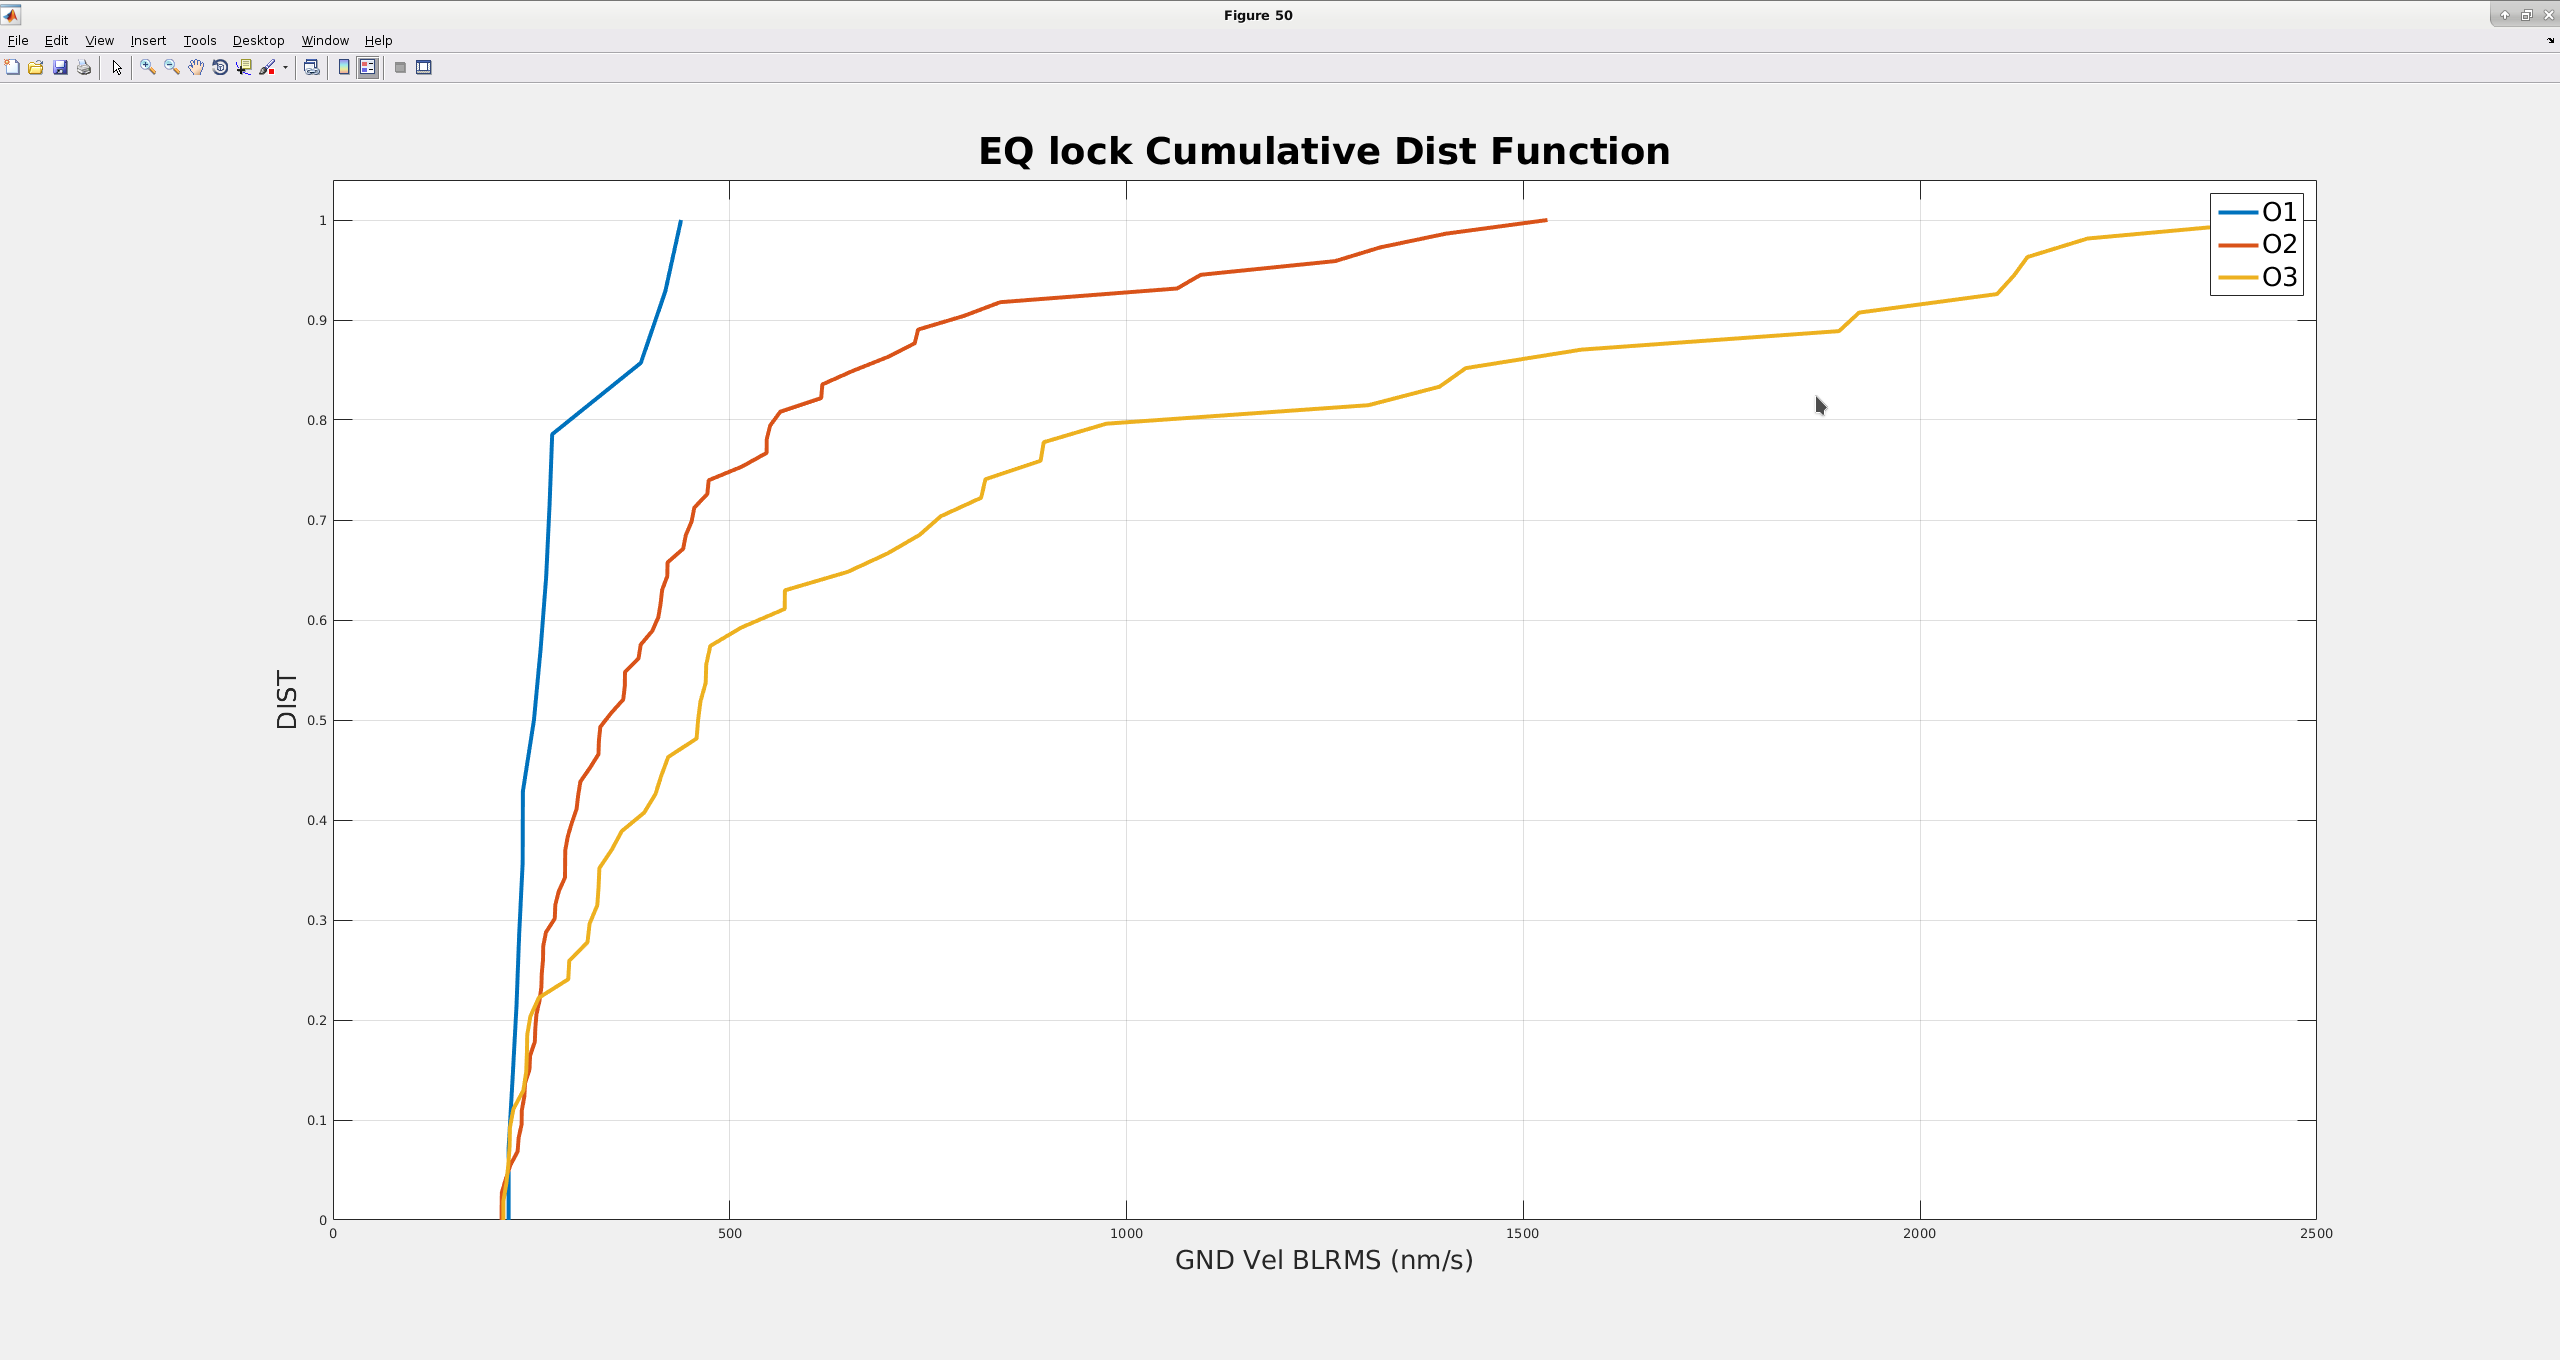
I've been trying to put together some data on improvements to our earthquake robustness, kind of related to work that EyalS has done while LLO works on their earthquake stuff. My attached plot compares the cumulative distributions of earthquakes that we have ridden out over the 3 observing runs. The blue trace is O1, red is O2, gold is O3. I generated this plot by using the matlab peakfinder code to find peaks in the .03-.1hz Z ground blrms to find all peaks in this band above 200nm/s and found all of the peaks that we were in NLN 10 minutes before and 10 minutes after. I would interpret this plot as for a given peak velocity in O3 we are about twice as likely to stay locked as we were during O2. Maybe someone smarter has a better interpretation.
My original intent was to show that the earthquake mode has improved our ability to ride out an earthquake, and this plot does show that we are doing better now than in previous runs. But, I would like to try to do a comparison during O3 when we used used the earthquake settings and when we didn't touch anything. Still working on that.