
This is a continuation of the investigation in this aLOG comment: https://alog.ligo-wa.caltech.edu/aLOG/index.php?callRep=49620

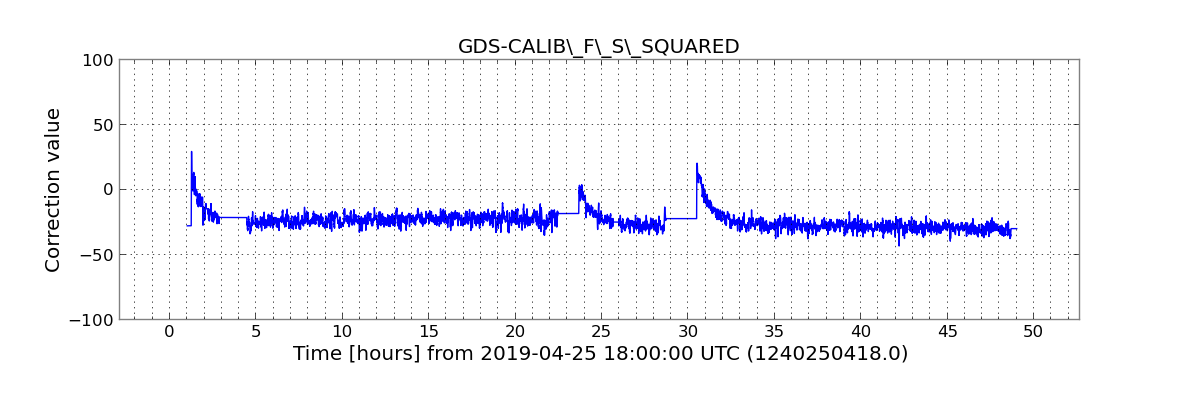
I've plotted 48 hours of data beginning at 19:00 UTC on April 25, 2019.  The goal was to capture the SR3 change noted here: https://alog.ligo-wa.caltech.edu/aLOG/index.php?callRep=48787.  There is no obvious noteworthy change in the spring frequency or quality factor seen in this plot, only the usual changes in the few hours at the beginning of each lock stretch.  The last plot shows trends of DeltaL / Pcal for the same 48-hour period, comparing C00 to a calibration that additionally corrects for time dependence in fs and Q, as well as kappa_PUM and kappa_UIM.  It is consistent with the result of the previous aLOG comment, showing that compensating for more time dependence consistently improves calibration accuracy.


Quick trend comparing SRC spring freqnuency against BNS range and DRMI power levels.
This will be done much more carefully ... soon.

[J. Kissel, A. Viets]

At Jeff's request, I made time series plots of the SRC optical spring squared frequency with several front-end channels on the same plot, to see which are highly correlated.  Additionally, I've listed (in the same order as the plots) the Pearson correlation coefficients between fs^2 and each other channel.  Note that the correlation is reduced by two effects: first, fs^2 is not computed during lock loss and therefore remains constant, and second, noisy fluctuations (on ~2 minute time scales for fs^2, since that is about how much input data is used to compute each output value) are probably not correlated.

Channel Name                                               Name in Plot                 Correlation Coefficient            Description

H1:LSC-TR_Y_NORM_INMON                        TRY                                -0.07759334                           arm cavity power, normalized to power when the Y arm is locked alone
H1:LSC-TR_X_NORM_INMON                       TRX                                -0.07641386                           arm cavity power, normalized to power when the X arm is locked alone
H1:LSC-POPAIR_B_RF90_I_NORM_MON      POP90                           0.00209429                            45 MHz sidebands inside PRC
H1:LSC-POPAIR_B_RF18_I_NORM_MON      POP18                            0.05289885                            9 MHz sidebands inside PRC
H1:LSC-PR_GAIN_OUT16                              PRG                               -0.0719822                              power recycling gain
H1:LSC-POP_A_LF_OUT16                            POP DC                         -0.09153975                            power inside the PRC
H1:LSC-REFL_A_LP_NORM                           REFL DC                        0.01795835                             power reflected off of the input to PRM
H1:IMC-MC2_TRANS_SUM_OUT16              IMC TRANS                    -0.08331603                           power transmitted from the IMC

By eye, the power recycling gain, the power in both arm cavities, the power in the PRC, seem to be consistently negatively correlated.  So it would appear that the SRC's optical spring frequency is related in some way to the power circulating in the detector.  Note the physical meaning of fs^2 as we have defined it: a positive value indicates an optical anti-spring, and a negative value indicates an optical spring.  Based on these results, more power in the detector => optical spring is less "anti" and more "pro."


The original aLOG entry shows that correcting for time-dependent systematic errors in the sensing function assuming a model with SRC detuning improves calibration accuracy at the lowest Pcal line frequency. Given that we now believe the primary cause of low-frequency time-dependent systematic errors in the sensing function is a parasitic coupling of angular motion sensing to DARM rather than SRC detuning (see G1901353 and LHO aLOG 50992), I wanted to investigate whether correcting for SRC detuning could lead to an overall improvement in calibration accuracy. The short answer is "Well, close to the lowest Pcal line, yes, but not reliably at other frequencies." I used four Y-end Pcal broadband injections (RX channel), and plotted DeltaL / Pcal from 10-400 Hz for two calibrated data sets: one that corrected for all modeled time-dependence except SRC detuning (spring frequency f_s and quality factor Q), and one that additionally includes time-dependent corrections for SRC detuning. In order to get a measurement of all time-dependent correction factors, I started the gstlal calibration pipeline ~1 hour before the broadband injection, since the calibration lines are turned off during the injections. The dates and associated aLOGs are listed below in the same order as the plots:
- 2019-06-12 (LHO aLOG 49857)
- 2019-07-03 (LHO aLOG 50382)
- 2019-07-17 (LHO aLOG 50613)
- 2019-08-01 (LHO aLOG 50966)


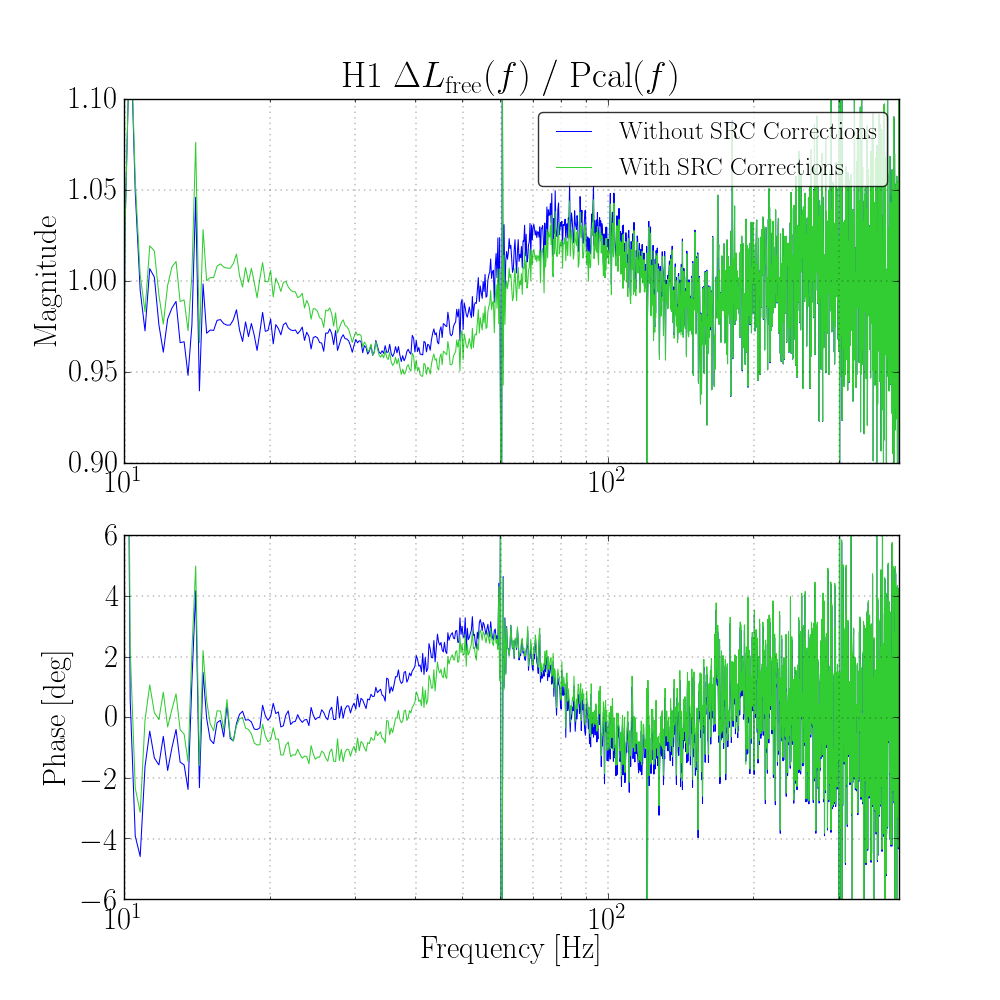

Text files with the data of the plots in the previous comment can be found in the calibration SVN in this directory:
aligocalibration/trunk/Runs/O3/H1/Measurements/FullIFOSensingTFs/
with names like
H1_With_SRC_Corrections_over_CAL-PCALY_RX_PD_OUT_DQ_[GPS_START_TIME]-[DURATION].txt
for data corrected for "SRC detuning" time dependence and names like
H1_Without_SRC_Corrections_over_CAL-PCALY_RX_PD_OUT_DQ_[GPS_START_TIME]-[DURATION].txt
for data that is not.
Since there is now precedent, I've moved and committed the above mentions "DCS analysis of broadband injections" text files in to the DCS_BB_plots/ directory, e.g.
    /ligo/svncommon/CalSVN/aligocalibration/trunk/Runs/O3/H1/Measurements/FullIFOSensingTFs/DCS_BB_plots/
        H1_Without_SRC_Corrections_over_CAL-PCALY_RX_PD_OUT_DQ_1244406526-120.txt
        H1_Without_SRC_Corrections_over_CAL-PCALY_RX_PD_OUT_DQ_1246226240-120.txt
        H1_Without_SRC_Corrections_over_CAL-PCALY_RX_PD_OUT_DQ_1247431237-120.txt
        H1_Without_SRC_Corrections_over_CAL-PCALY_RX_PD_OUT_DQ_1248718240-120.txt
        H1_With_SRC_Corrections_over_CAL-PCALY_RX_PD_OUT_DQ_1244406526-120.txt
        H1_With_SRC_Corrections_over_CAL-PCALY_RX_PD_OUT_DQ_1246226240-120.txt
        H1_With_SRC_Corrections_over_CAL-PCALY_RX_PD_OUT_DQ_1247431237-120.txt
        H1_With_SRC_Corrections_over_CAL-PCALY_RX_PD_OUT_DQ_1248718240-120.txt