aidan.brooks@LIGO.ORG - posted 12:02, Friday 27 September 2019 (52161)
PRG vs input power plot for L1 and H1
Duplicate of LLO aLOG 48796
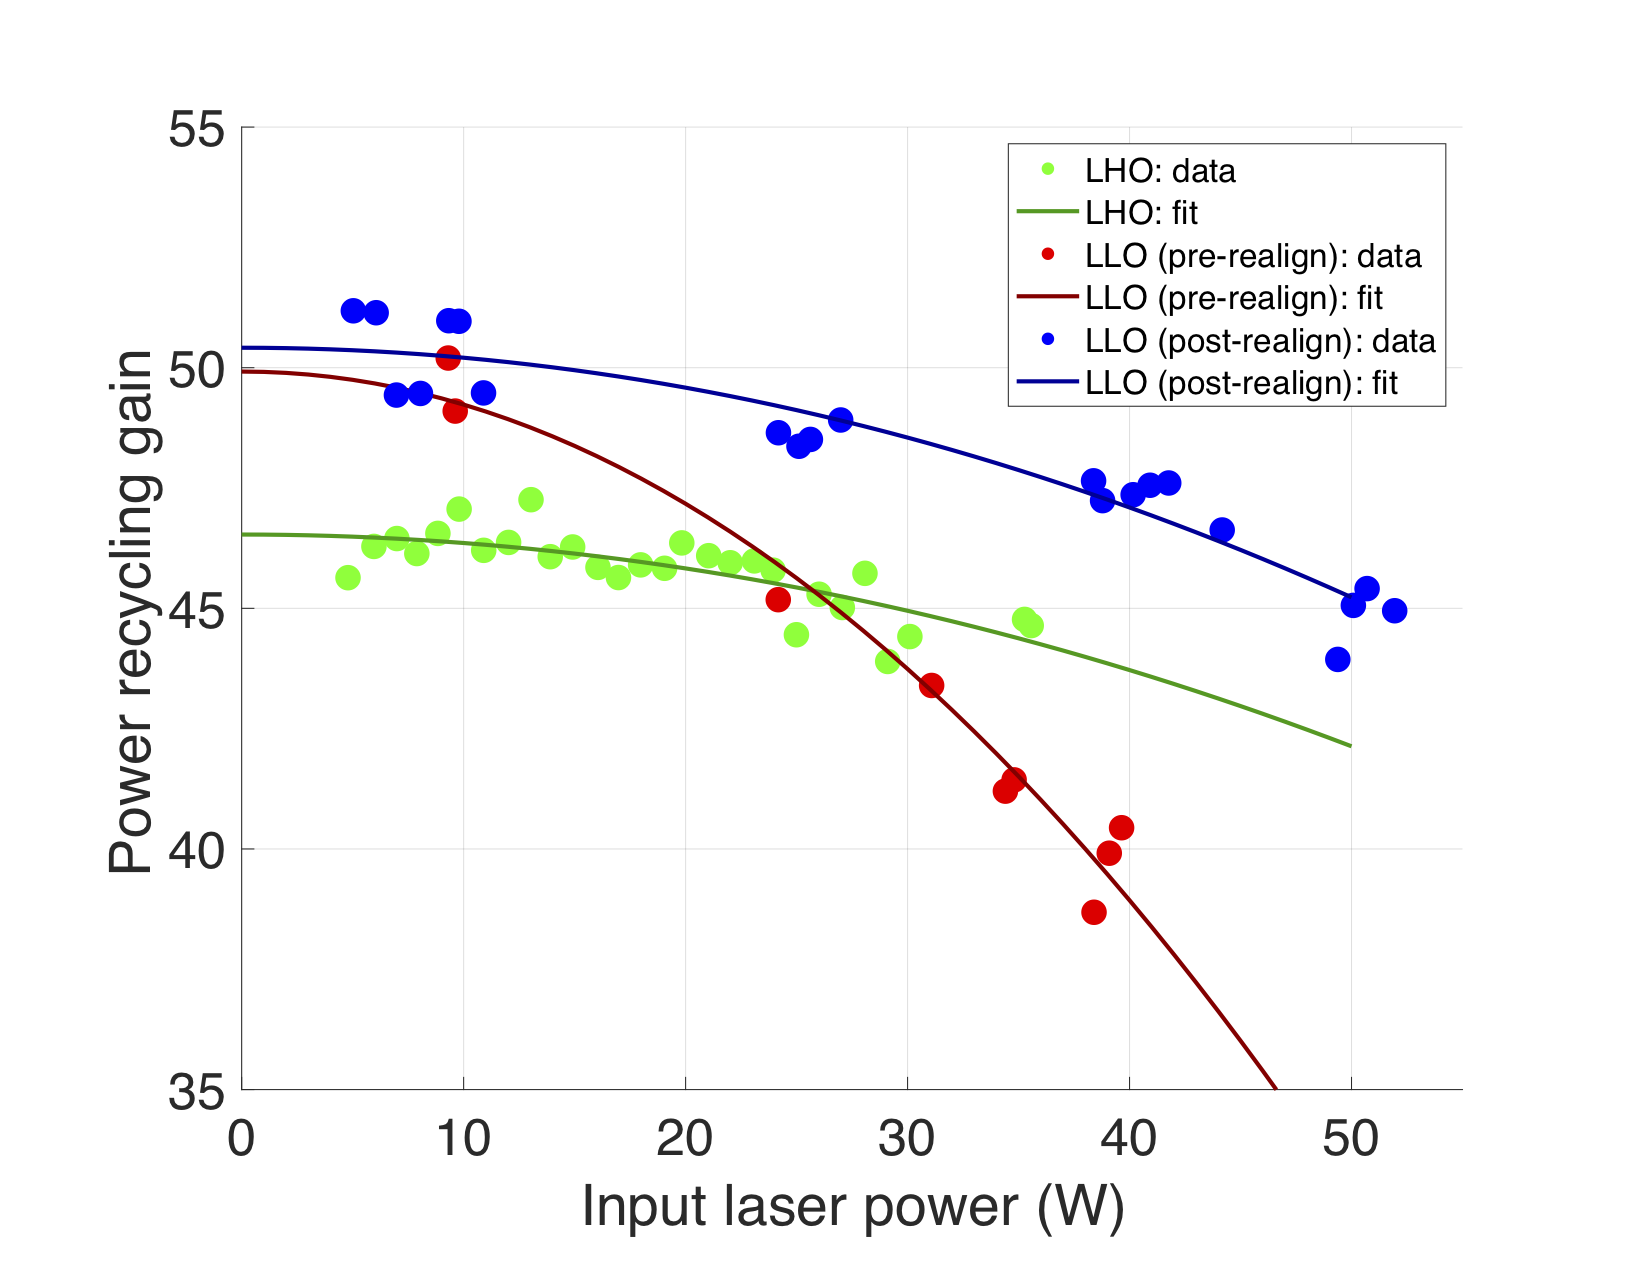
Following Valera's initial PRG v input laser power plot, the attached plot shows the PRG vs input laser power for LLO and LHO averaged over the first four months of this year (with LLO divided into pre 3-Feb realignment and post 3-Feb realignment epochs).
The initial dataset was one-minute averages of PRG and LSR PWR. Then the averaging is done by dividing the x-axis (input laser power) into 1W bin widths and working out all times at which the input laser power fell within a particular bin and then averaging the corresponding PRGs. Each bin required a minimum of 30 entries to qualify as a data point in the final average.
The fitting function is a simple quadratice: F = g0 + a0*P^2
L1:IMC-PWR_IN_OUT16L1:LSC-PRC_GAIN_MONH1:IMC-PWR_IN_OUT_OUT16H1:LSC-PRC_GAIN_OUT16
Images attached to this report
Non-image files attached to this report
