cheryl.vorvick@LIGO.ORG - posted 16:49, Friday 01 November 2019 (52898)
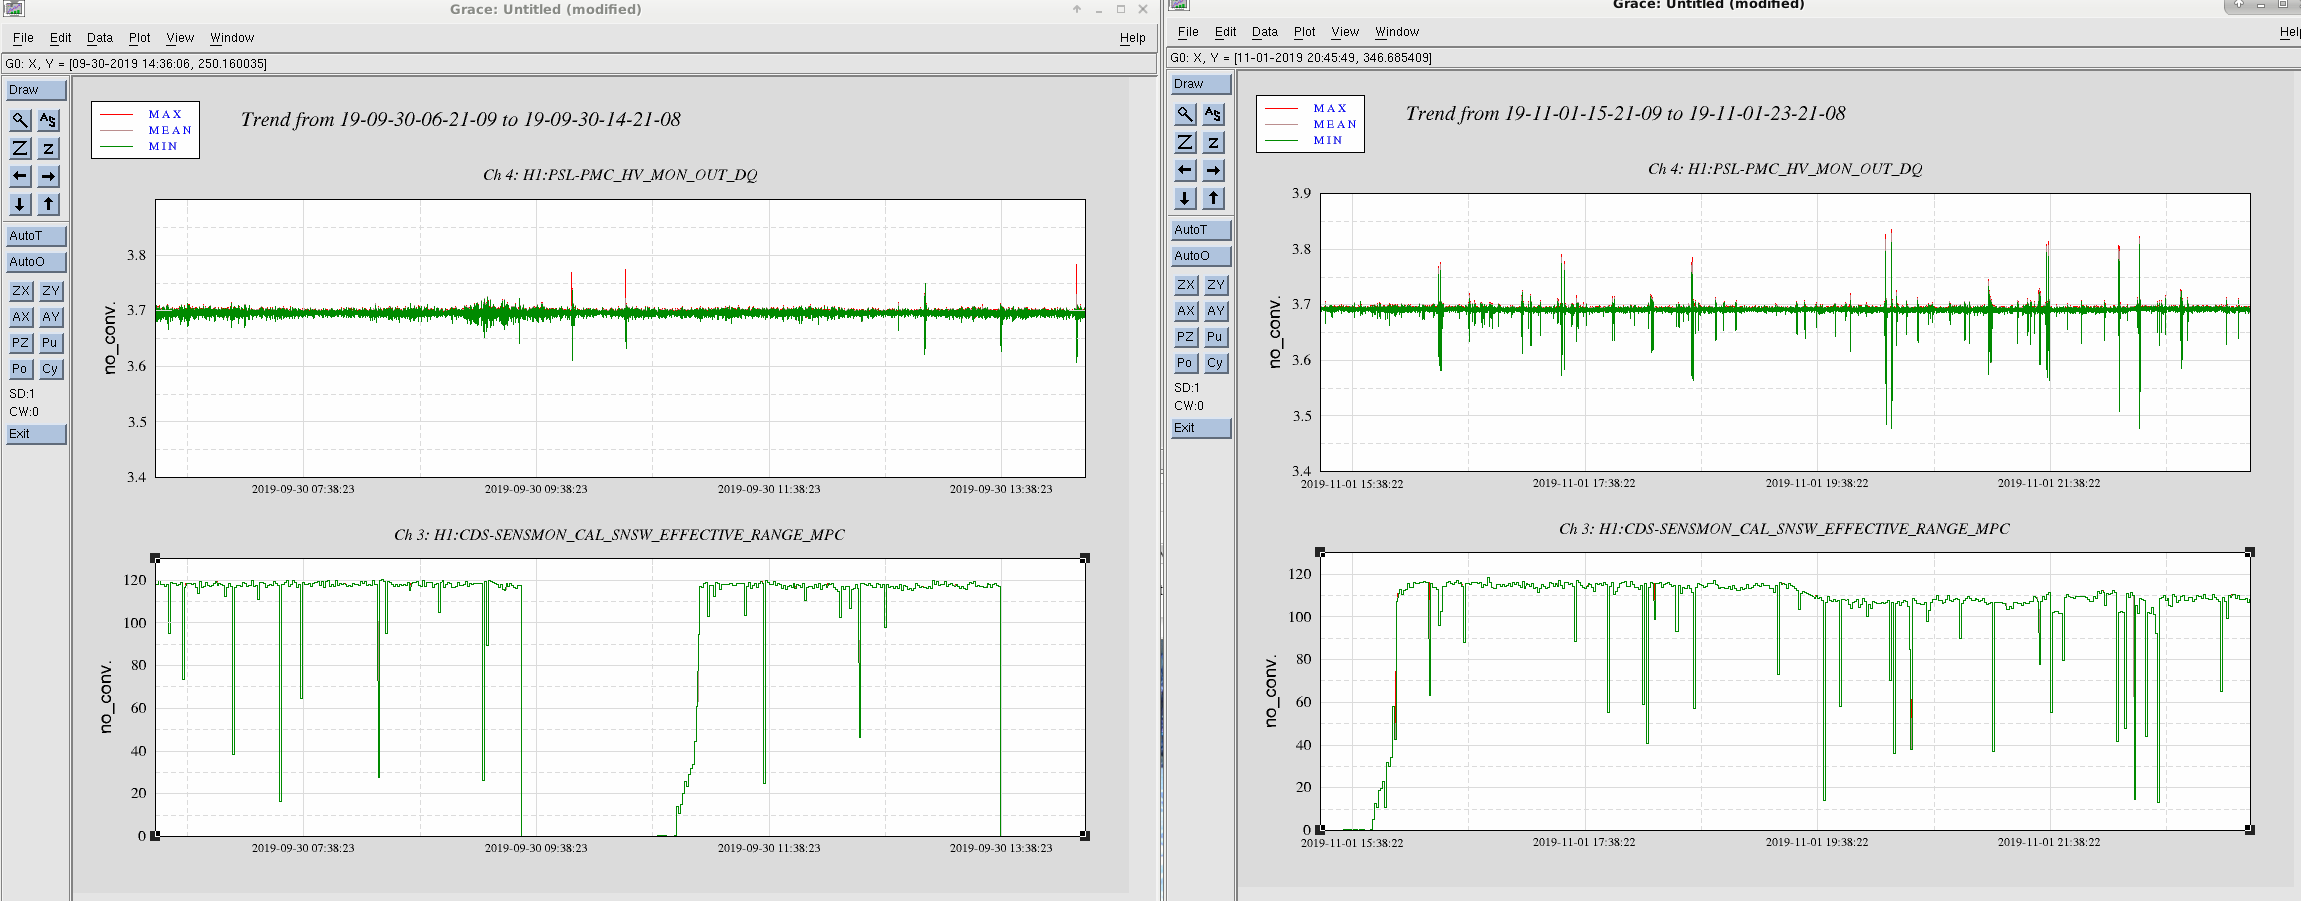
PMC High Voltage differences from September 30 to November 1
8 hours of data in each plot - left = Sept. 30 - right = Nov. 1 - significantly more glitching in Nov. 1 plot
Images attached to this report