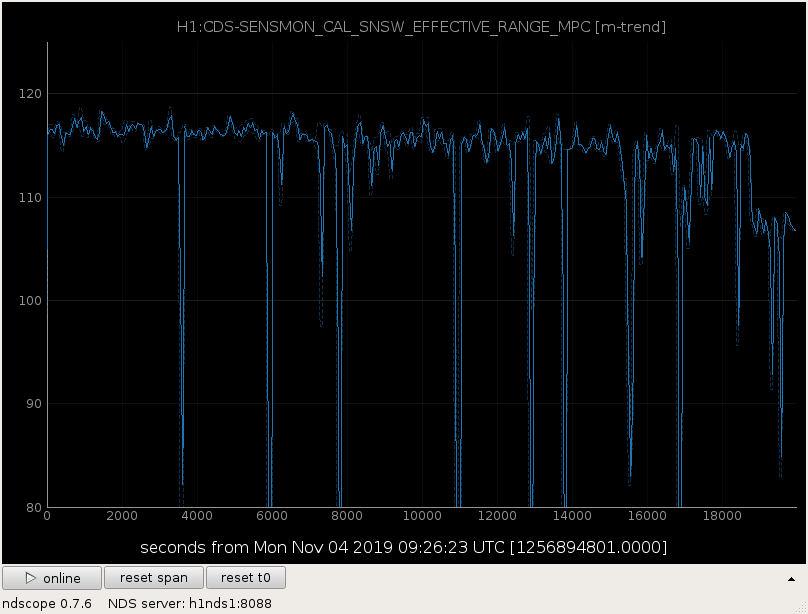
We have been chasing the reason for th3e range drops all day today. Here is another negative:
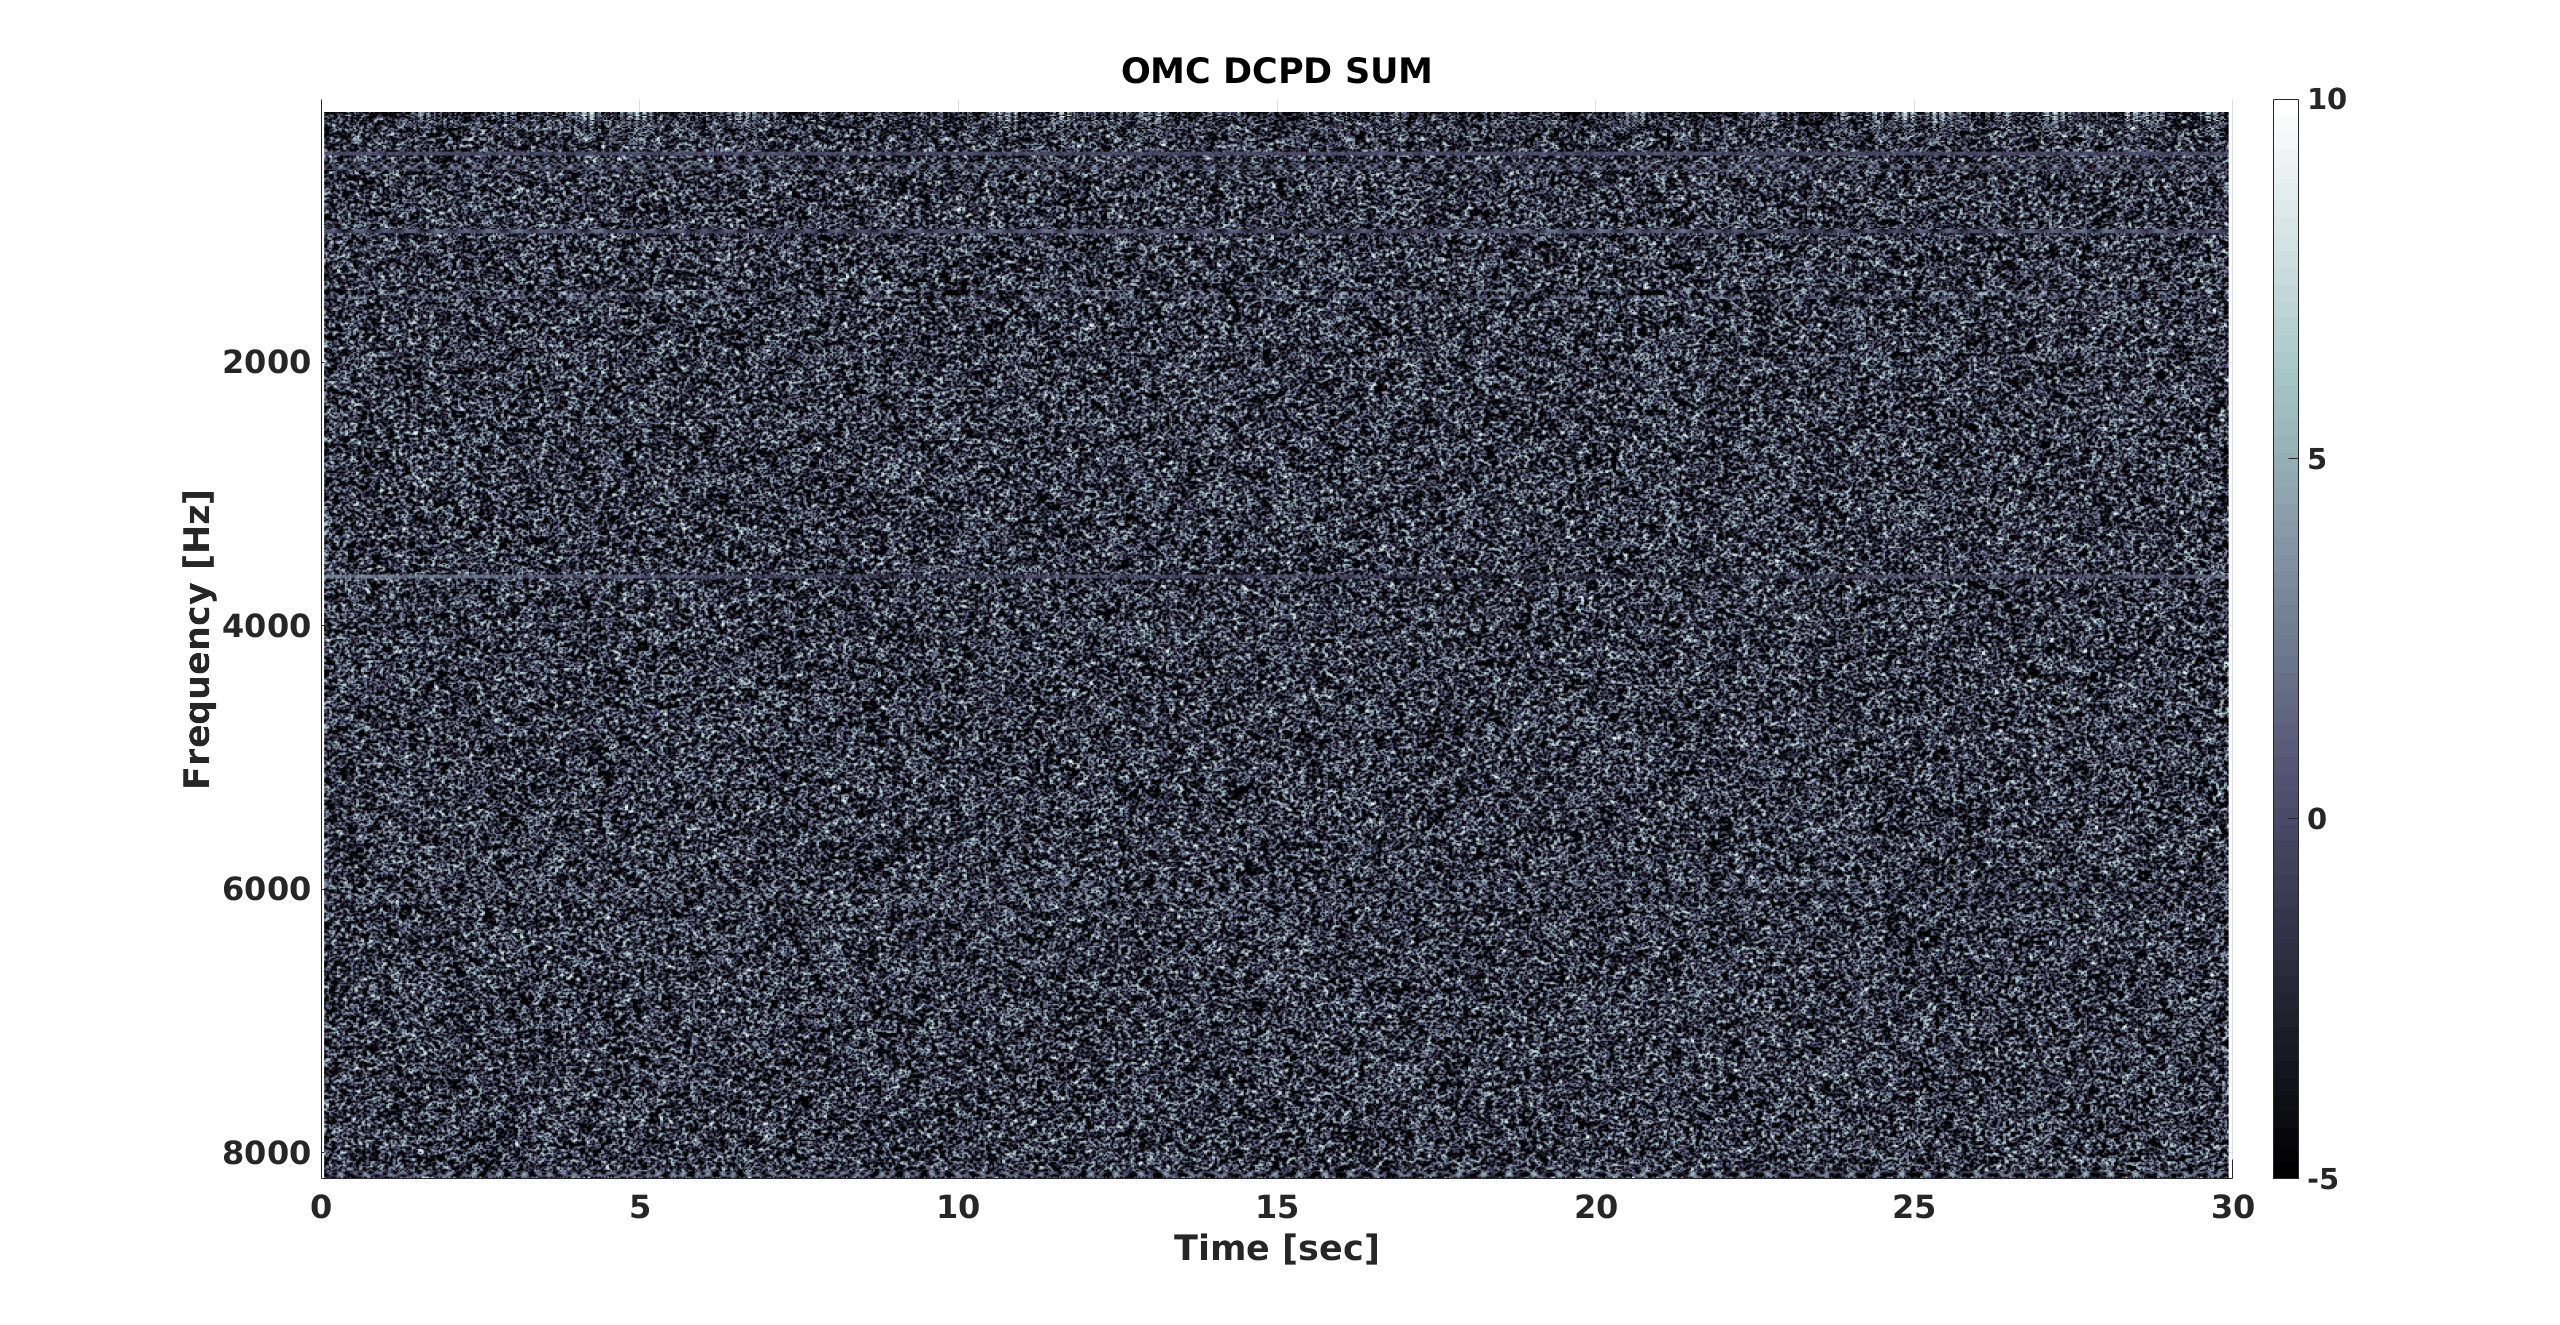
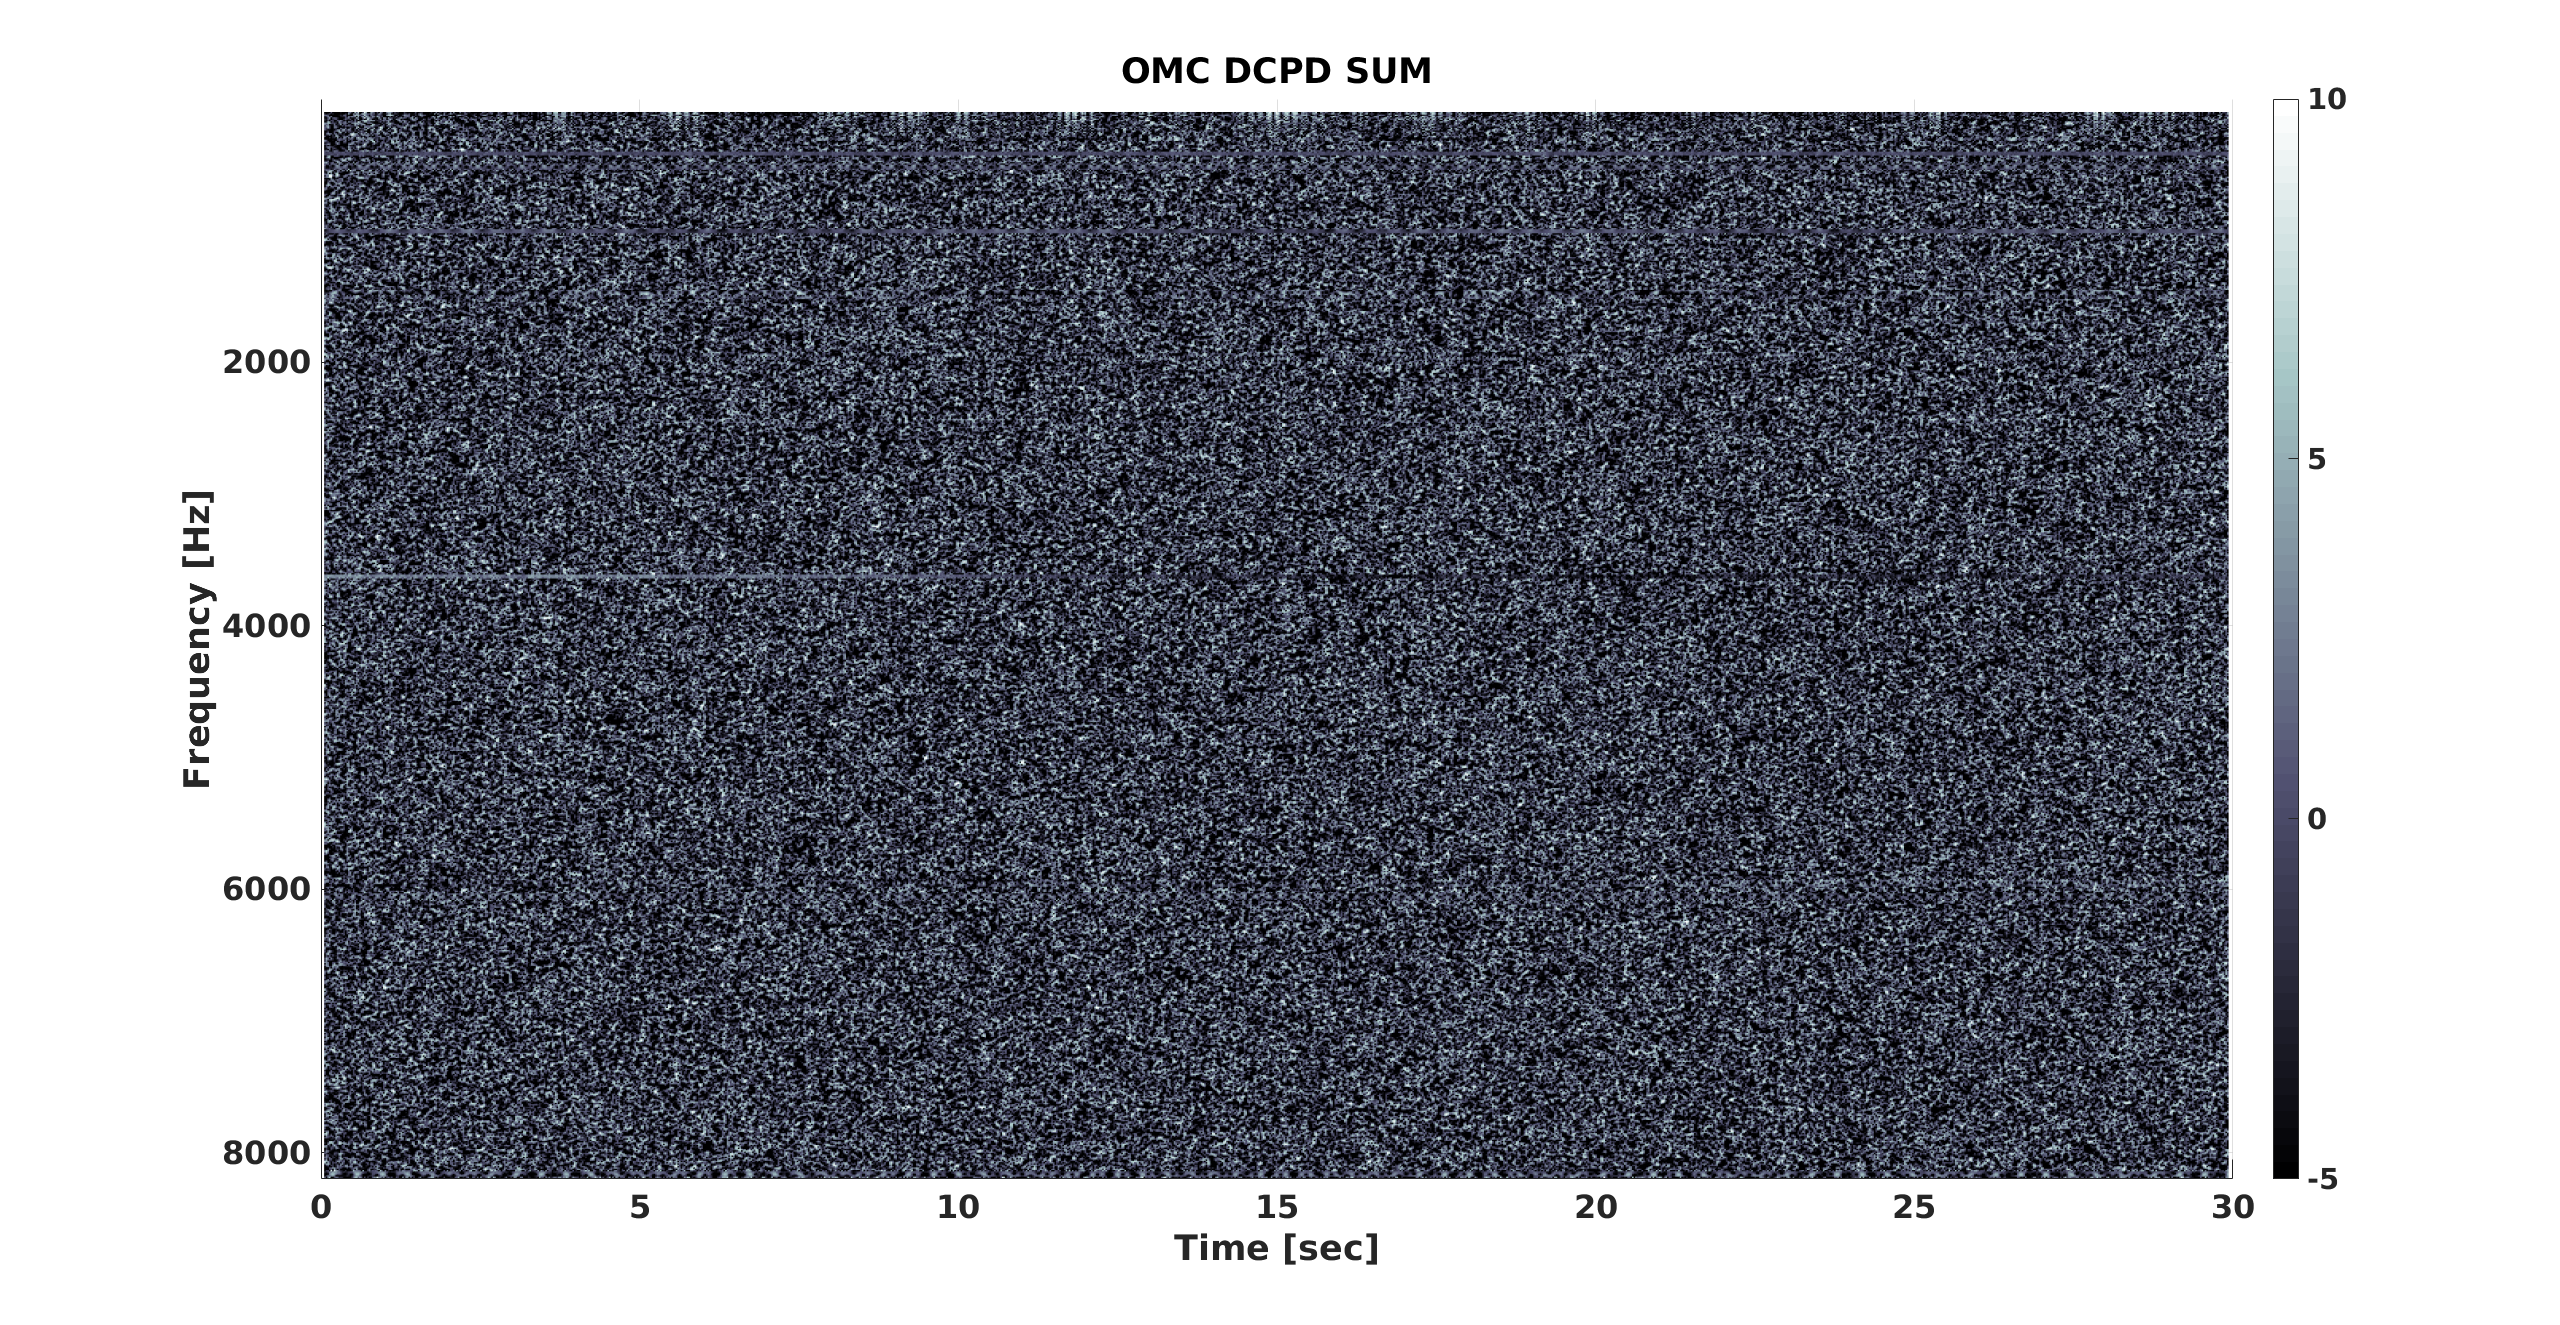
Suspecting something like "microwhistles" I made a 30sec spectrogram before and after the range drop. I don't see any difference in the statistics.
Good: GPS 1256894801
Bad: GPS 1256914735
Plot 1: Range, the date in the spectrogram corresponds to the first 30seconds (good) and the last 30 seconds (bad).
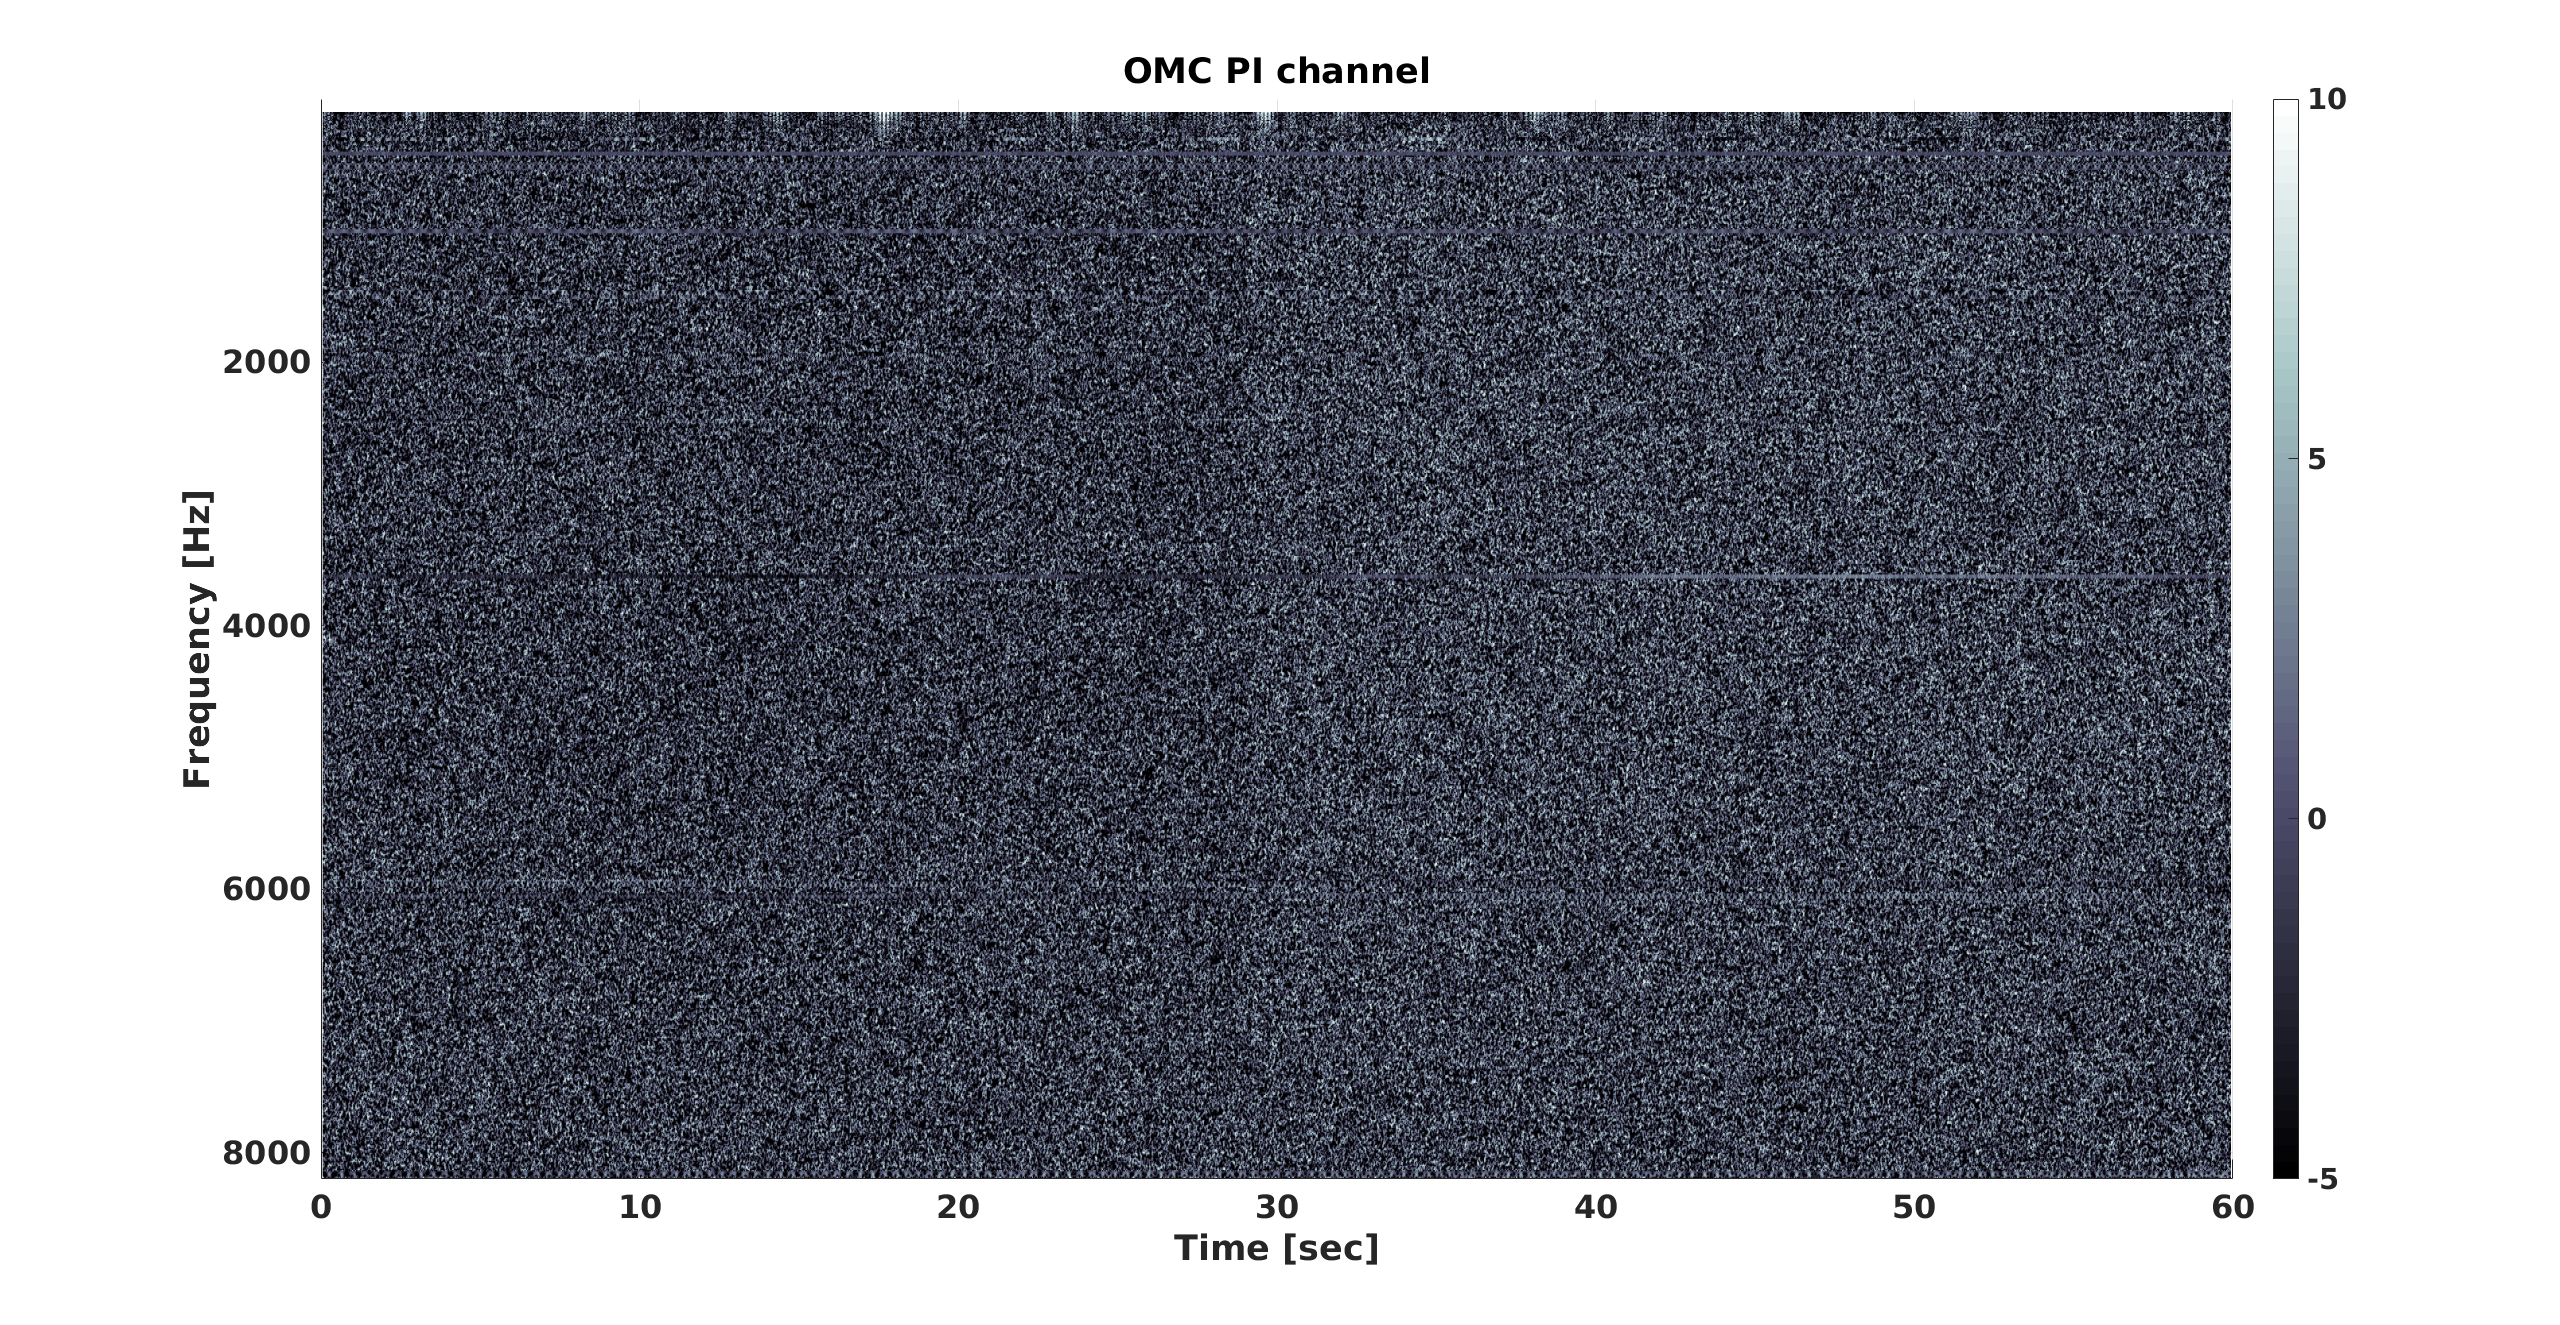
Plot 2: Spectrogram of the good time.
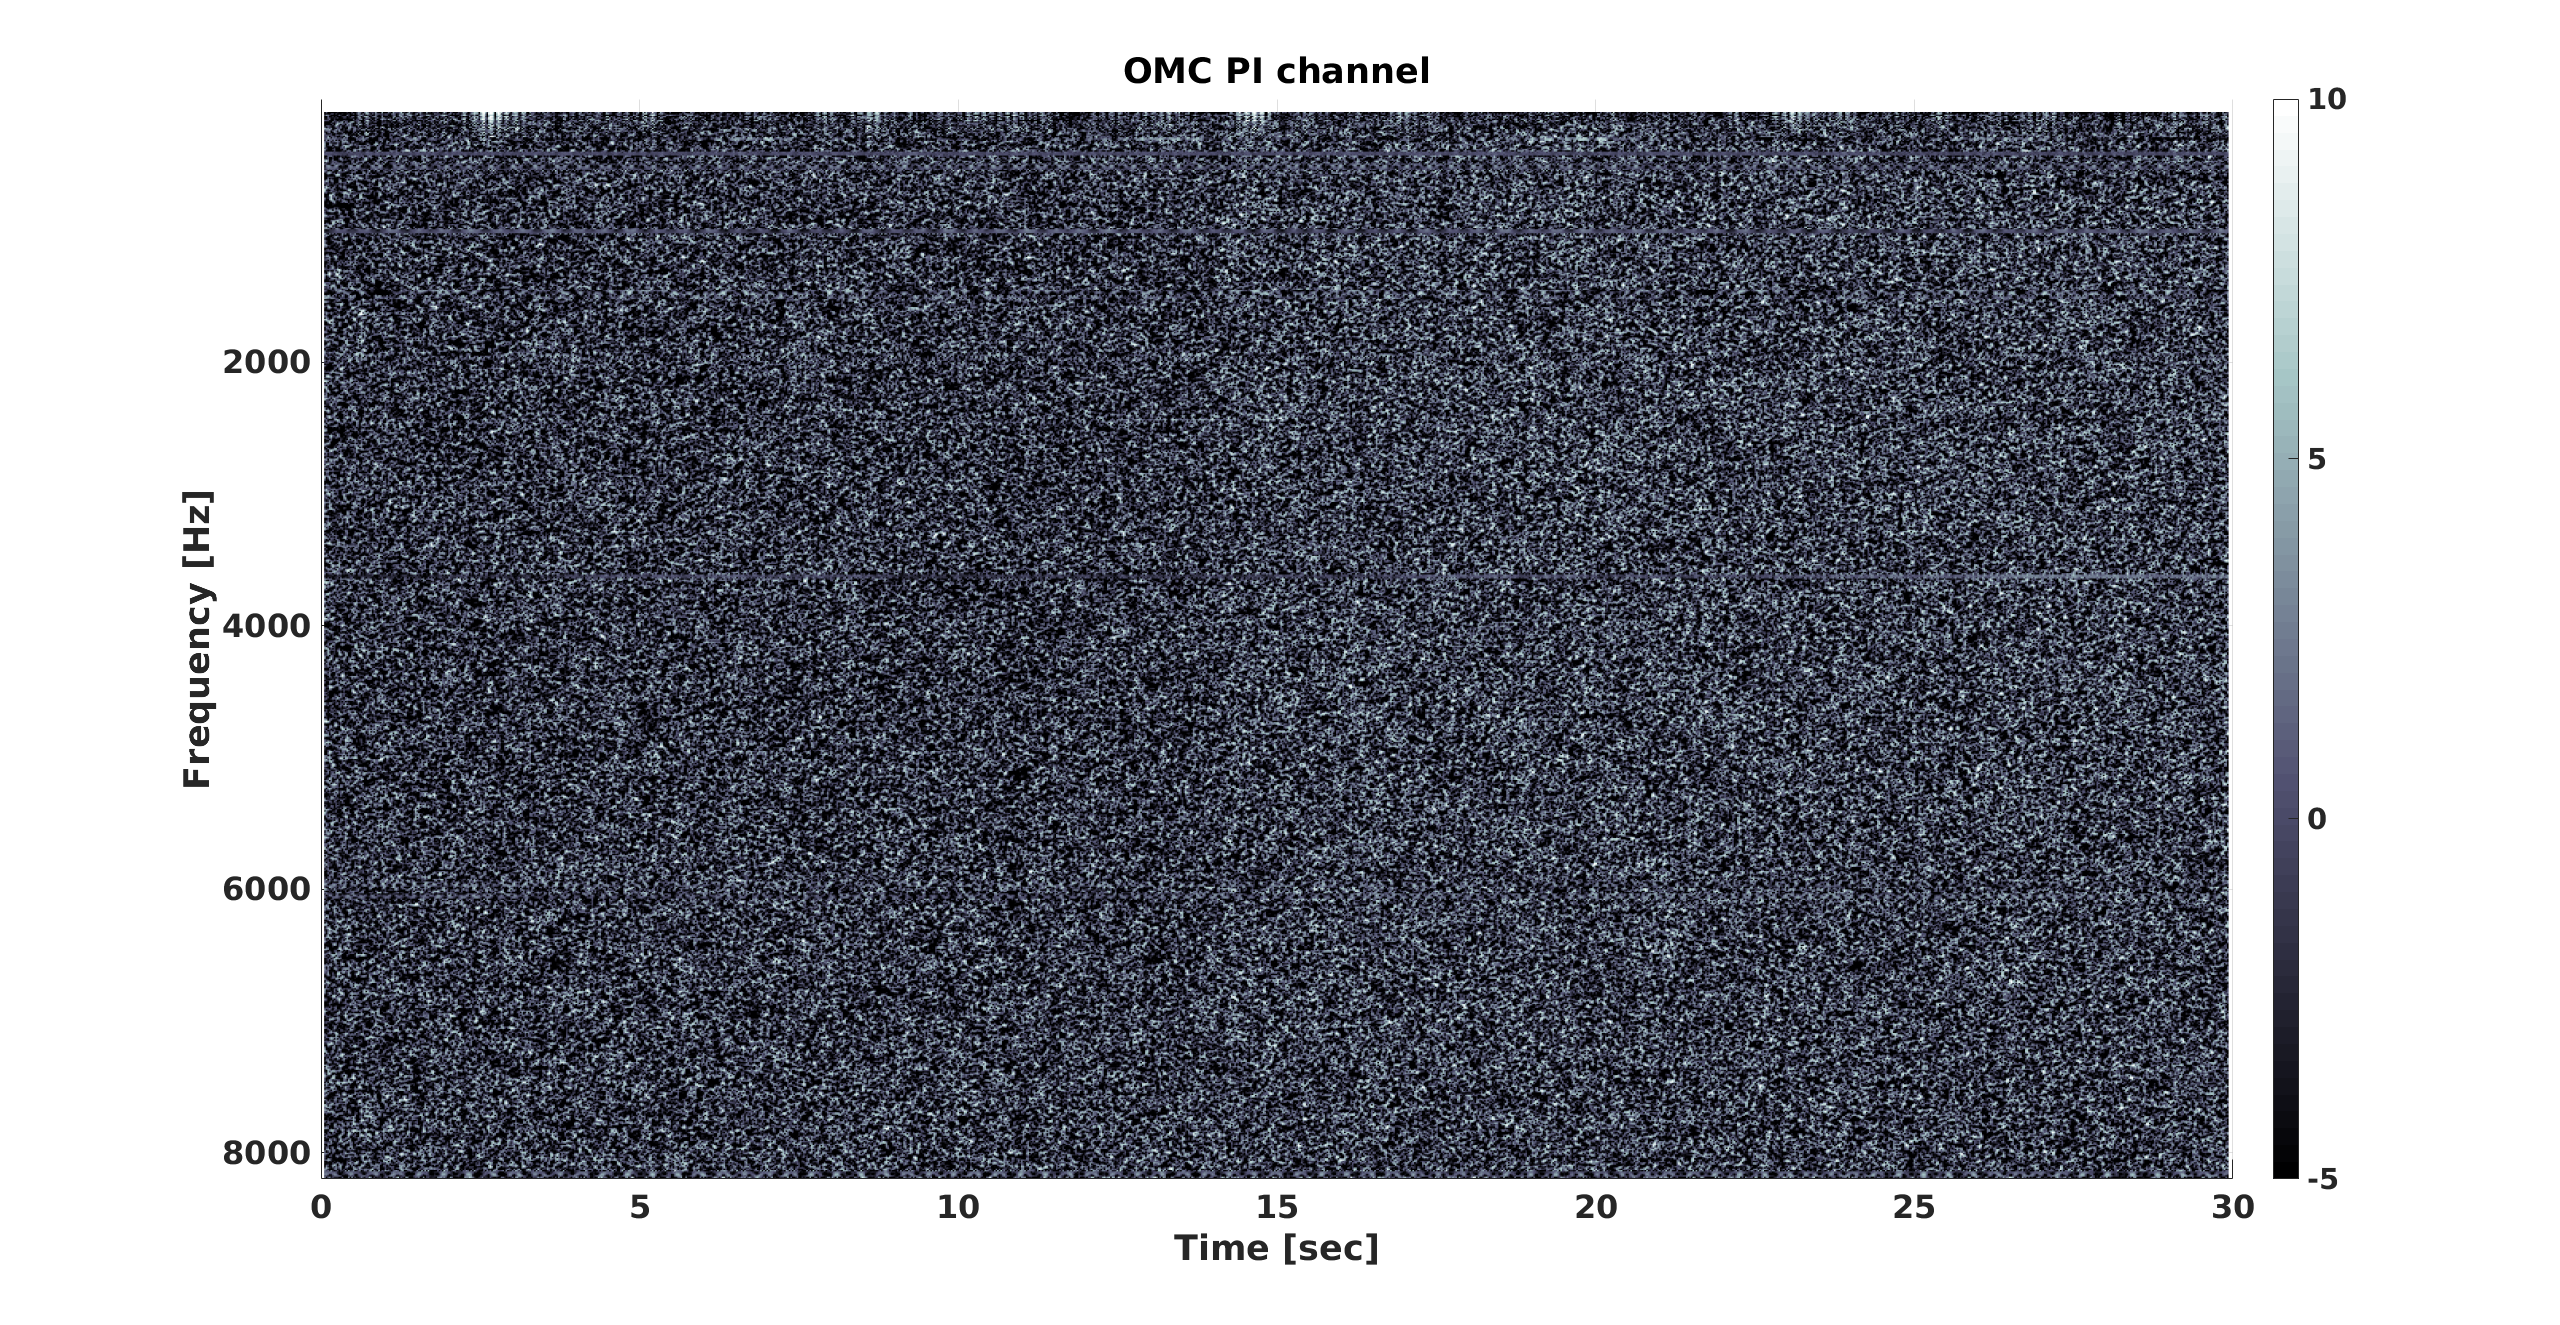
Plot 3: Spectrogram of the bad time.
==============
Plot 4 and plot 5 show spectrogram centered around the range drop at GPS 1256913467. (plot 4 GPS start 1256913437, plot 5 GPS start 1256913452,)
Note the slight increase in the noise level, but no associated pattern whatsoever. The range indeed dropped within 1 second.
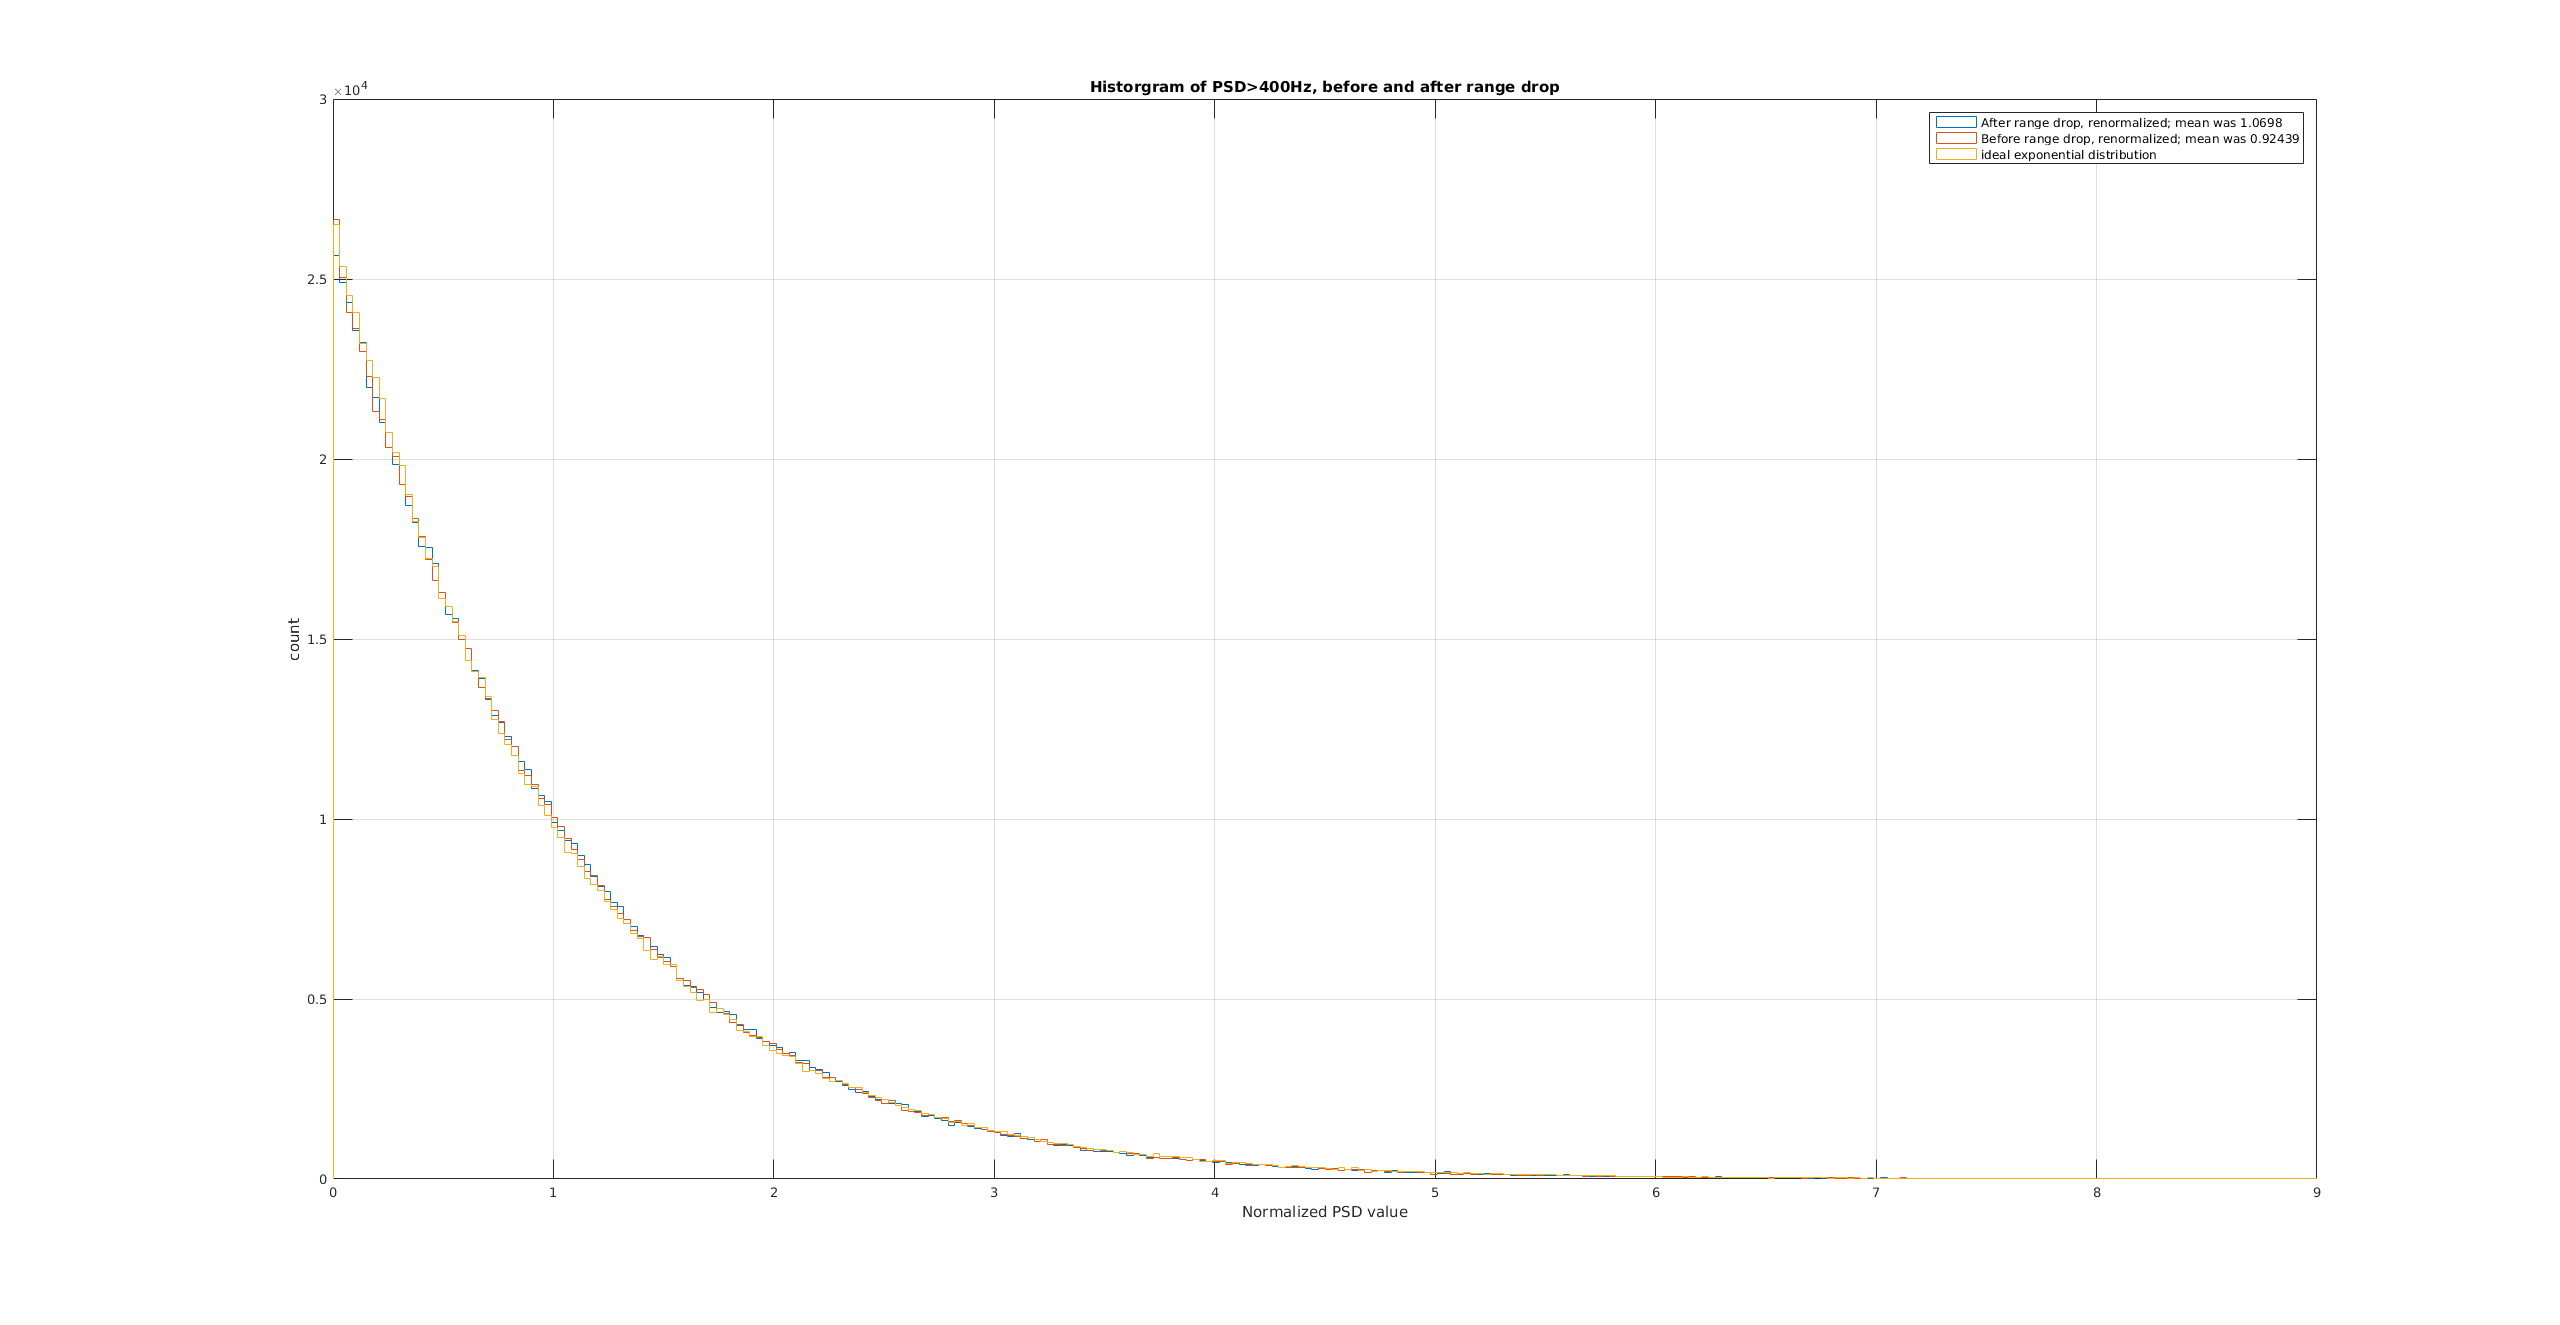
Finally, plot 6 shows histograms of the PSD values before and after the range drop, renormalizing with the mean. Both histograms are indistingushable from an exponmential distribution.
Daniel, Stefan
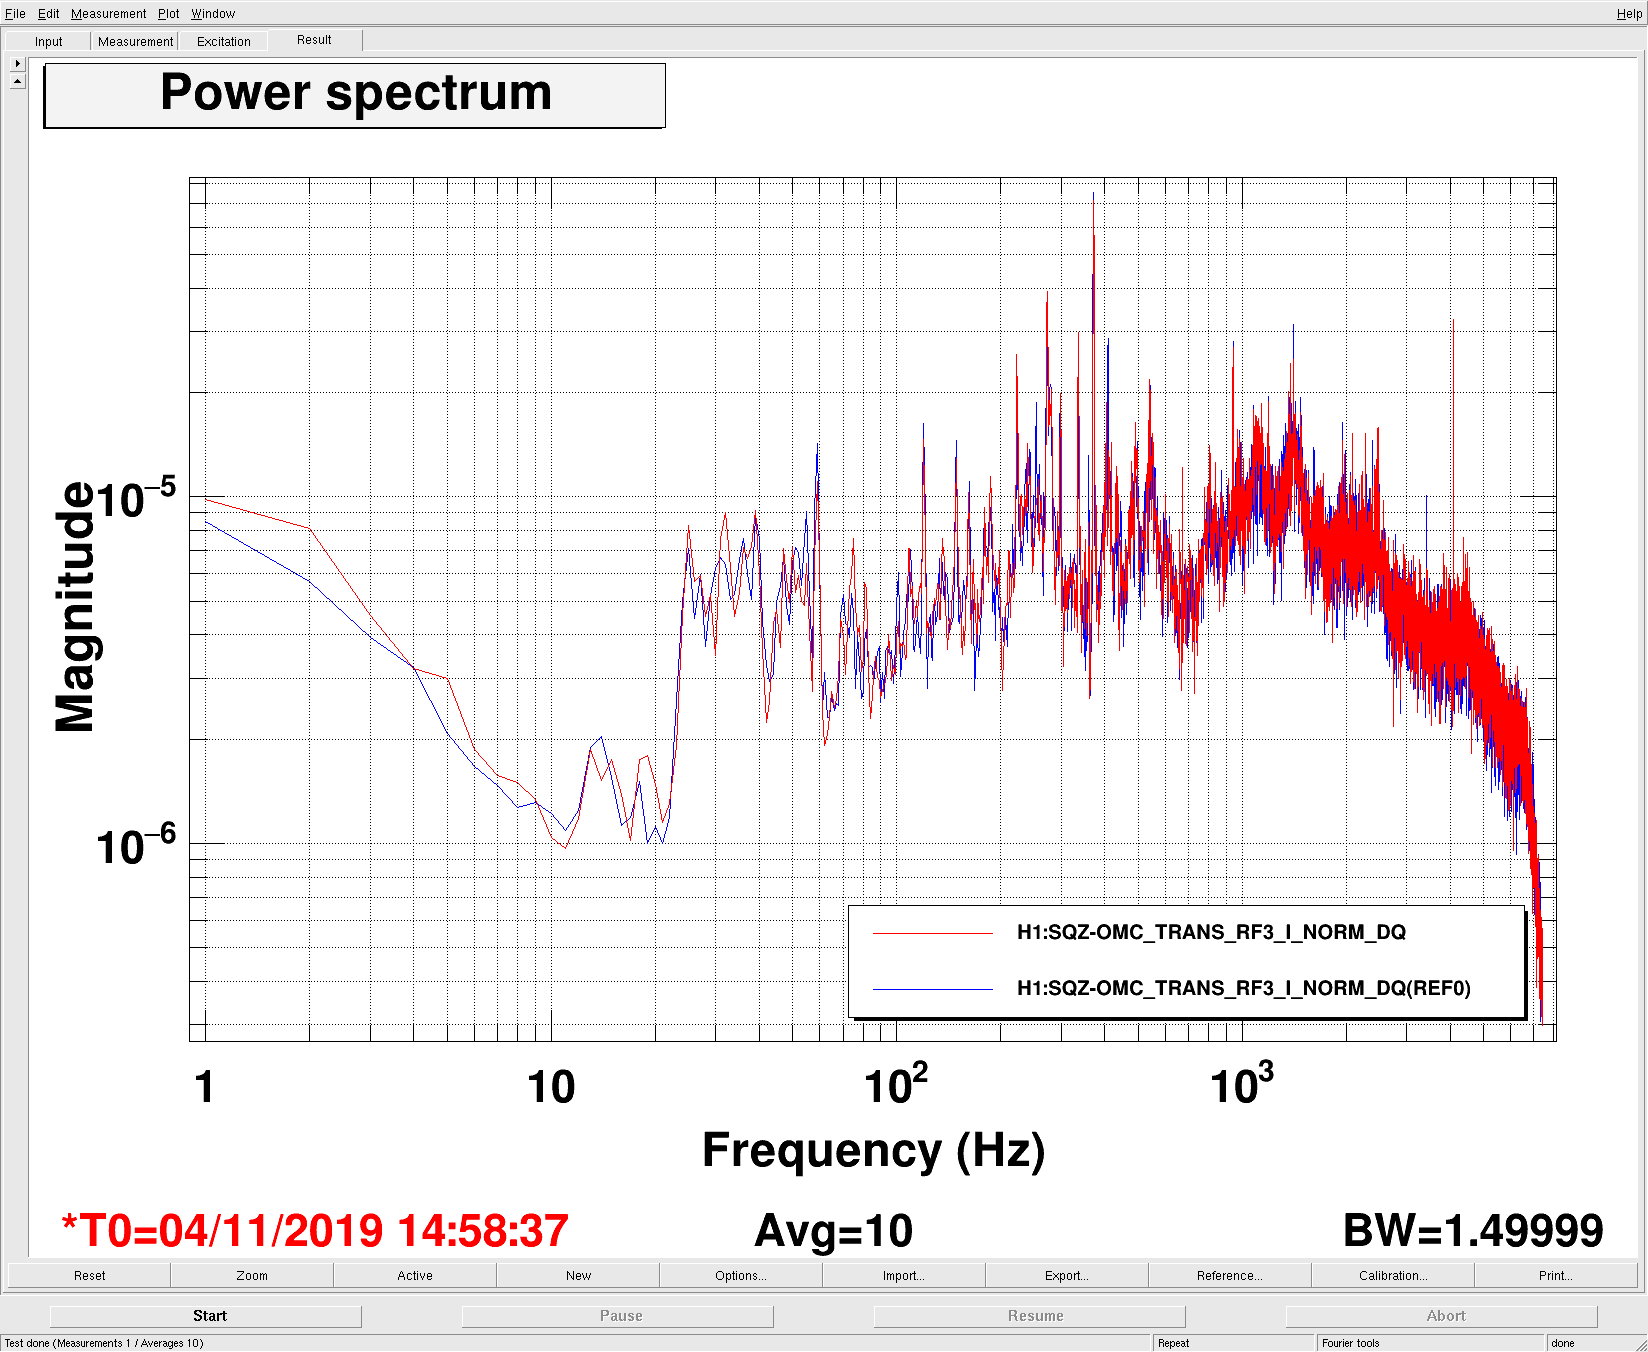
Suspecting some excess phase noise in the squeezer phase locking loop, we bade spectra of the error point for the same good and bad times.
They look the same. Yet another null result...
(That technically does not rule out excess phased noise above the Nyquist frequency.)