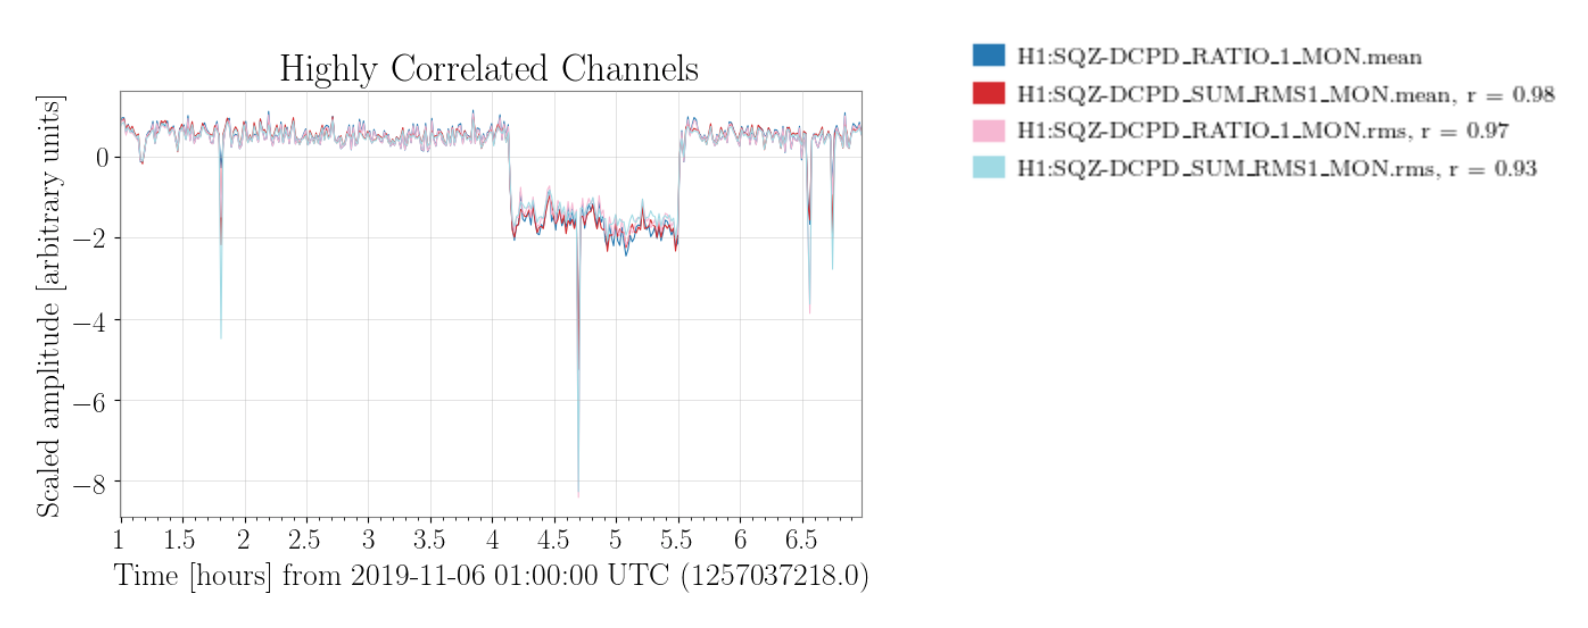
Following up on work by Beverly, I ran a short Lasso run on today's range drop. The run spans 2019-11-06 02:00-07:00. Clearly very highly correlated channels are as follows:
Channel "Pearson Coefficient"
0.9799929848627831 H1:SQZ-DCPD_SUM_RMS1_MON.mean
0.9725502574463882 H1:SQZ-DCPD_RATIO_1_MON.rms
0.9312747855964804 H1:SQZ-DCPD_SUM_RMS1_MON.rms
The full page output is at https://ldas-jobs.ligo-wa.caltech.edu/~jrsmith/detchar/O3b/lasso-Nov-6-2019-2/ (updated using the fancy new python 3 version)
Figures below show:
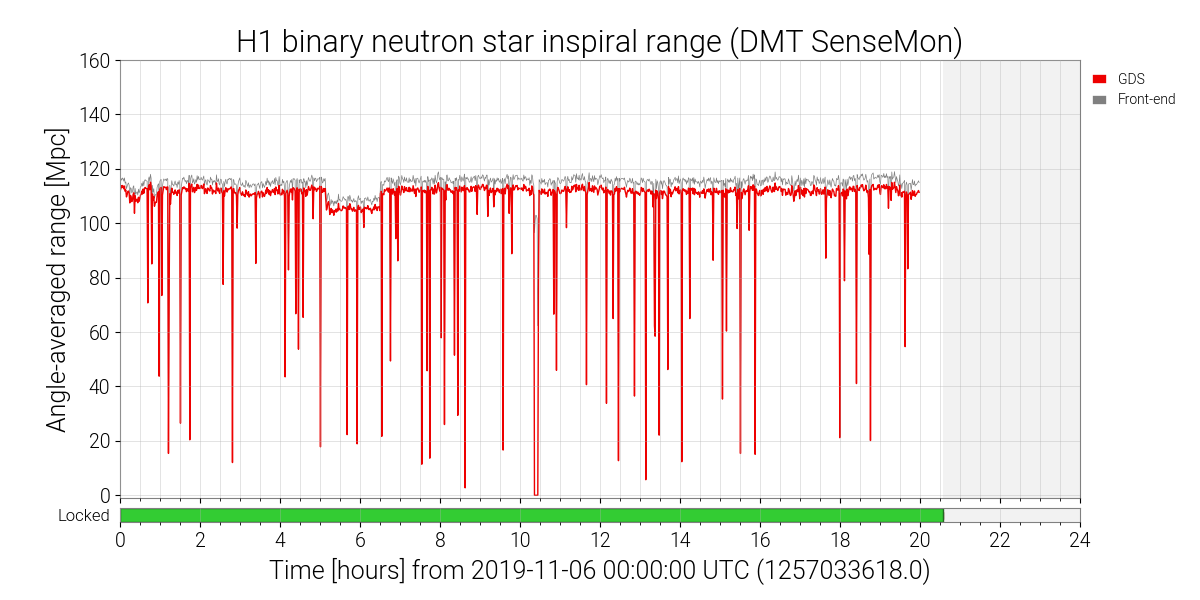
1) The range drop from the summary pages.
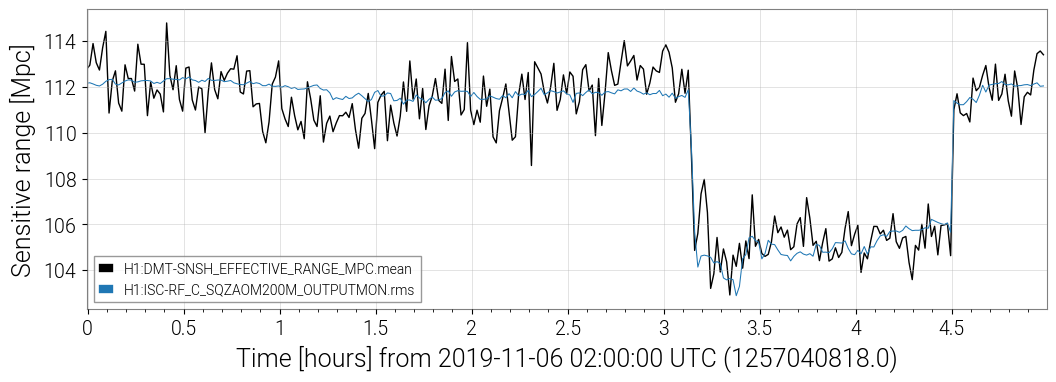
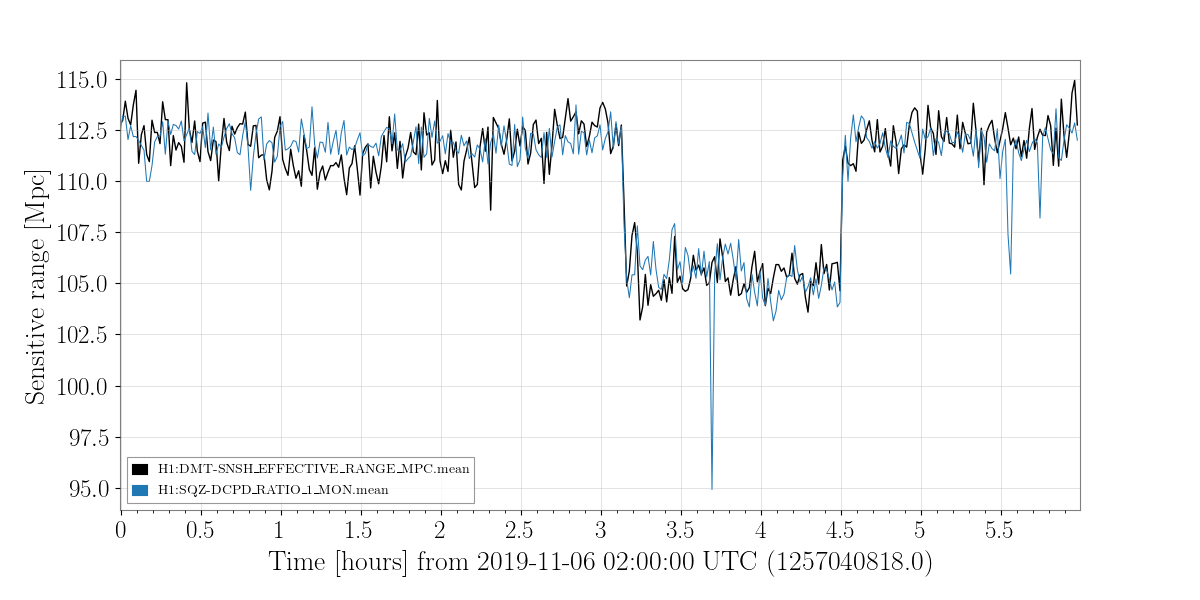
2) The range and scaled SQZ DCPD channel
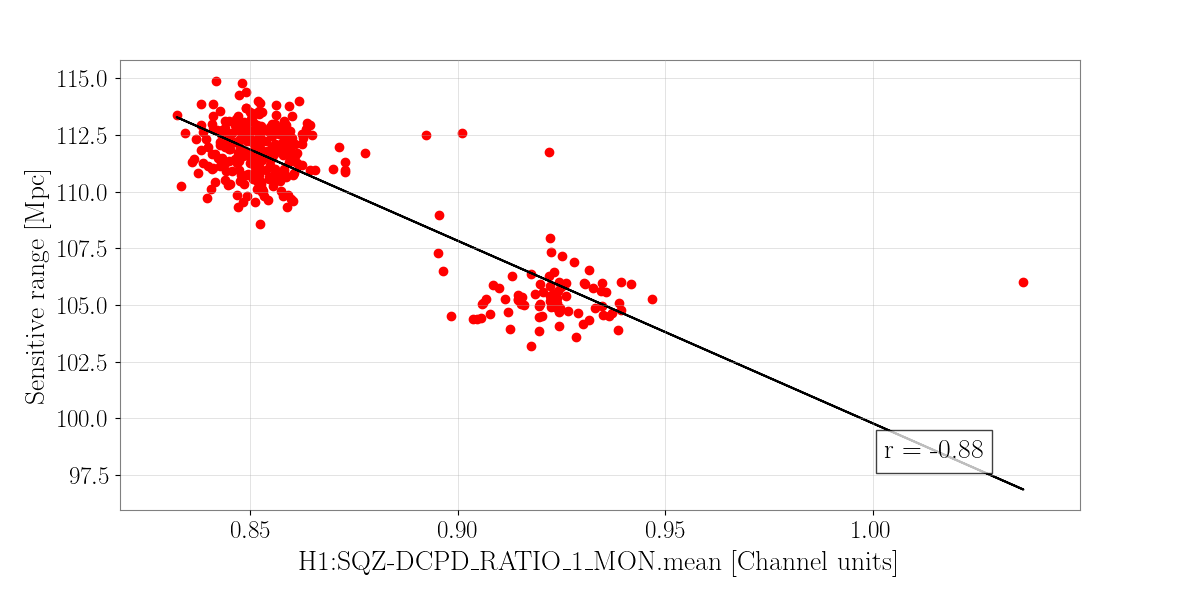
3) A scatter plot of range vs SQZ values
4) The other channels that are duplicate of the SQZ winner
I think not much new from what Beverly reported so far. Happy to follow up with further inquiries.
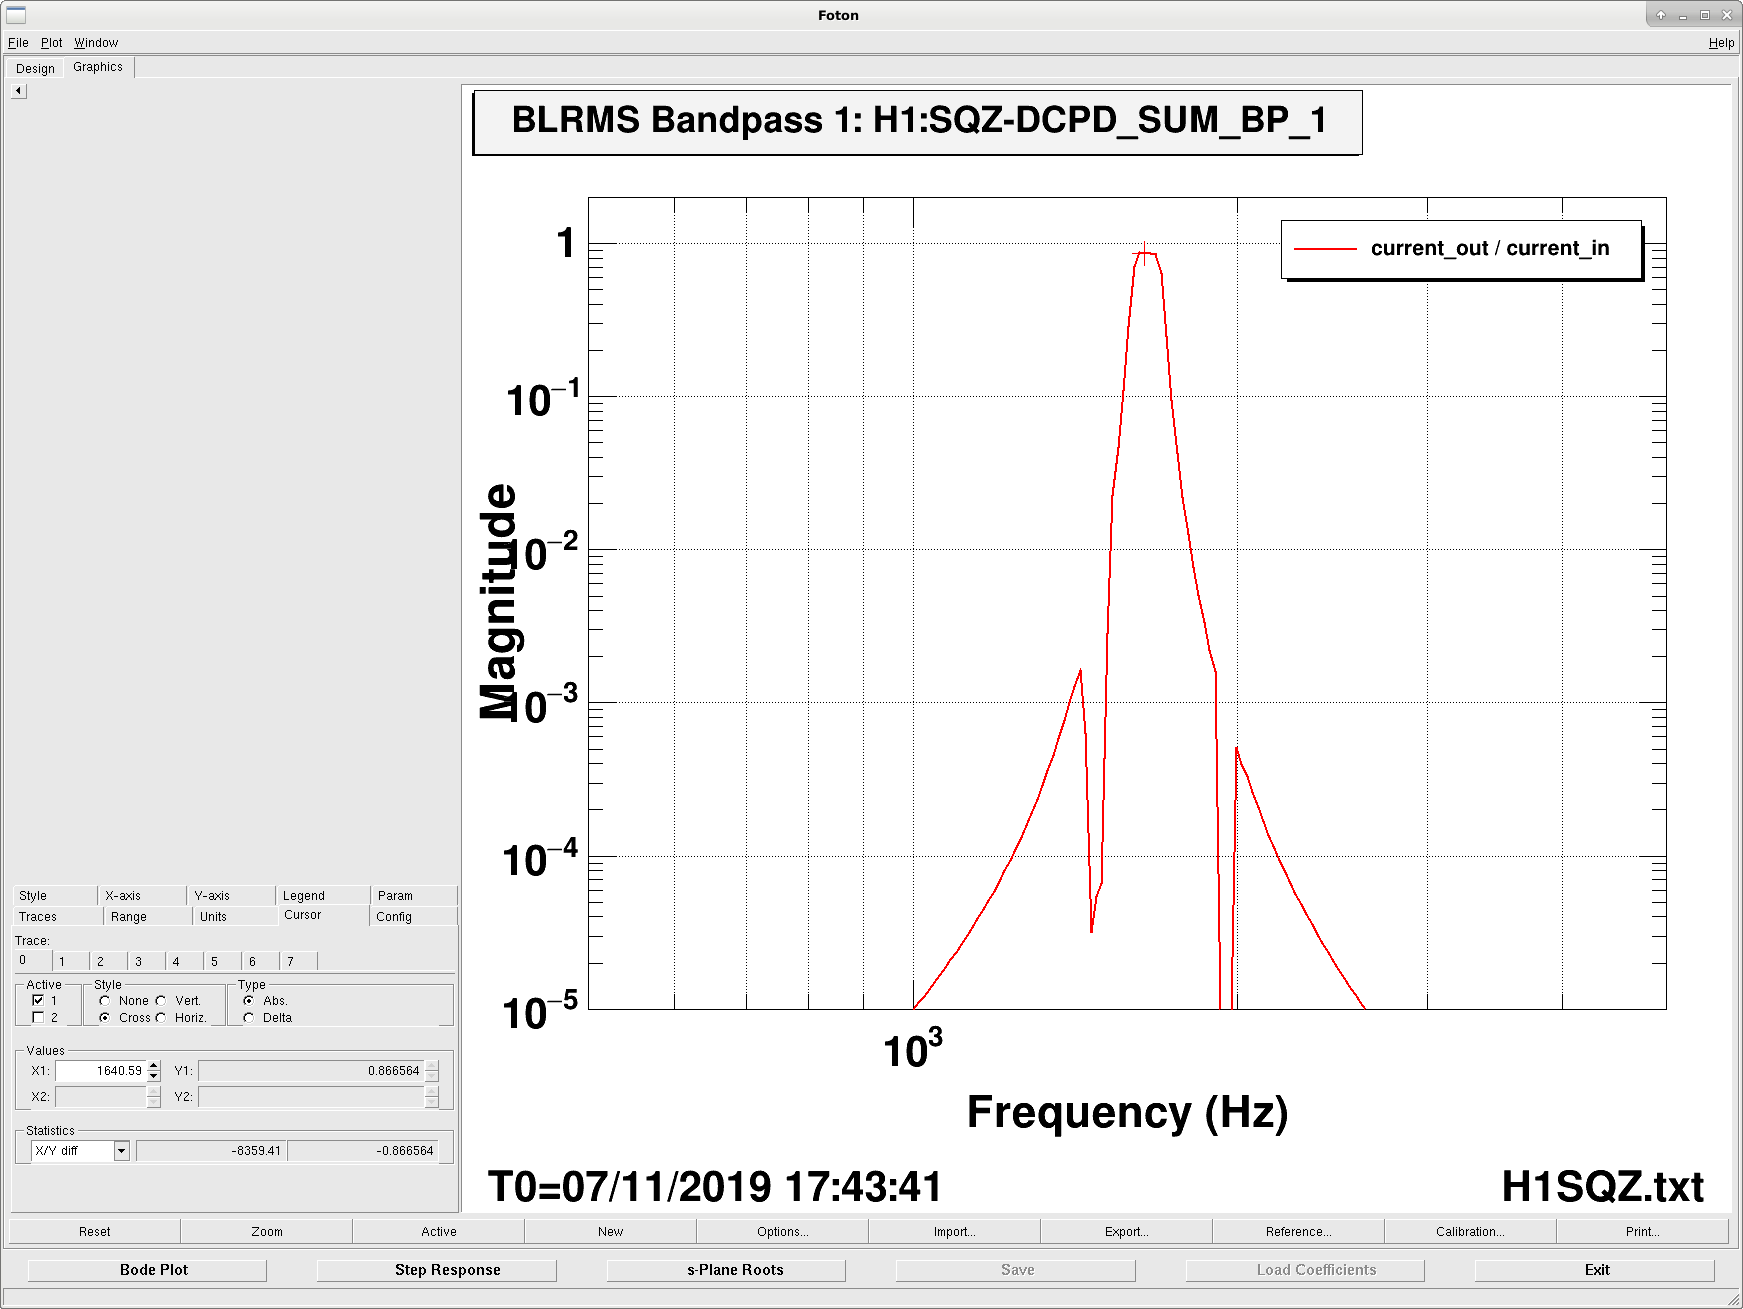
@DetChar -- these channels contain DARM / DELTAL / h(t) in them. They're BLRMS monitor channels comparing the squeezer performance (SQZ; via the NULL stream [the "difference" between OMC DCPDA and B]) against the OMC's DCPD SUM (i.e. the gravitational wave detecting photodiodes, and the DARM loop error signal).

The first band (i.e. what eventually forms H1:SQZ-DCPD_SUM_RMS1_MON, and then H1:SQZ-DCPD_RATIO_1_MON), is a tight band pass around 1640 Hz -- the frequency region simply chosen to be a region we believe to be "shot/quantum noise dominated with no features."

There are 4 of these BLRMS data streams, and they should probably just be considered "unsafe" as copies of the gravitational wave channels.


H1:SQZ-DCPD_NULL_BP_1_INMON  (**and other associated EPICs records on similar name, but with the standard filter module suffixes; OUTMON, EXCMON, OFFSET, etc.)
H1:SQZ-DCPD_NULL_BP_2_INMON   **
H1:SQZ-DCPD_NULL_BP_3_INMON  **
H1:SQZ-DCPD_NULL_BP_4_INMON   **
H1:SQZ-DCPD_NULL_LP_1_INMON  **
H1:SQZ-DCPD_NULL_LP_2_INMON   **
H1:SQZ-DCPD_NULL_LP_3_INMON  **
H1:SQZ-DCPD_NULL_LP_4_INMON   **
H1:SQZ-DCPD_NULL_RMS1_MON
H1:SQZ-DCPD_NULL_RMS2_MON
H1:SQZ-DCPD_NULL_RMS3_MON
H1:SQZ-DCPD_NULL_RMS4_MON
H1:SQZ-DCPD_RATIO_1_DB_MON
H1:SQZ-DCPD_RATIO_1_MON
H1:SQZ-DCPD_RATIO_2_DB_MON
H1:SQZ-DCPD_RATIO_2_MON
H1:SQZ-DCPD_RATIO_3_DB_MON
H1:SQZ-DCPD_RATIO_3_MON
H1:SQZ-DCPD_RATIO_4_DB_MON
H1:SQZ-DCPD_RATIO_4_MON
H1:SQZ-DCPD_SUM_BP_1_INMON **
H1:SQZ-DCPD_SUM_BP_2_INMON  **
H1:SQZ-DCPD_SUM_BP_3_INMON **
H1:SQZ-DCPD_SUM_BP_4_INMON  **
H1:SQZ-DCPD_SUM_LP_1_INMON **
H1:SQZ-DCPD_SUM_LP_2_INMON  **
H1:SQZ-DCPD_SUM_LP_3_INMON **
H1:SQZ-DCPD_SUM_LP_4_INMON  **
H1:SQZ-DCPD_SUM_RMS1_MON
H1:SQZ-DCPD_SUM_RMS2_MON
H1:SQZ-DCPD_SUM_RMS3_MON
H1:SQZ-DCPD_SUM_RMS4_MON
Thank you very much Jeff. We have taken steps to remove all {IFO}:SQZ-DCPD_ channels for future lasso runs. However, it also occured to me that lasso was updated to by default not consider channels that don't change in the first ten minutes of its run. This is not a good way to catch changes in the middle of a segment. So I generated a full channel list by hand using:
(ligo-summary-3.7) [joshua.smith@ldas-pcdev1 lasso-Nov-6-2019-4]$ gw_data_find -o H -t H1_T -u file -s 1257040818 -e 1257040918 -n | xargs FrChannels | egrep -v "OAF-RANGE|CDS-SENSEMON|CAL-CS_DARM|SQZ-DCPD_|SUS-*TM*MODE*" | egrep ".mean|.rms" | cut -d\ -f1 > chans.txt
and ran lasso on this much longer channel list.
(ligo-summary-3.7) [joshua.smith@ldas-pcdev1 lasso-Nov-6-2019-4]$ nohup gwdetchar-lasso-correlation -i H1 -f chans.txt -T minute -a 0.2 -O 2.5 -J 16 -j 16 1257040818 1257058818 &
The results are here: https://ldas-jobs.ligo-wa.caltech.edu/~jrsmith/detchar/O3b/lasso-Nov-6-2019-4/
Conclusion: This points to H1:ISC-RF_C_SQZAOM200M_OUTPUTMON as the most highly correlated. But also has a list of channels highly correlated to that one, which I've pasted below. I am posting this hastily, as I have to run, so I am sorry, again I have not investigated these channels as a follow up yet, but I thought it could be helpful for commissioners to see the updated list.
|
Channel |
Pearson Coefficient |
|
-0.9999996566205920 |
H1:ISC-RF_C_SQZAOM200M_OUTPUTMON.mean |
|
-0.9330572847583630 |
H1:OMC-LSC_I_OUT_DQ.rms |
|
0.8875620058071610 |
H1:ASC-OMCR_B_PIT_OUT_DQ.mean |
|
0.887557437214179 |
H1:ASC-OMCR_B_MTRX_P_OUTMON.mean |
|
0.8875548329386750 |
H1:ASC-OMCR_B_PIT_OUT16.mean |
|
0.8875269357613680 |
H1:ASC-OMCR_B_PIT_INMON.mean |
|
0.8875269357613680 |
H1:ASC-OMCR_B_PIT_OUTPUT.mean |
|
-0.8867419443426080 |
H1:OMC-ASC_Y2_X_SIN_OUT16.rms |
|
-0.8818601017037520 |
H1:SYS-TIMING_C_FO_A_PORT_5_SLAVE_VCXOCTRL.mean |
|
-0.8818600988445600 |
H1:SYS-TIMING_C_FO_A_PORT_5_SLAVE_VCXOCTRL.rms |
|
-0.8750126151025700 |
H1:OMC-ASC_P1_X_COS_OUT16.rms |
|
-0.8673301041530260 |
H1:OMC-ASC_P2_X_SIN_OUT16.rms |
|
-0.8642192268464130 |
H1:ISI-BS_ST2_BLND_RZ_GS13_CUR_IN1_DQ.rms |
|
-0.8627117825481380 |
H1:OMC-ASC_Y2_X_COS_OUT16.rms |
|
-0.861022683603709 |
H1:PEM-C_SUP_RACK1_TEMPERATURE.rms |
|
-0.8610220968306960 |
H1:PEM-C_SUP_RACK1_TEMPERATURE.mean |
|
0.858408671078947 |
H1:IOP-ASC0_ADC_DT_OUT16.mean |
|
0.8573914259079220 |
H1:IOP-ASC0_ADC_DT_OUT16.rms |
|
-0.8571425309954690 |
H1:HPI-ITMY_BLRMS_VP_30M.rms |
|
-0.8571423785897070 |
H1:HPI-ITMY_BLRMS_VP_30M.mean |
|
-0.856700860825061 |
H1:OMC-ASC_Y1_X_COS_OUT16.rms |
|
-0.856420367475446 |
H1:HPI-ITMY_BLRMS_LOG_VP_30M.rms |
|
-0.8564203318837560 |
H1:HPI-ITMY_BLRMS_LOG_VP_30M.mean |
|
-0.8527525850009830 |
H1:IMC-TRANS_IN1_DQ.mean |
|
-0.8527518540230320 |
H1:IMC-TRANS_OUT_DQ.mean |
|
-0.8527496025226880 |
H1:IMC-TRANS_OUT_DQ.rms |
|
-0.8527473701532360 |
H1:IMC-TRANS_OUT16.rms |
|
-0.8527470948451950 |
H1:IMC-TRANS_OUT16.mean |
|
-0.8527326142606620 |
H1:IMC-TRANS_IN1_DQ.rms |
|
-0.8523469401317910 |
H1:OMC-ASC_P1_X_SIN_OUT16.rms |
|
-0.850131863101939 |
H1:OMC-LSC_Q_OUTPUT.rms |
|
-0.850131863101939 |
H1:OMC-LSC_Q_INMON.rms |