Chiara, Jenne.
During some tests with CPS_DIFF in the past weeks, we took some measurements of the DARM when the IFO was locked (10/31/2019). The plot is shown in attachments 1: the green trace is in OFF configuration, the pink one is the ON configuration. The plot shows an improvement below 0.1 Hz when all the chambers (HAMs and BSCs) where locked togehter via CPS_DIFF configuration. Above 0.1 Hz it's a little worse and this is still under investigation.
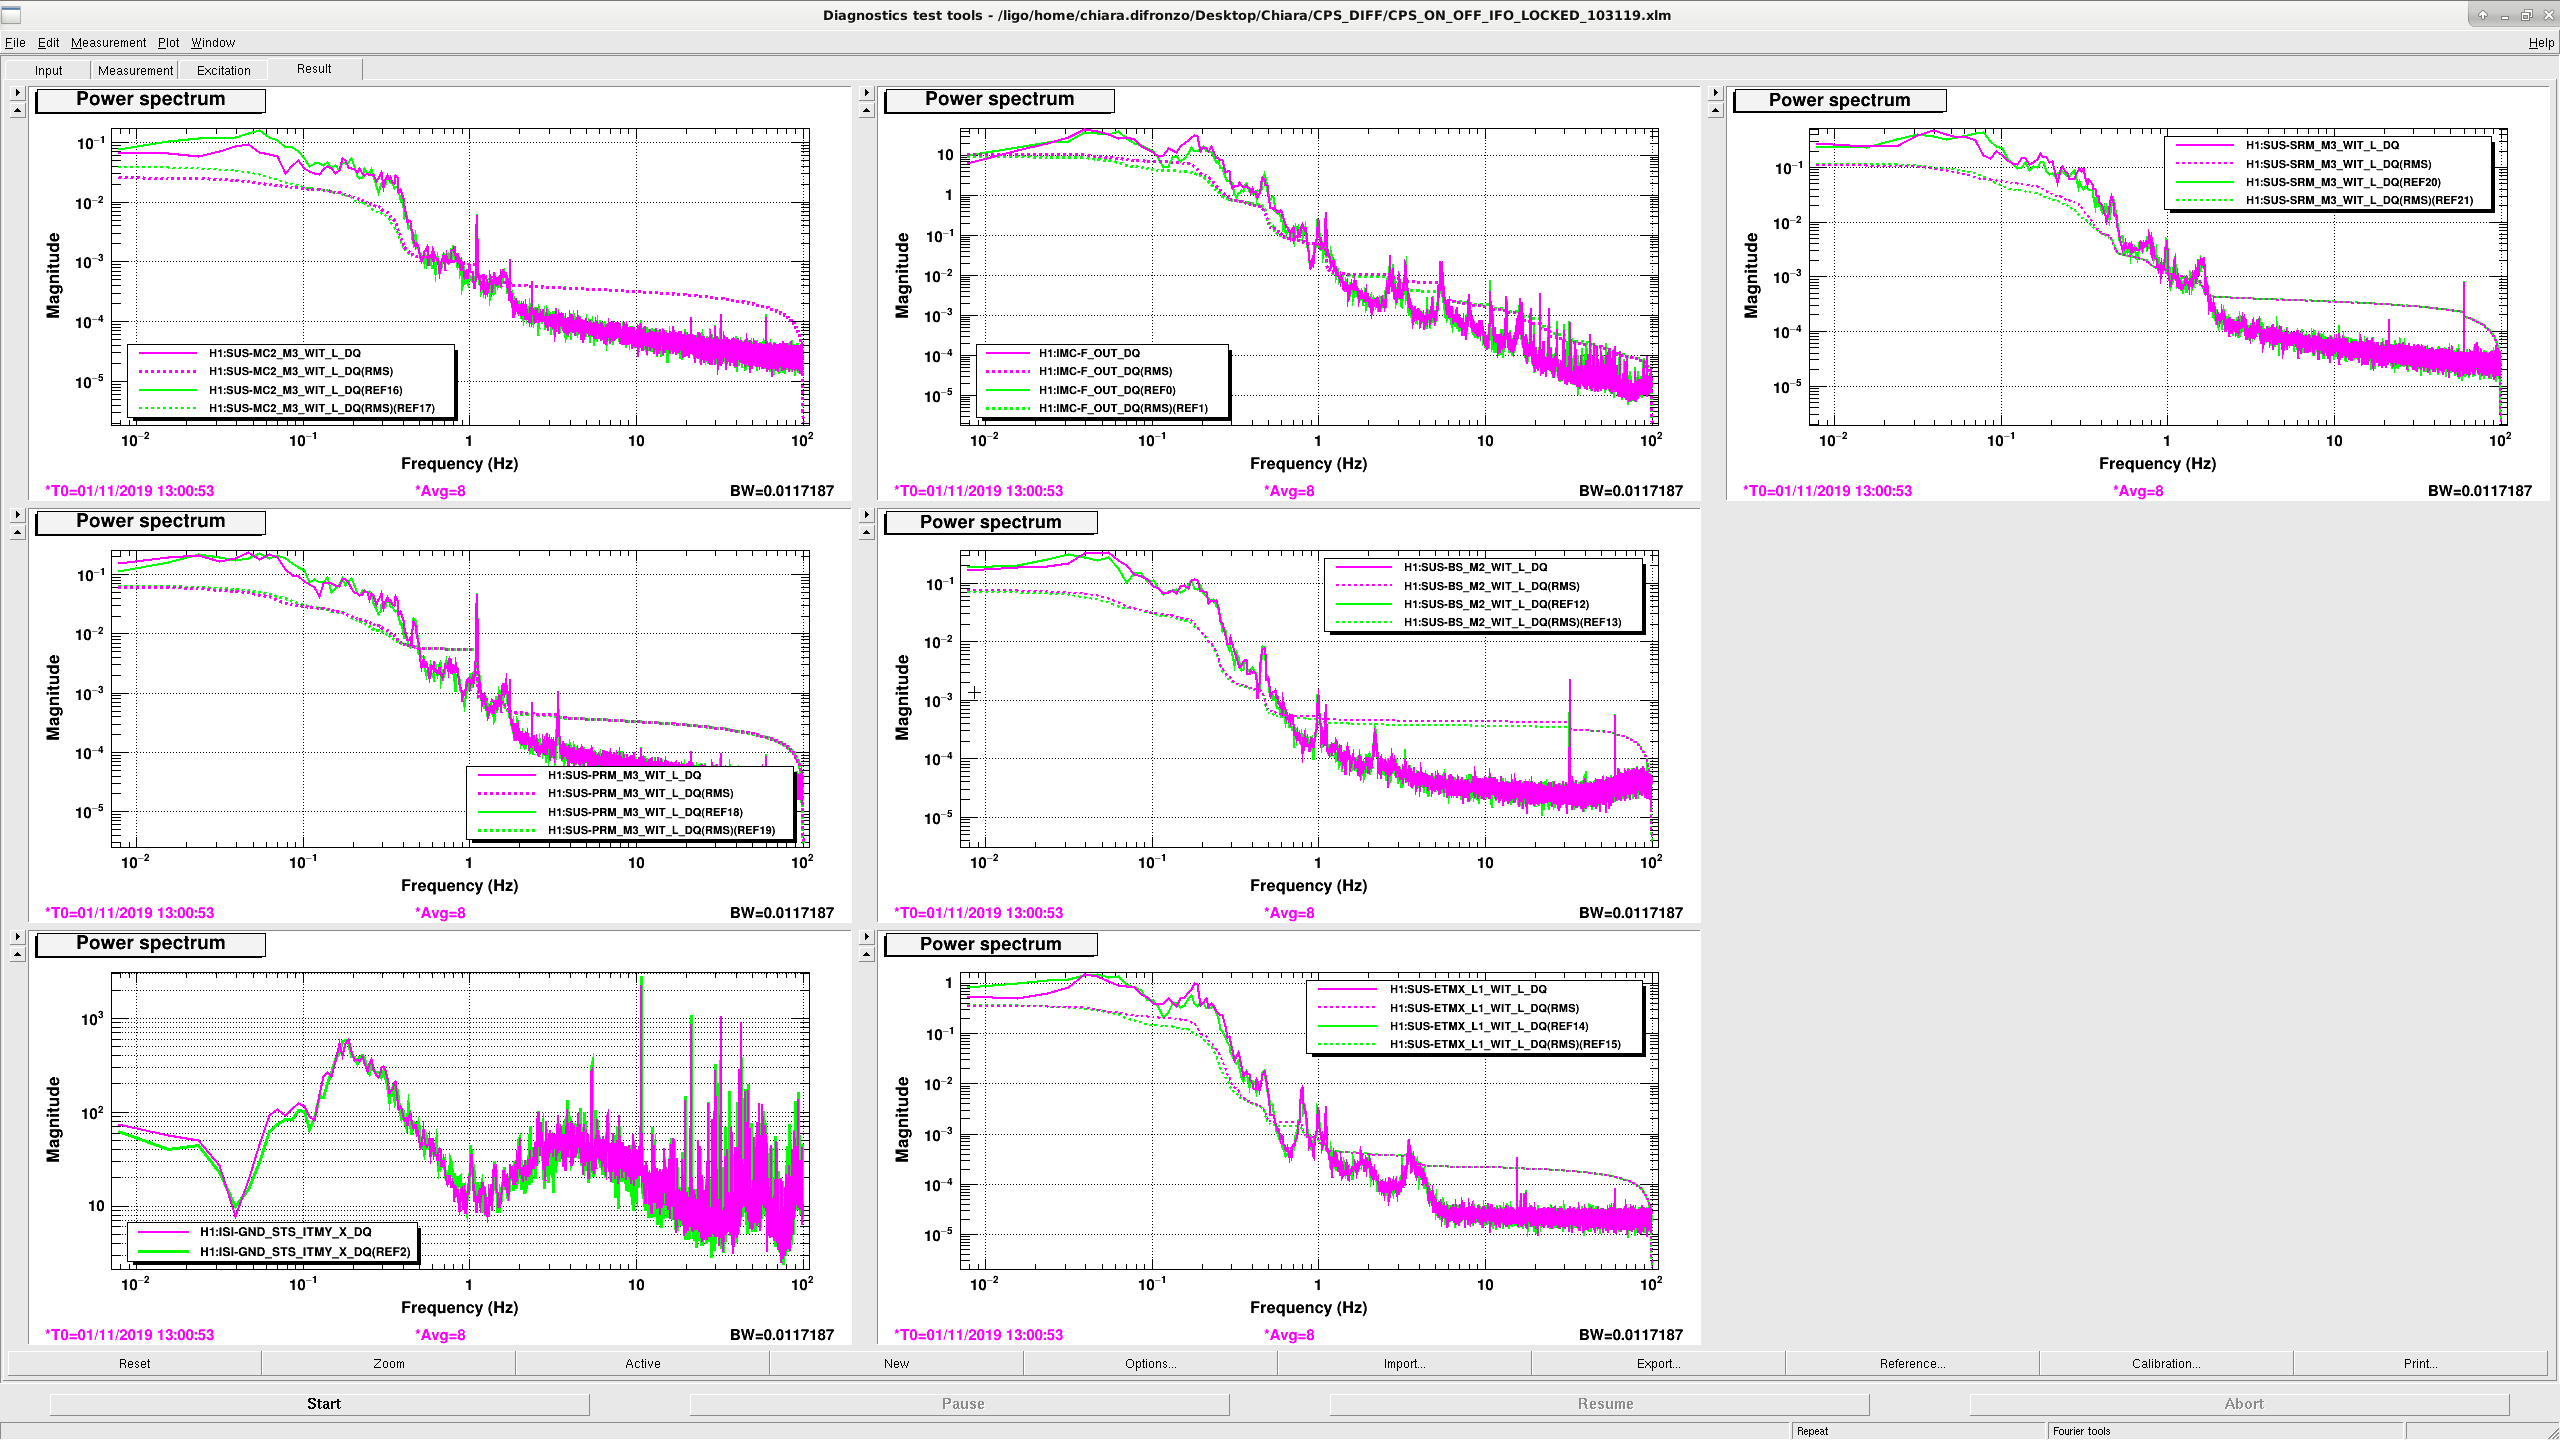
Attachment 2 shows the ground conditions and other measurements in other channels: these measurements all show that at low frequency the RMS when the CPS_DIFF is ON is always below the RMS when the CPS_DIFF is OFF. Green traces are the OFF status, pink traces are the ON status. The suspensions investigated are:
MC2_M3 -> top left plot
IMC-F -> first row, center plot
SRM_M3 -> top right plot
PRM_M3 -> second row, left plot
BS_M2 -> second row, center plot
GND -> bottom left
ETMX_L1 -> third row, center plot

Following Arnaud suggestions (see LLO alog 49728), I am adding some other plots with measurements of other suspensions, and also pitch and yaw.
As usual, green traces are the OFF conditions and pink traces are the ON conditions of CPS_DIFF.
- Attachment 1 shows the CHARD (pitch and yaw), CSOFT and DSOFT channels: CSOFT_P shows an improvement in ON conditions, but it seems there is a worse peak around 0.2 Hz, which is evident also in DSOFT_P. CHARD_P shows a little improvement but this is not seen as well in CHARD_Y, which we expect because of less L2Y coupling than L2P.
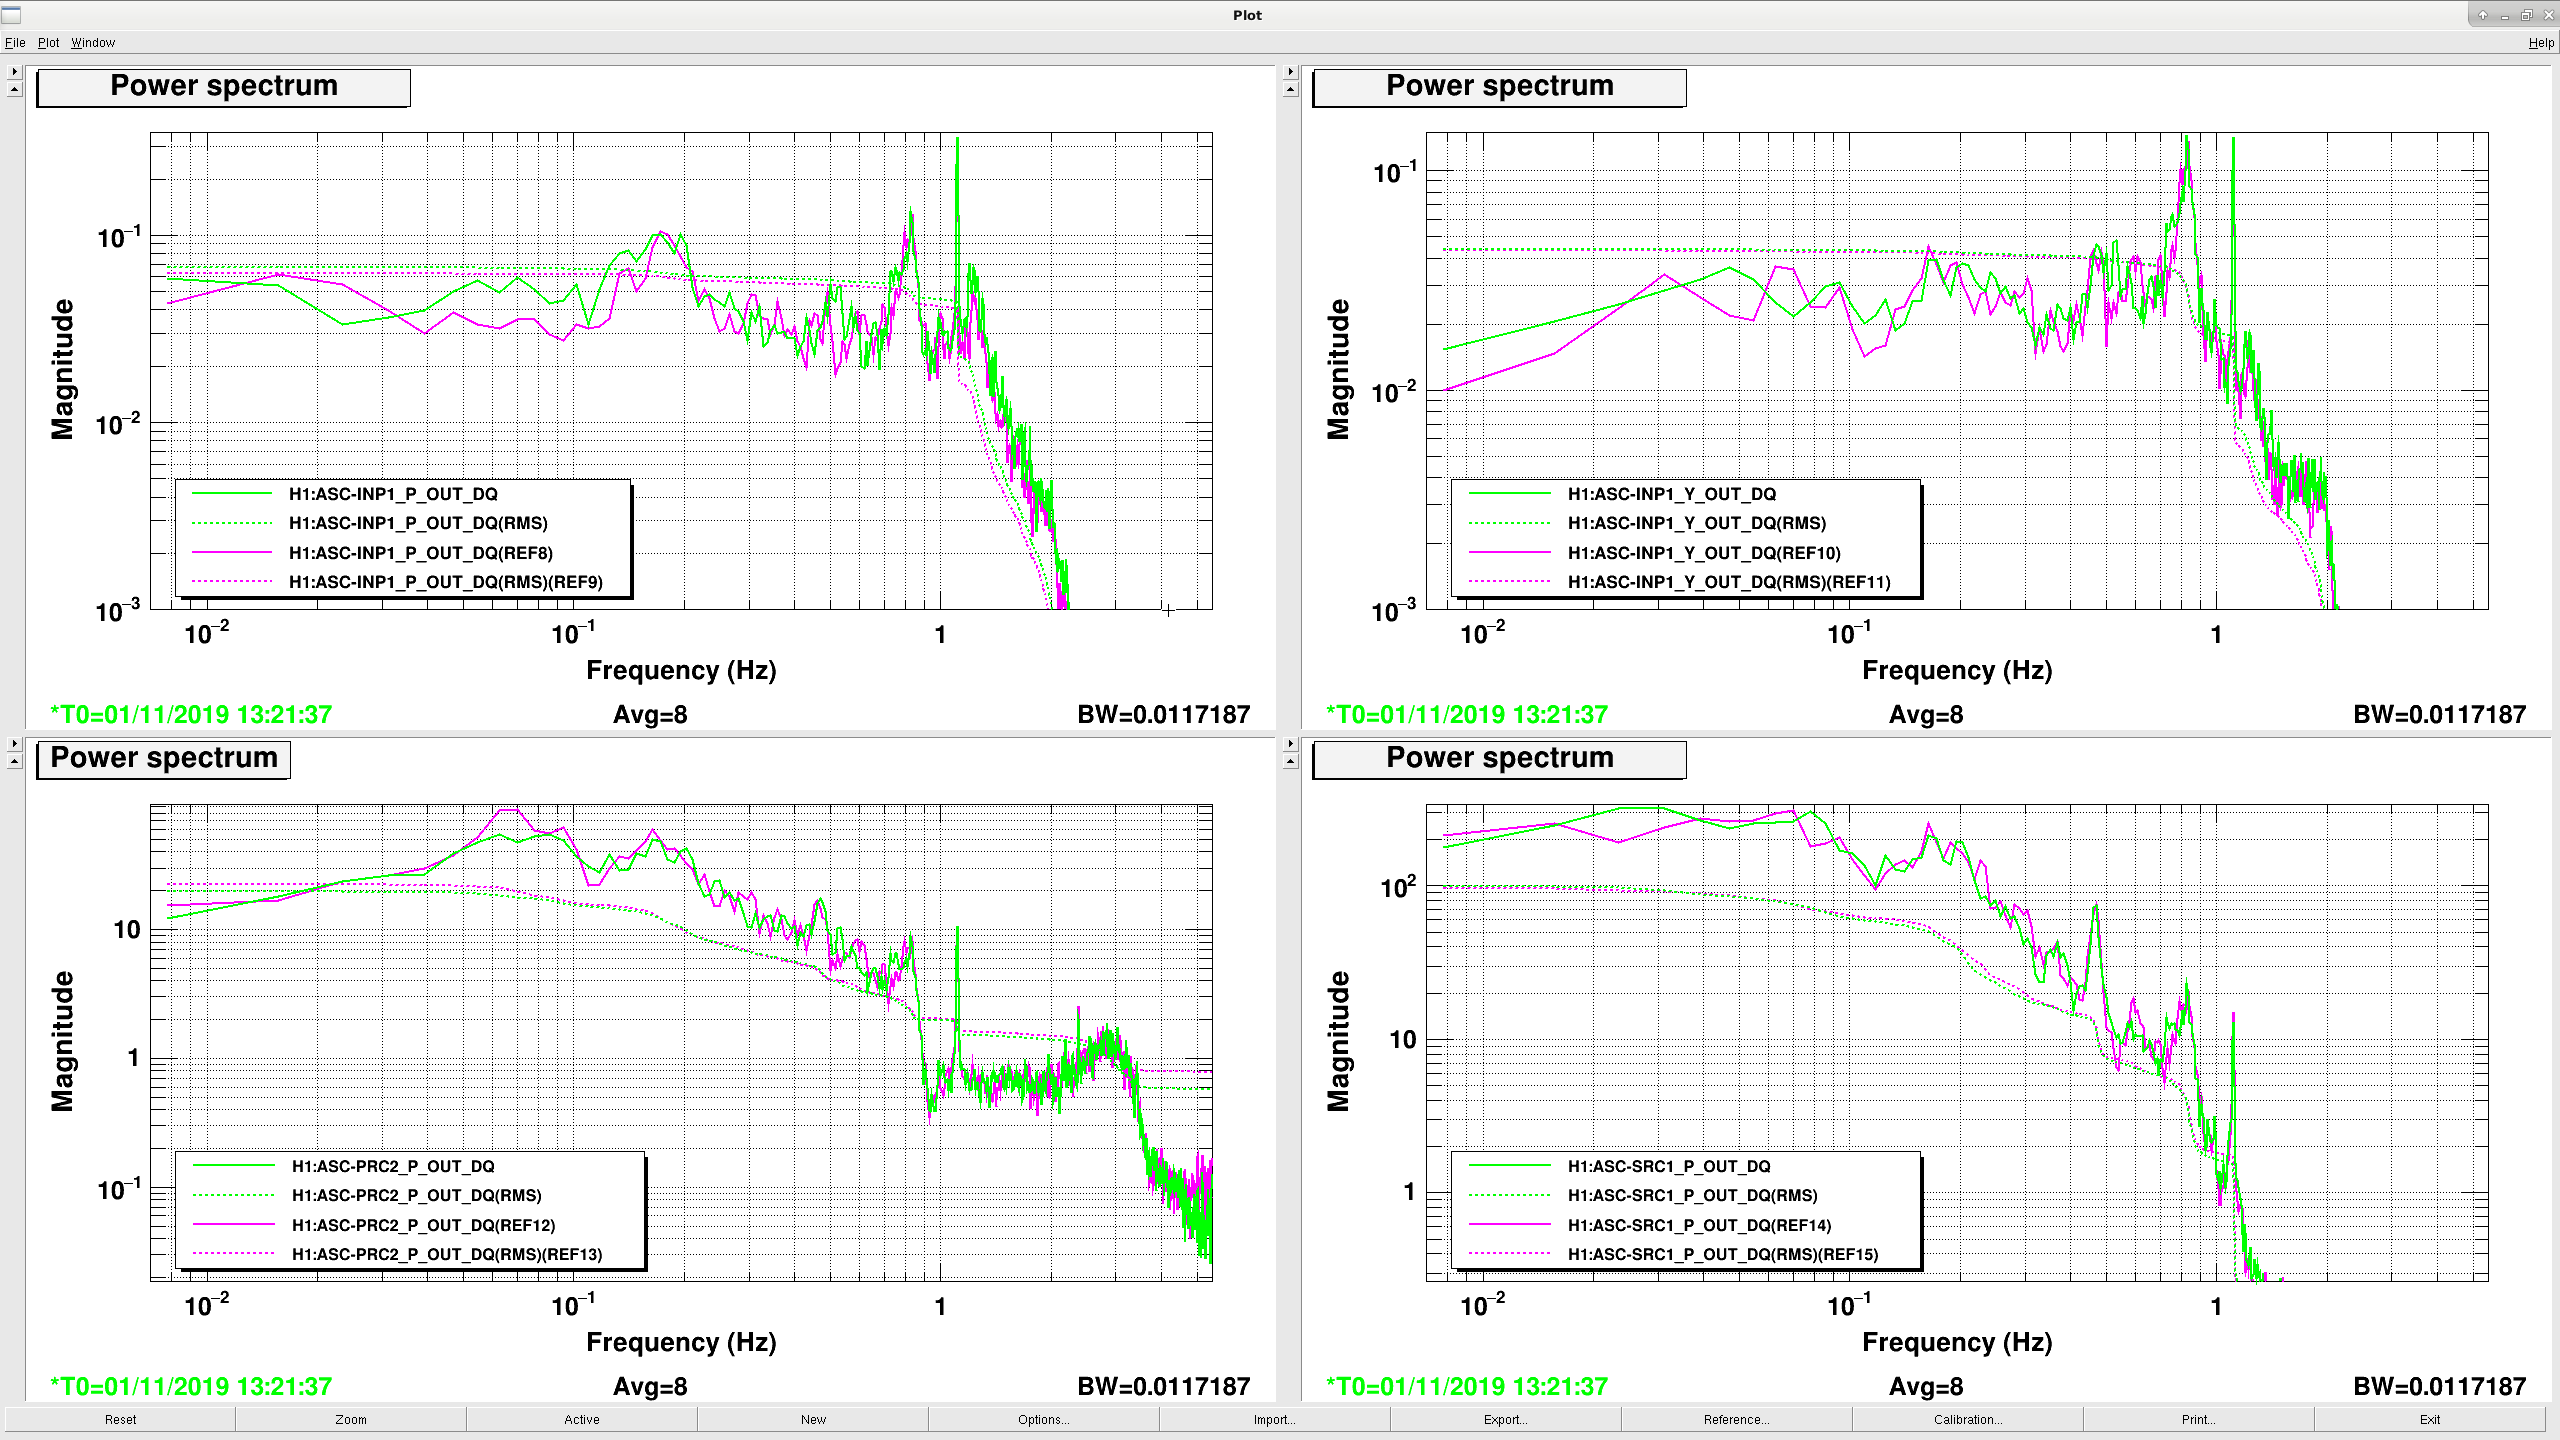
- The ASC_P_Y attachment shows the pitch and yaw from ASC_INP1 and pitch from PRC2_P and SRC1_P: the plots don't show any relevant improvement (maybe some for ASC_INP1_Y below 0.02 Hz). The RMS of ASC_PRC2_P in ON conditions is worse than the RMS in OFF conditions.
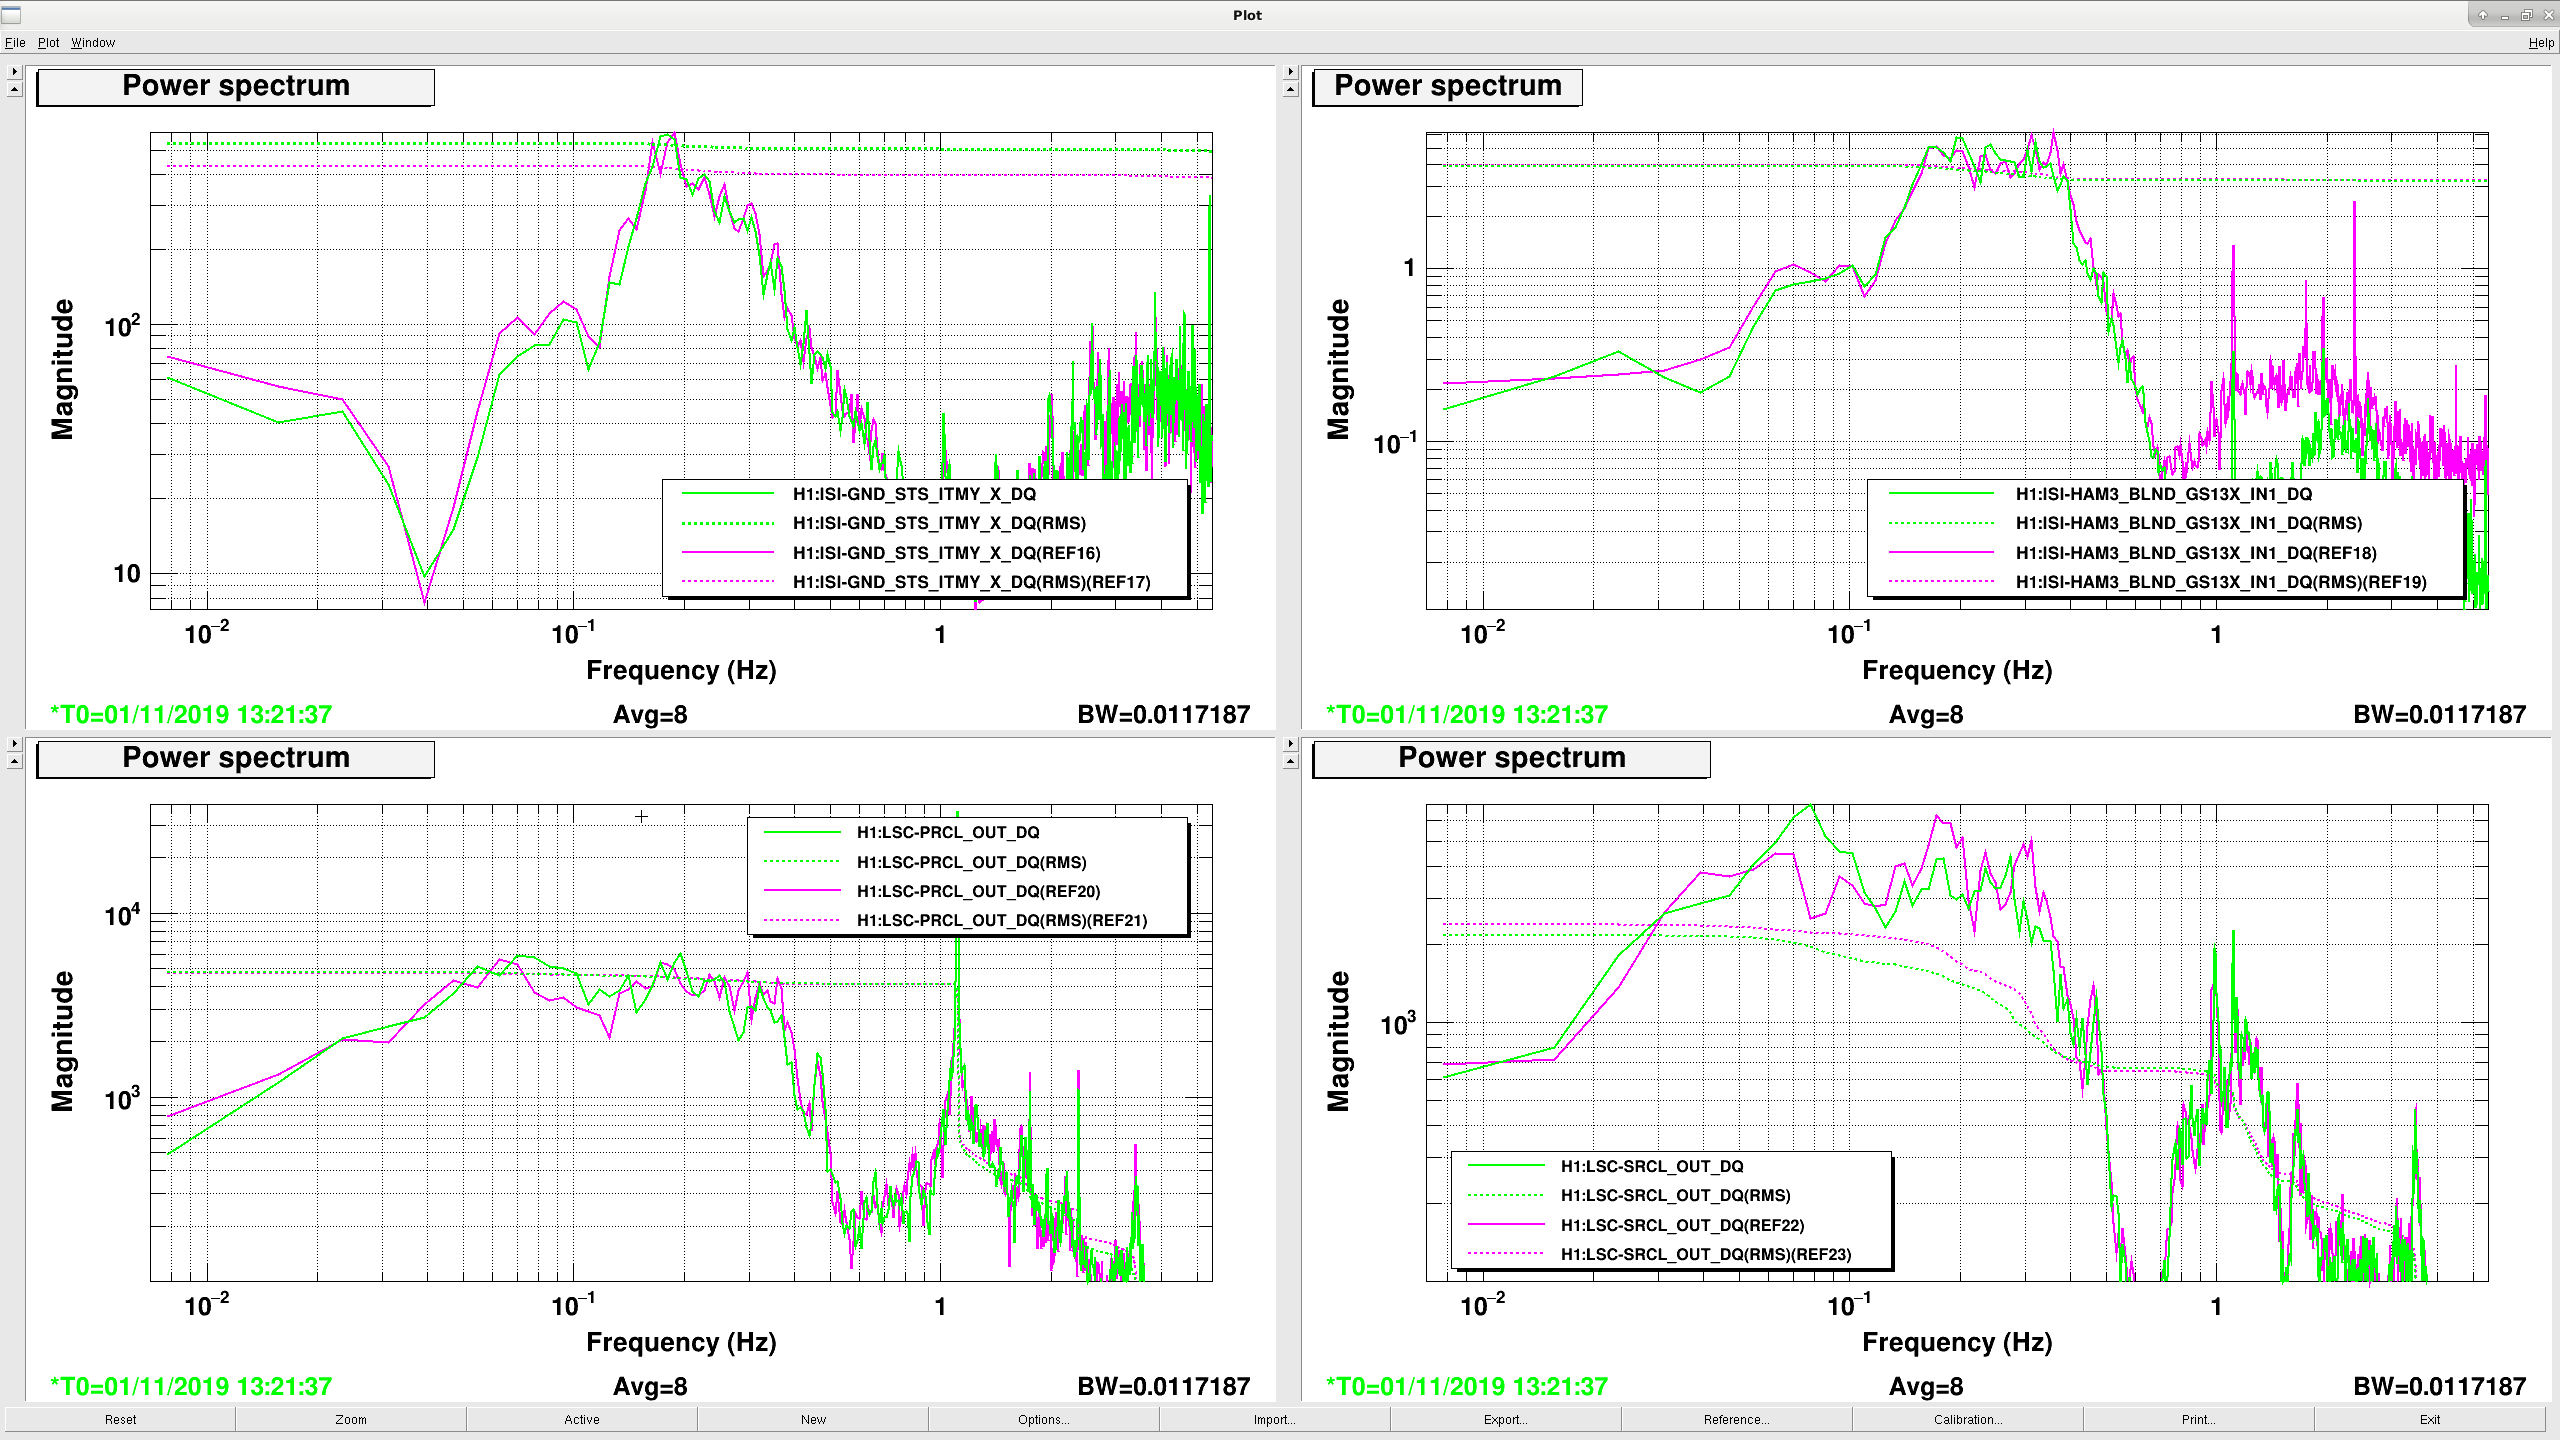
- Attachment 3 shows plots of GND_STS_ITMY_X, HAM3_BLND_GS13, PRCL and SRCL: PRCL doesn't seems to see any relevant variations, while SRCL appears to be slightly worse. Also, HAM3 is dramatically worse in ON conditions above 0.7 Hz: we will investigate the reason in the next days.
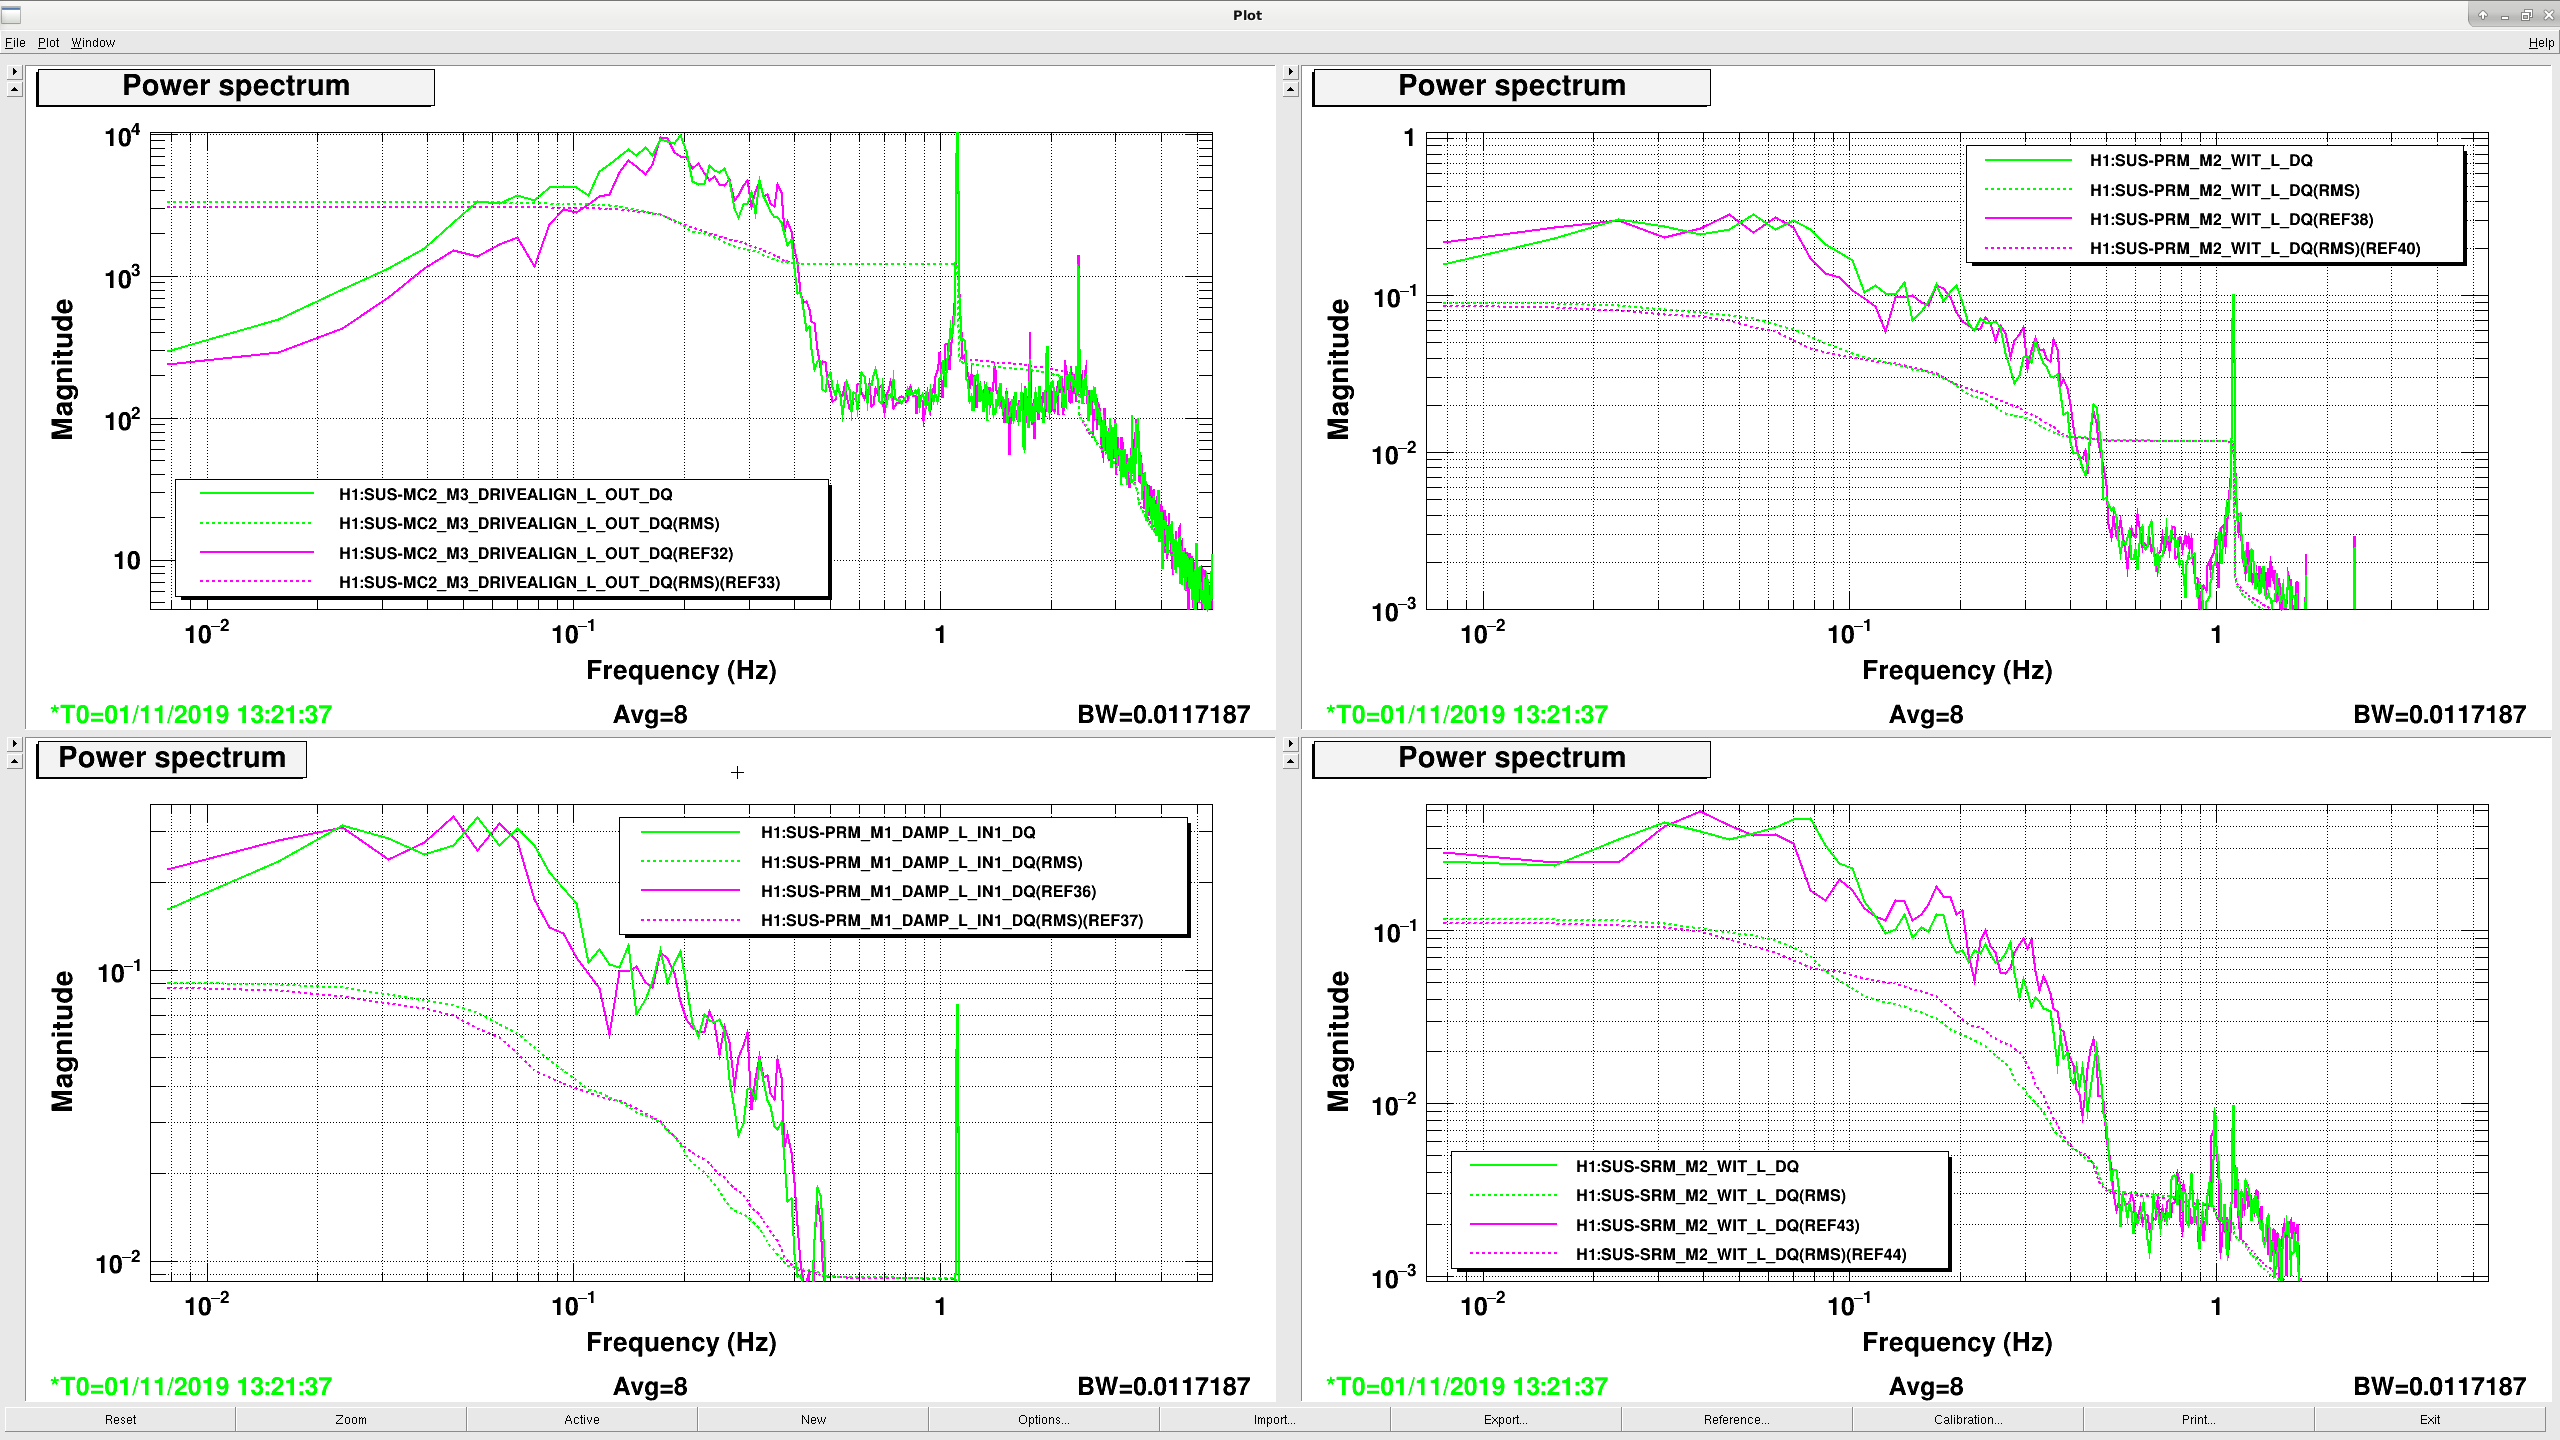
- The PRM_SRM_MC2 plots in attachments 3 show the behaviour of MC2_M3_DRIVEALIGN, PRM_M2, PRM_M1 and SRM_M2: MC2_M3_DRIVEALIGN shows an improvement in ON conditions, while the others don't show any important variation (the RMS in ON traces is always below the RMS in OFF traces).
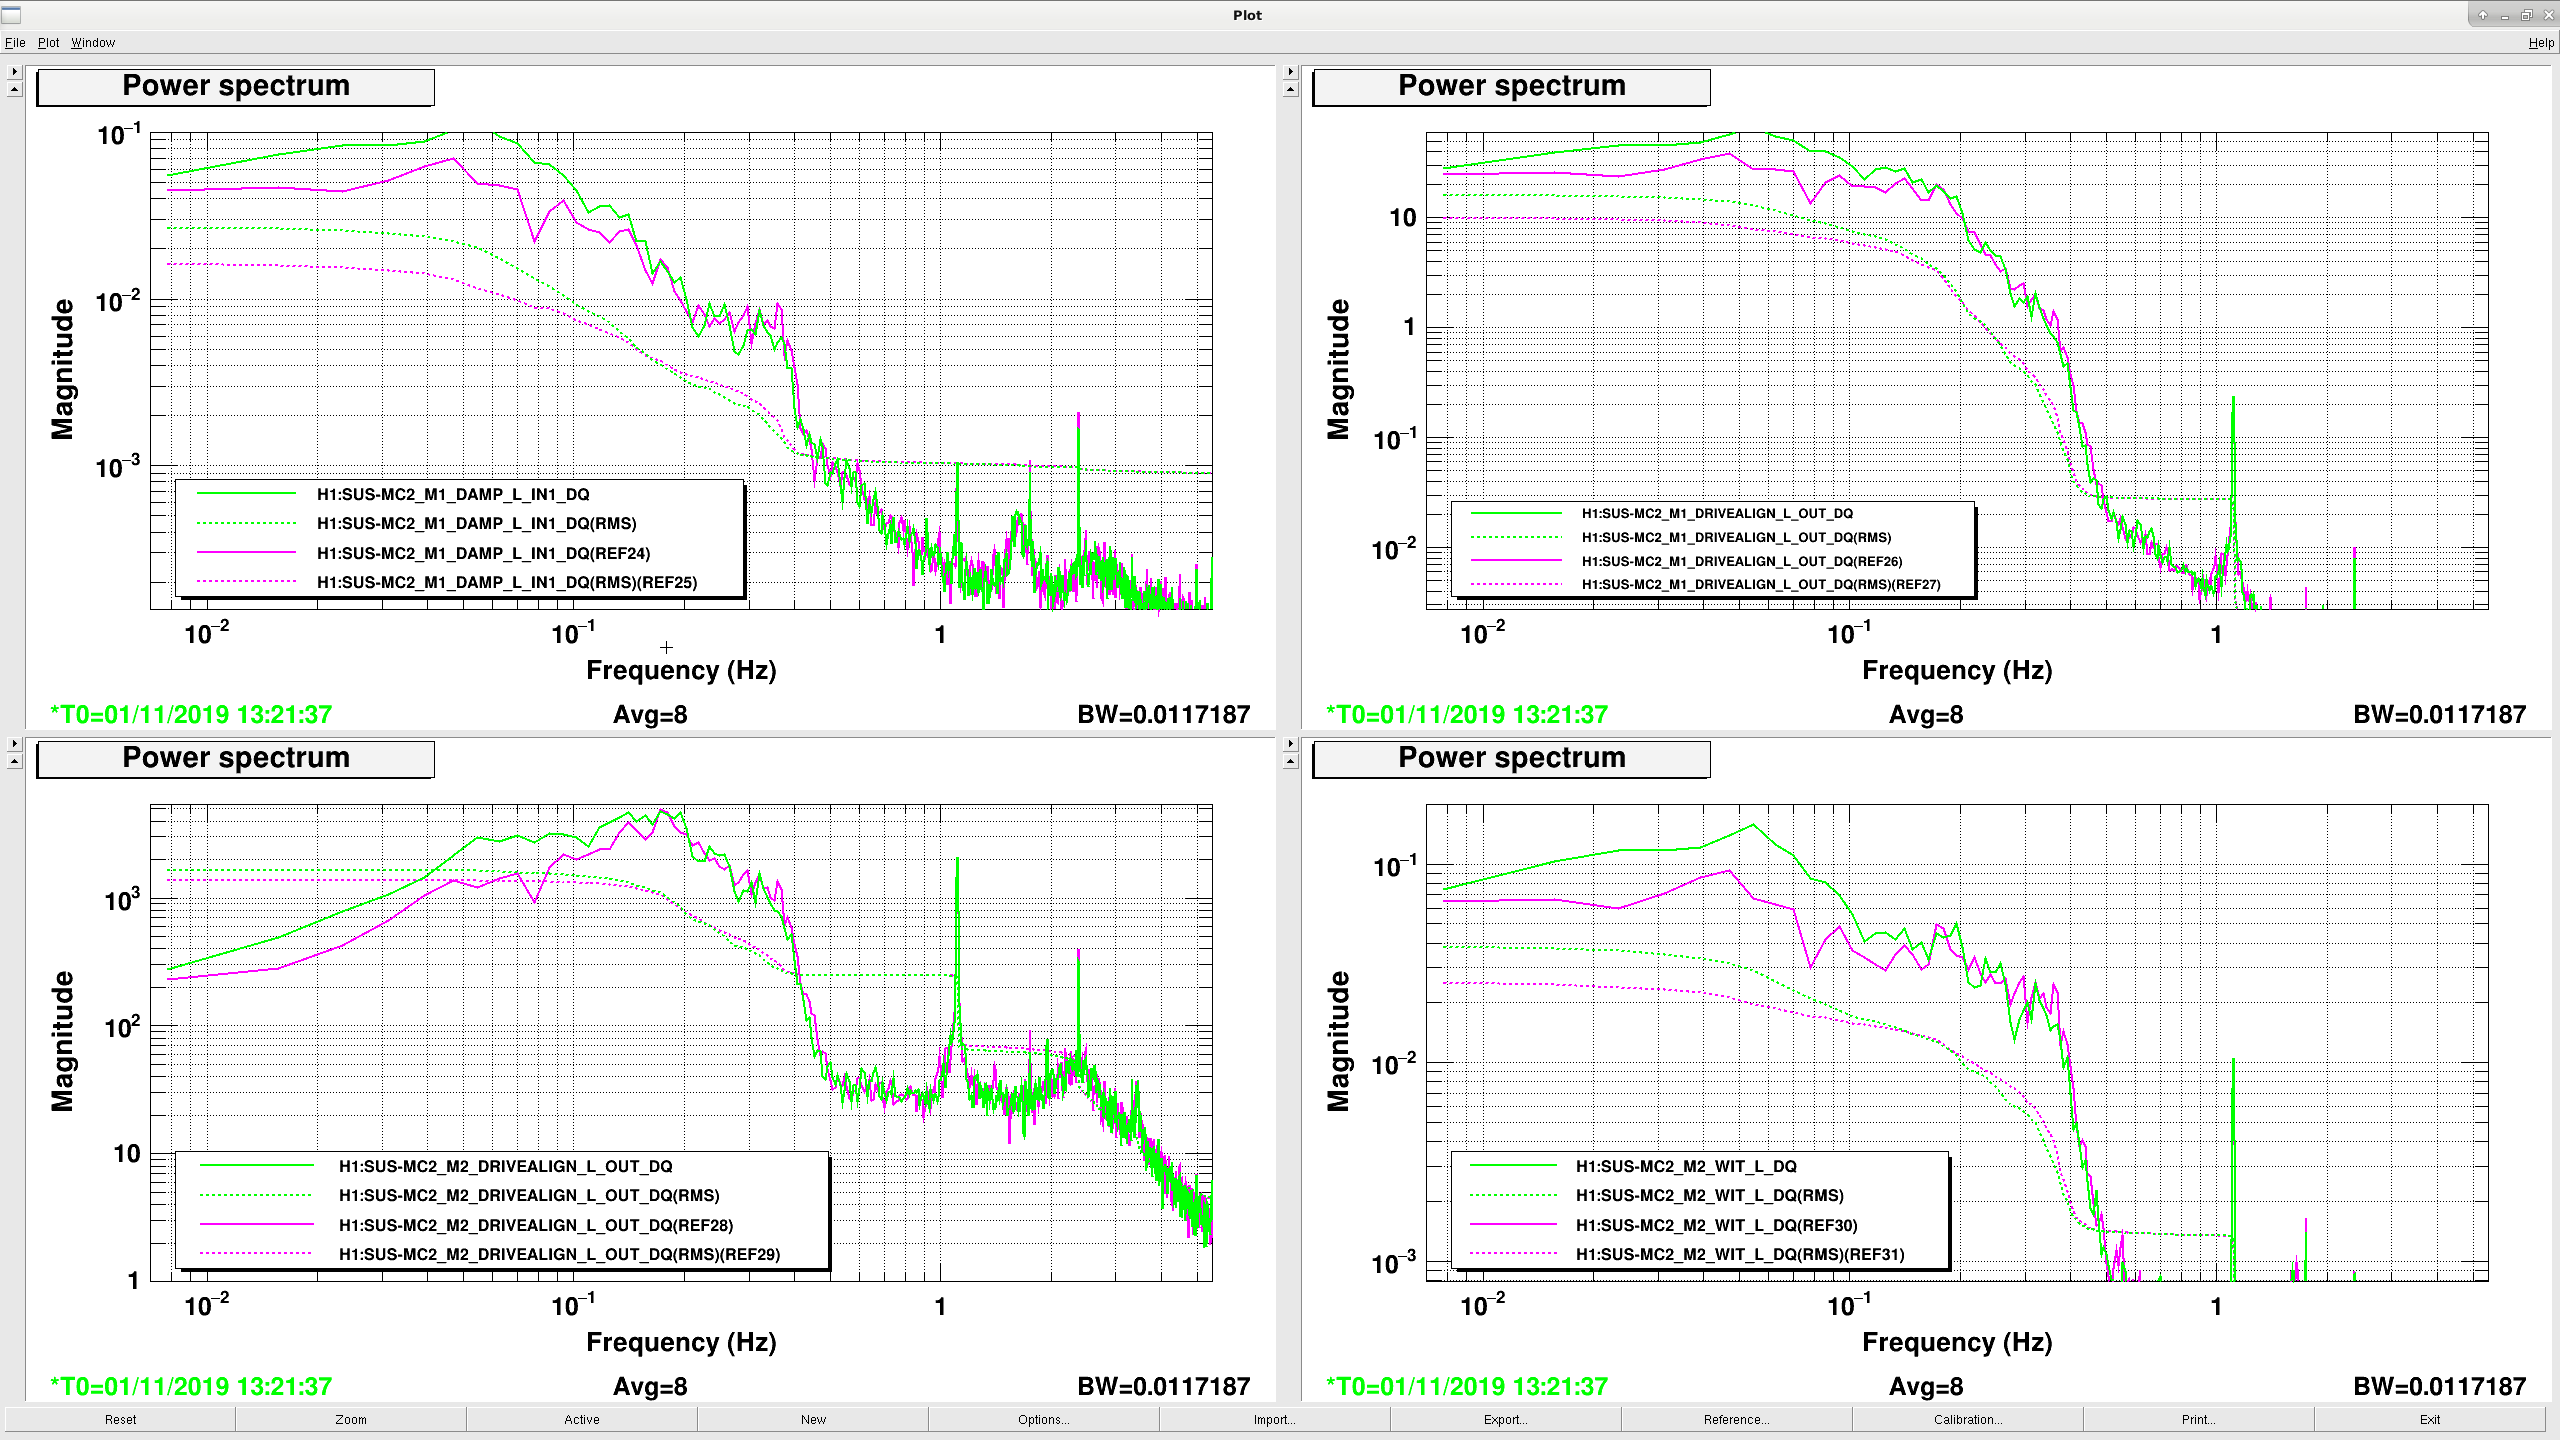
- The SUS_MC2 plots in attachment 4 show MC2_M1 and MC2_M2 from different channels (WIT, DRIVEALIGN, DAMP): each plot shows an improvement when CPS_DIFF is ON.