Putting up some data about ETM alignments early in the locking sequence, to see if there are any trends to help make locking more automated.
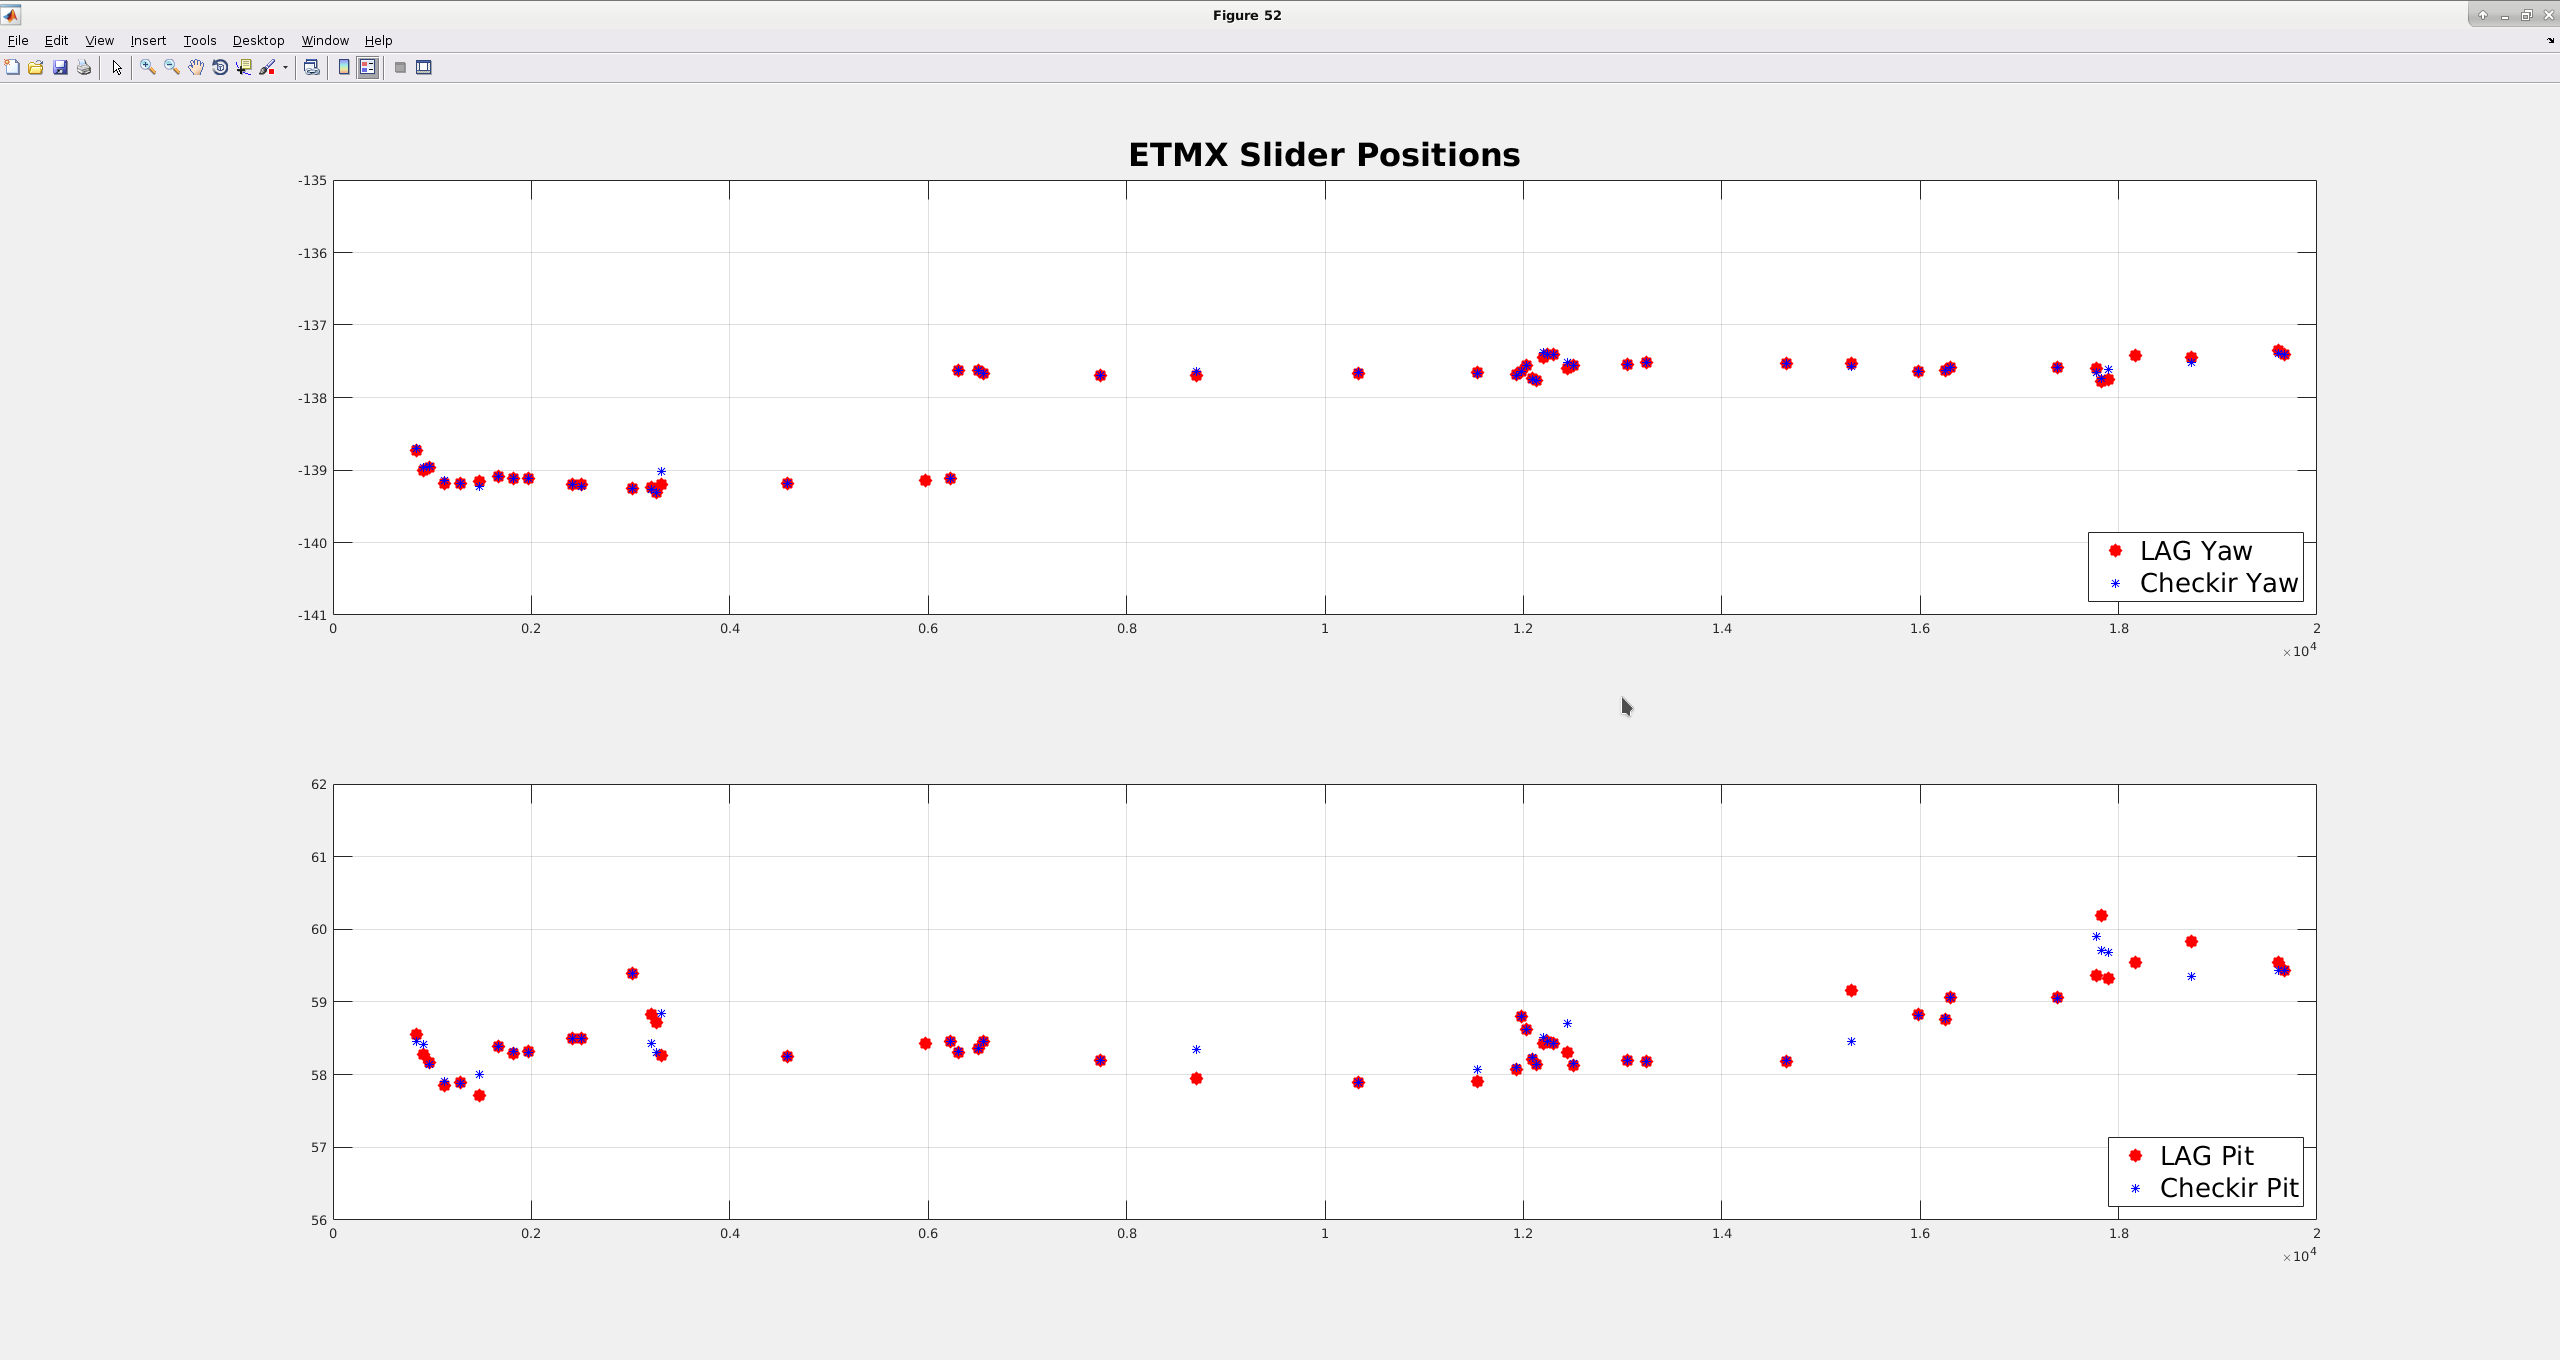
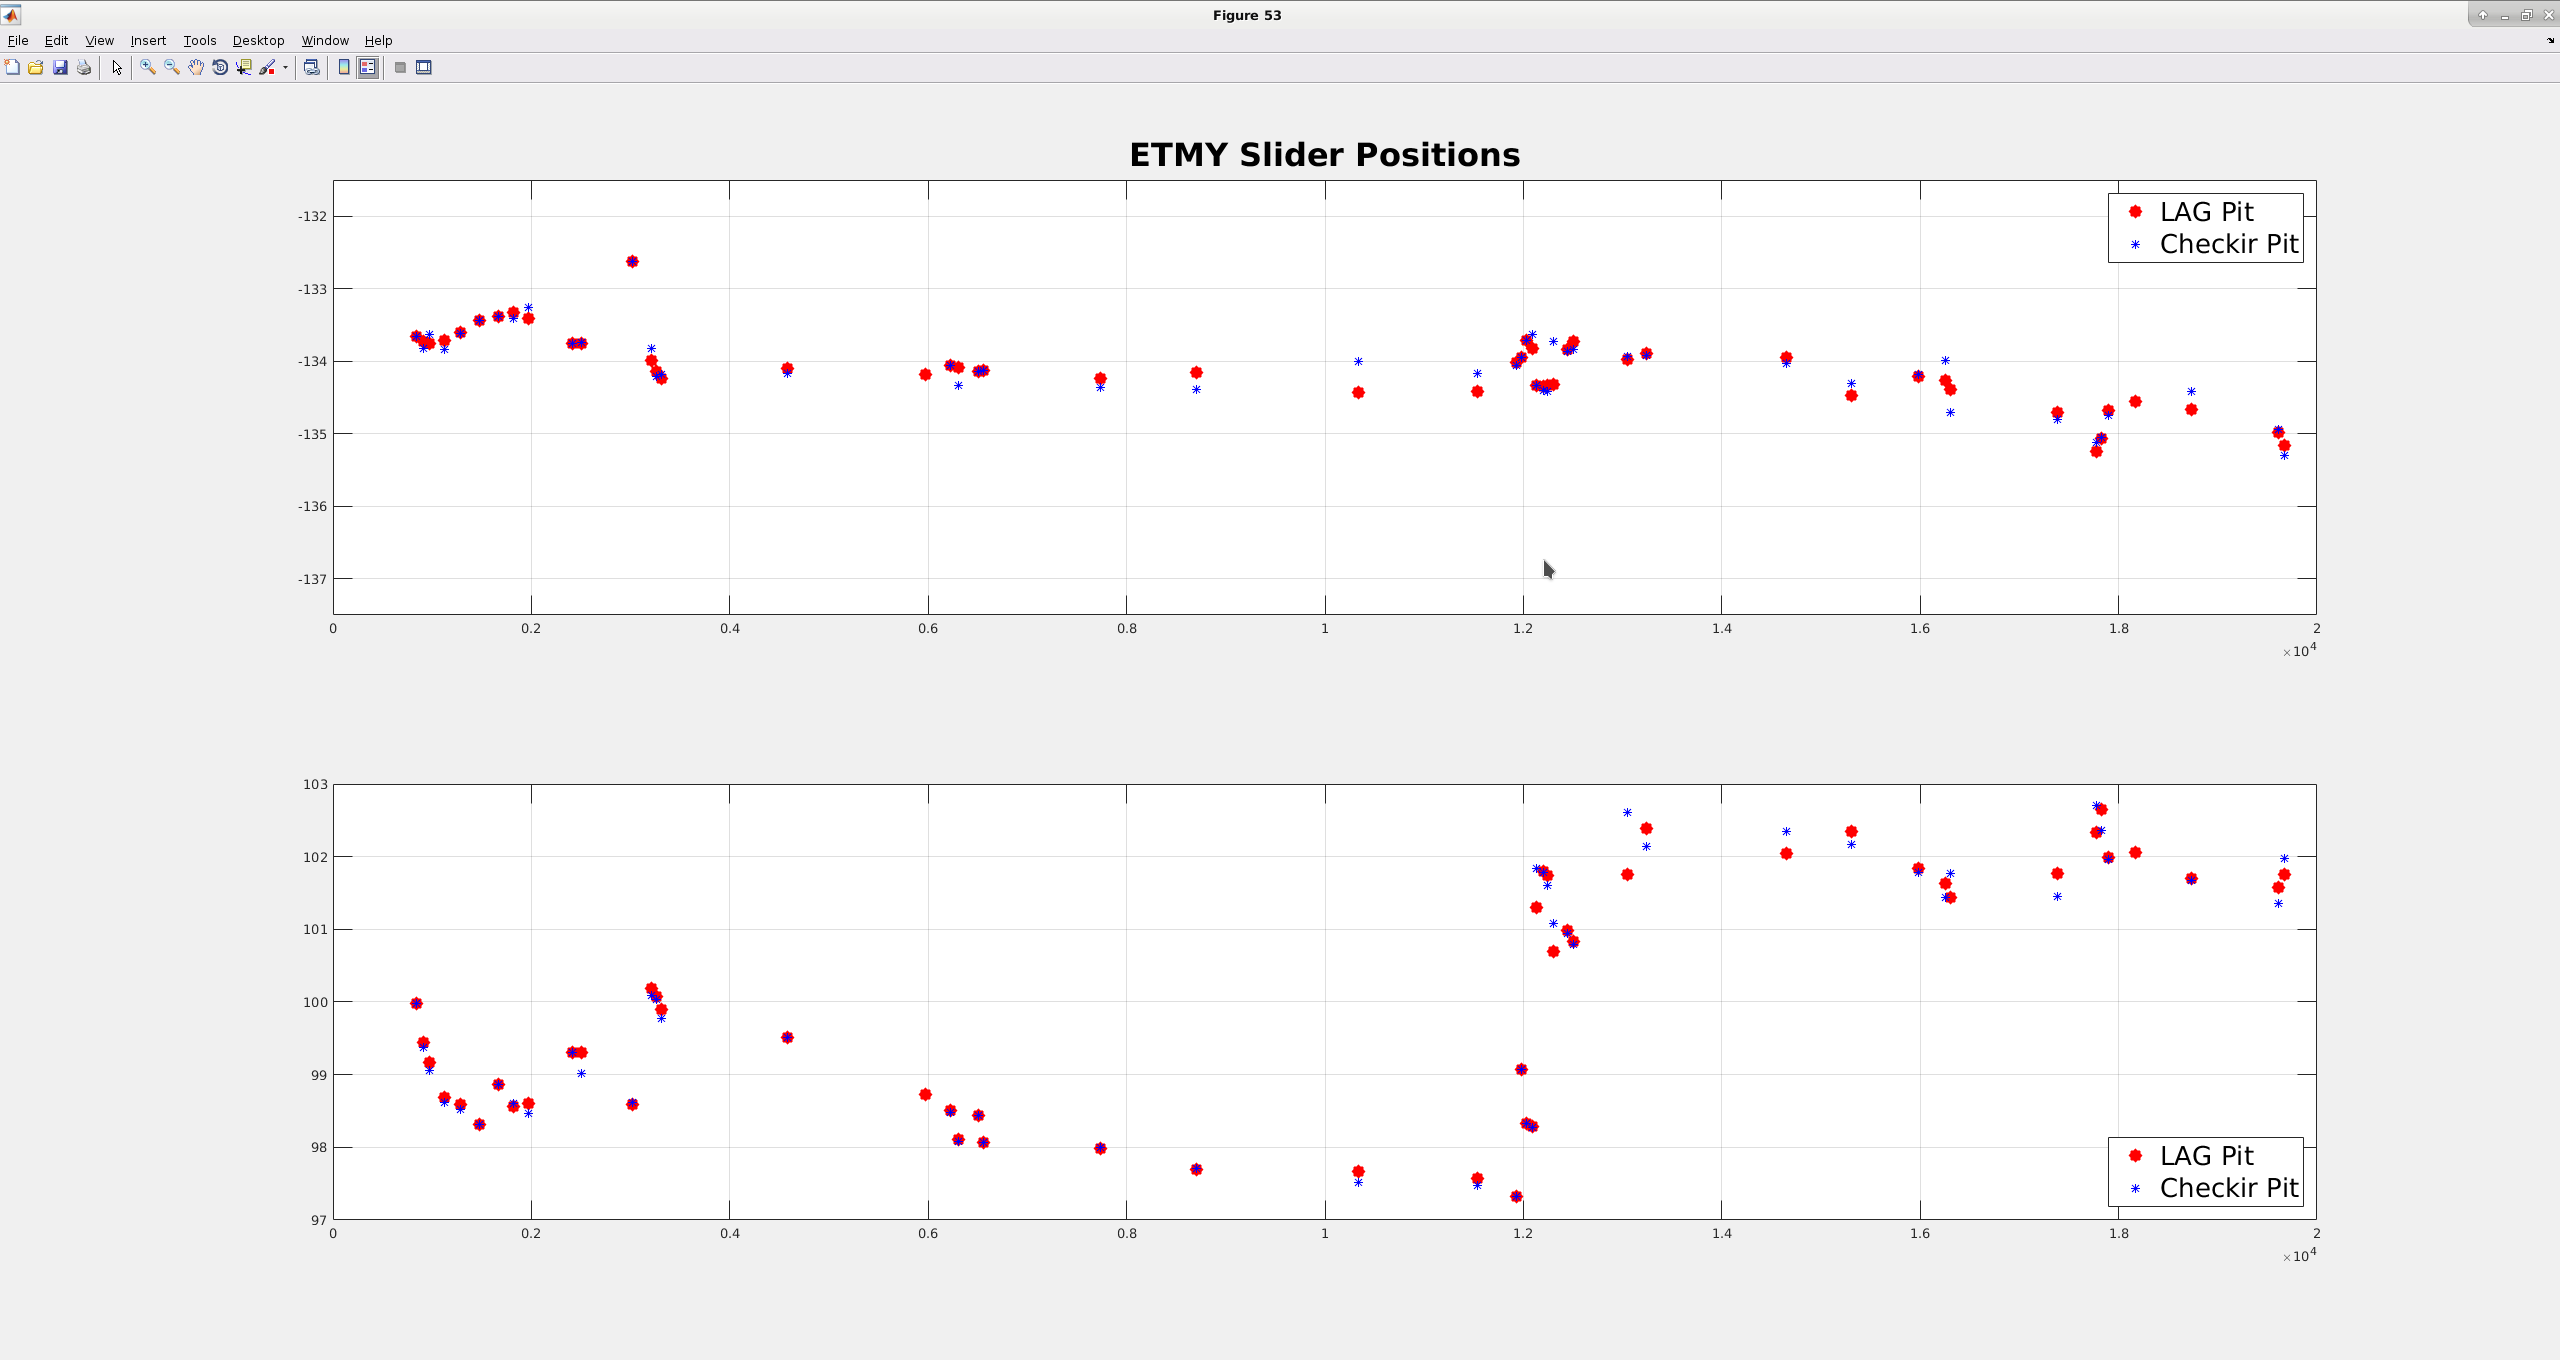
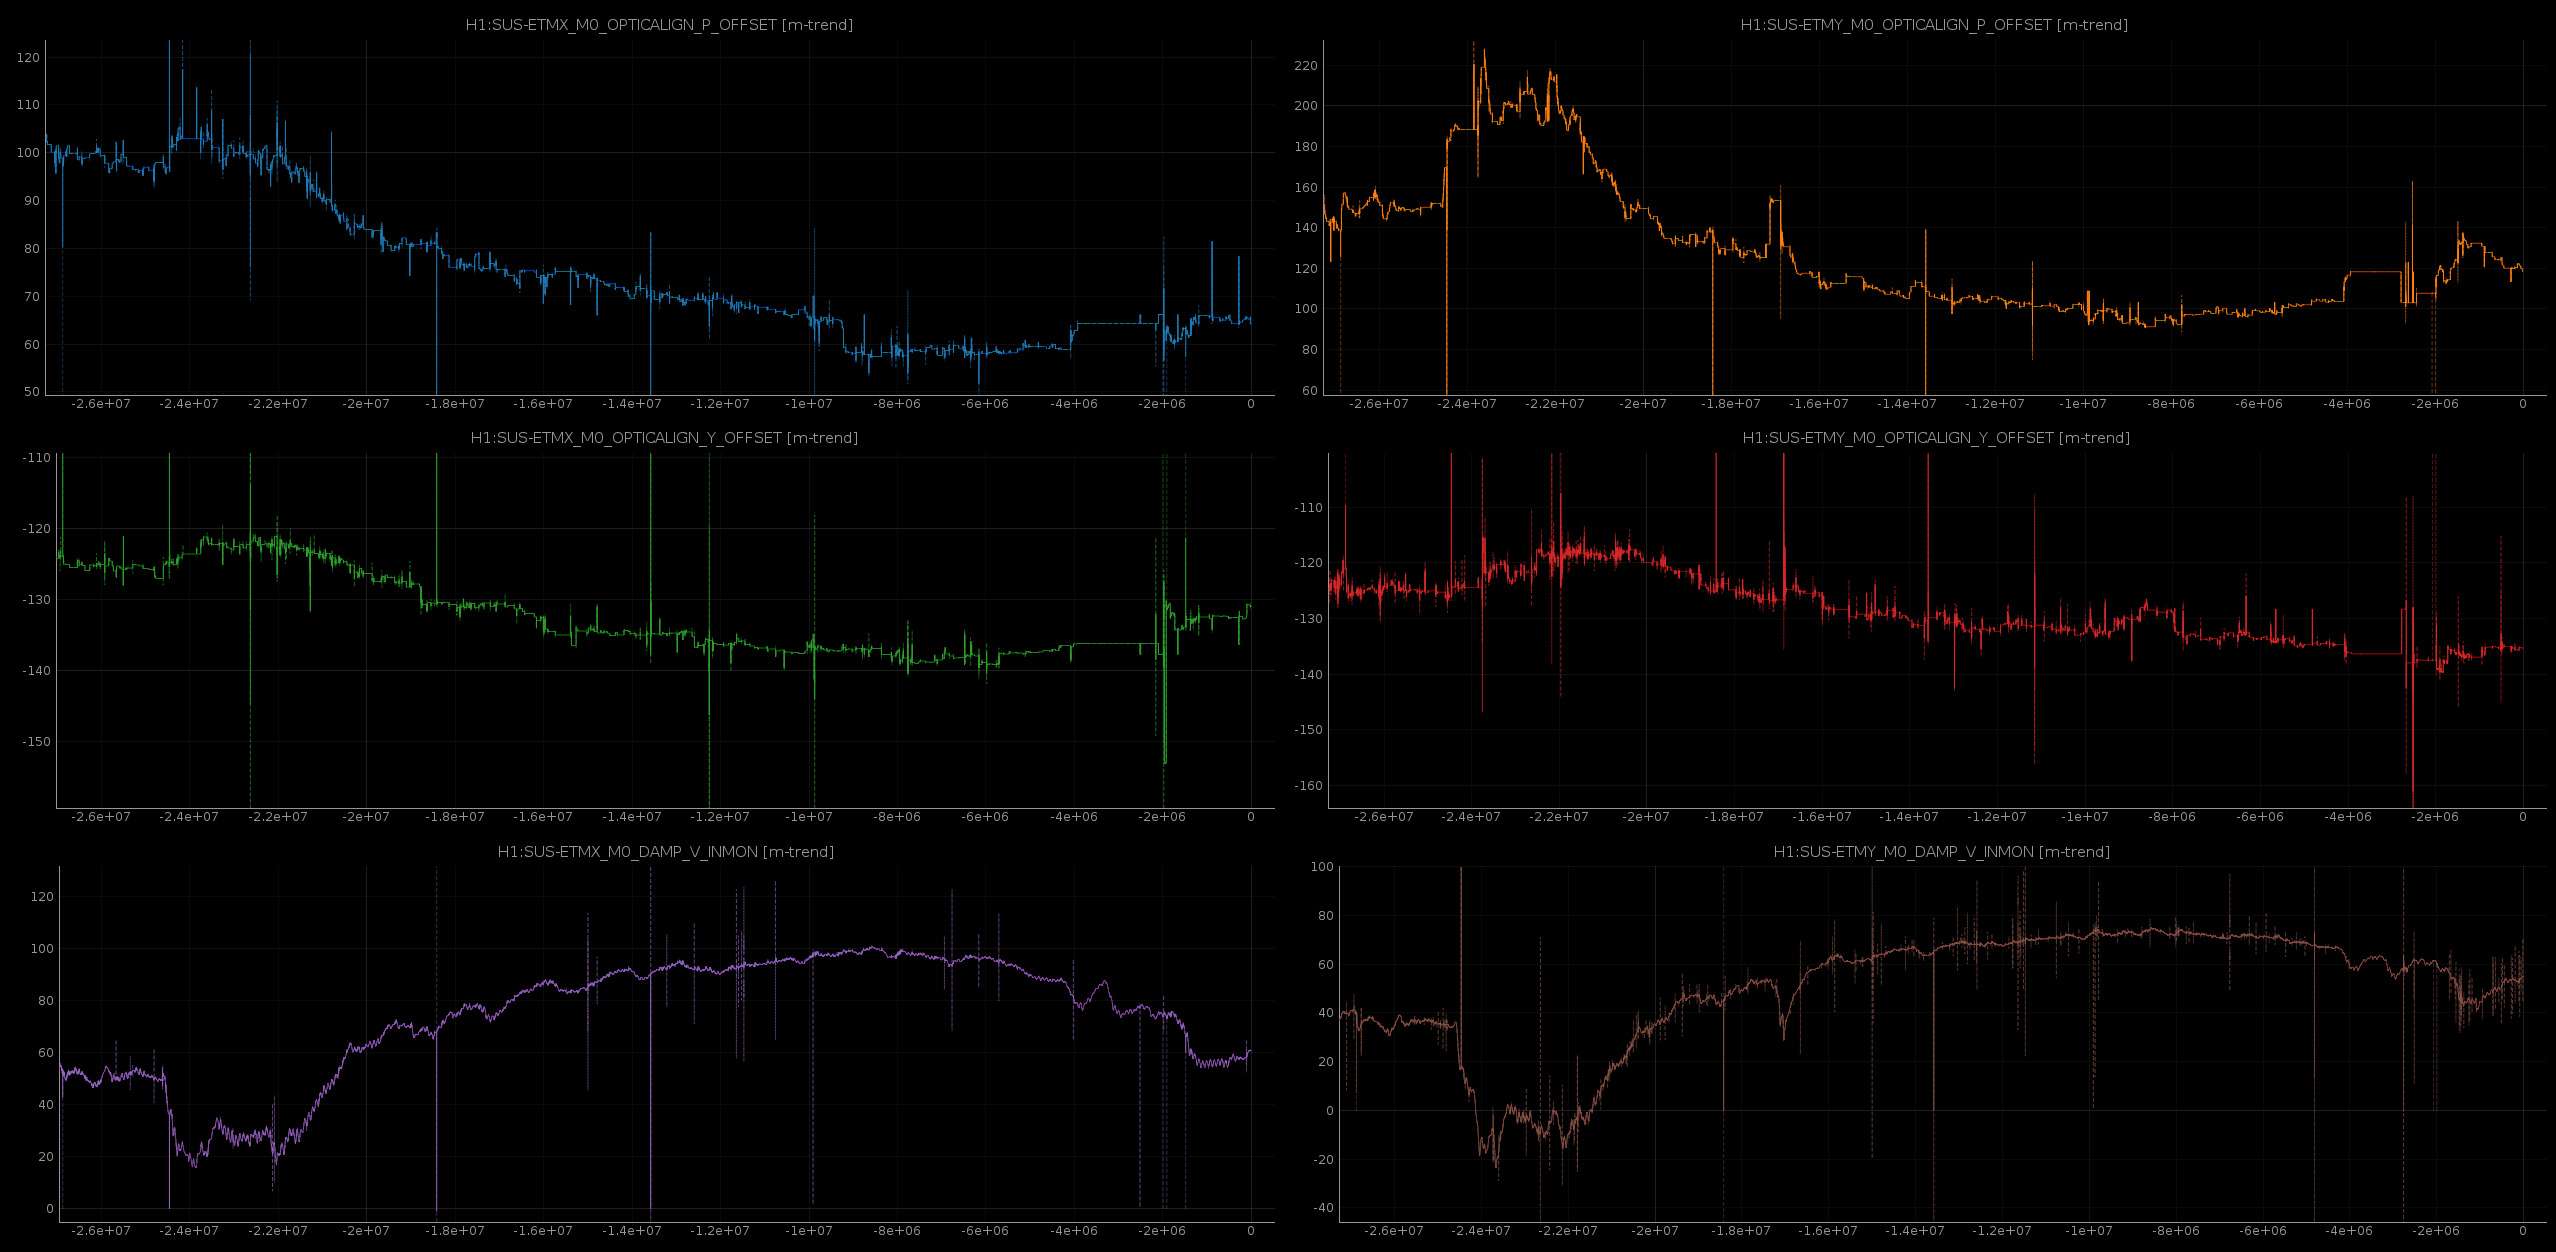
First two plots are ETM slider position timeseries for the last 50 locks of O3a, roughly the last 2 weeks. First plot is ETMX, yaw is top subplot and pit on bottom. The red dots are the ETM slider postion for the first ten seconds of the LOCKING_ARMS_GREEN state, blue spots are the slider position at CHECK_IR. Second plot is the same thing for ETMY. The X-axis here is minutes for the timeseries, Y-axis is the slider value, which I believe is in microradians. I've scaled the y range for all the subplots to be the same to make it easier to see which optics deviate more.
It's interesting here that there are a number of obvious jumps in the slider values, the biggest being about 4 microradians over a couple days in the middle of the bottom plot for ETMY. There is also the rather abrupt shift in ETMX yaw of about 2 microradians at 6000 minutes in, otherwise yaw for both ETMs seems more stable than pitch. It would be interesting to try to see if the these jumps align with things like temperatures or maintenance periods.
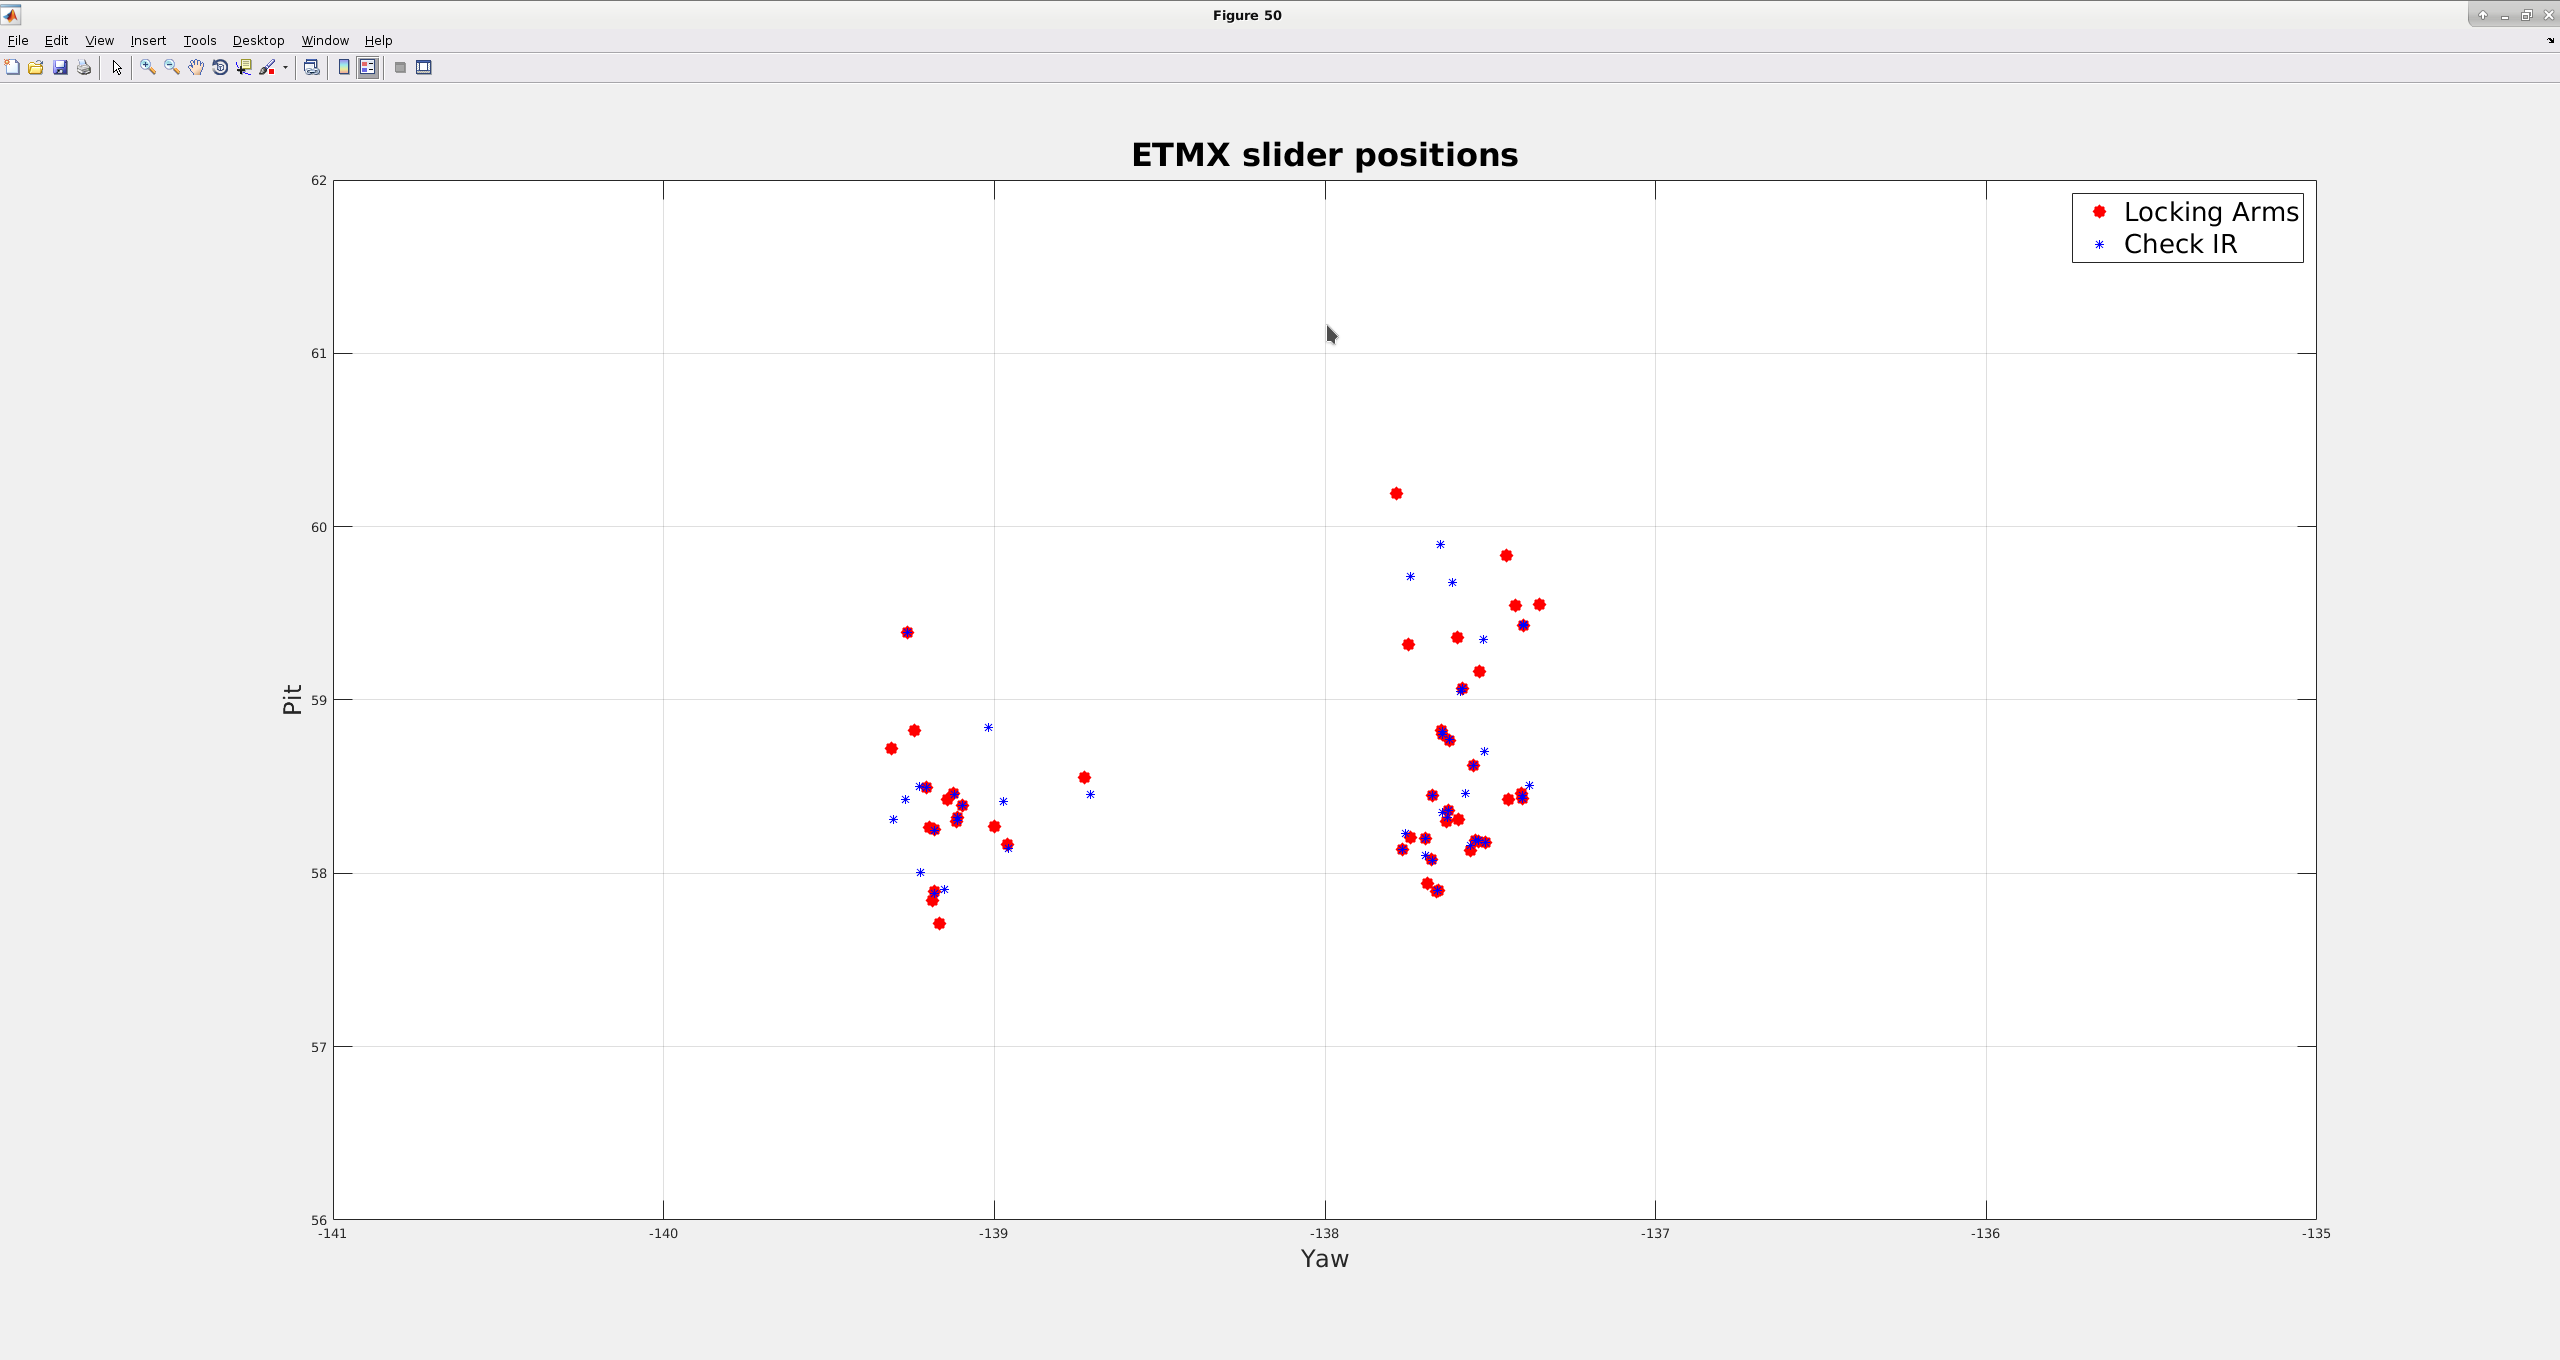
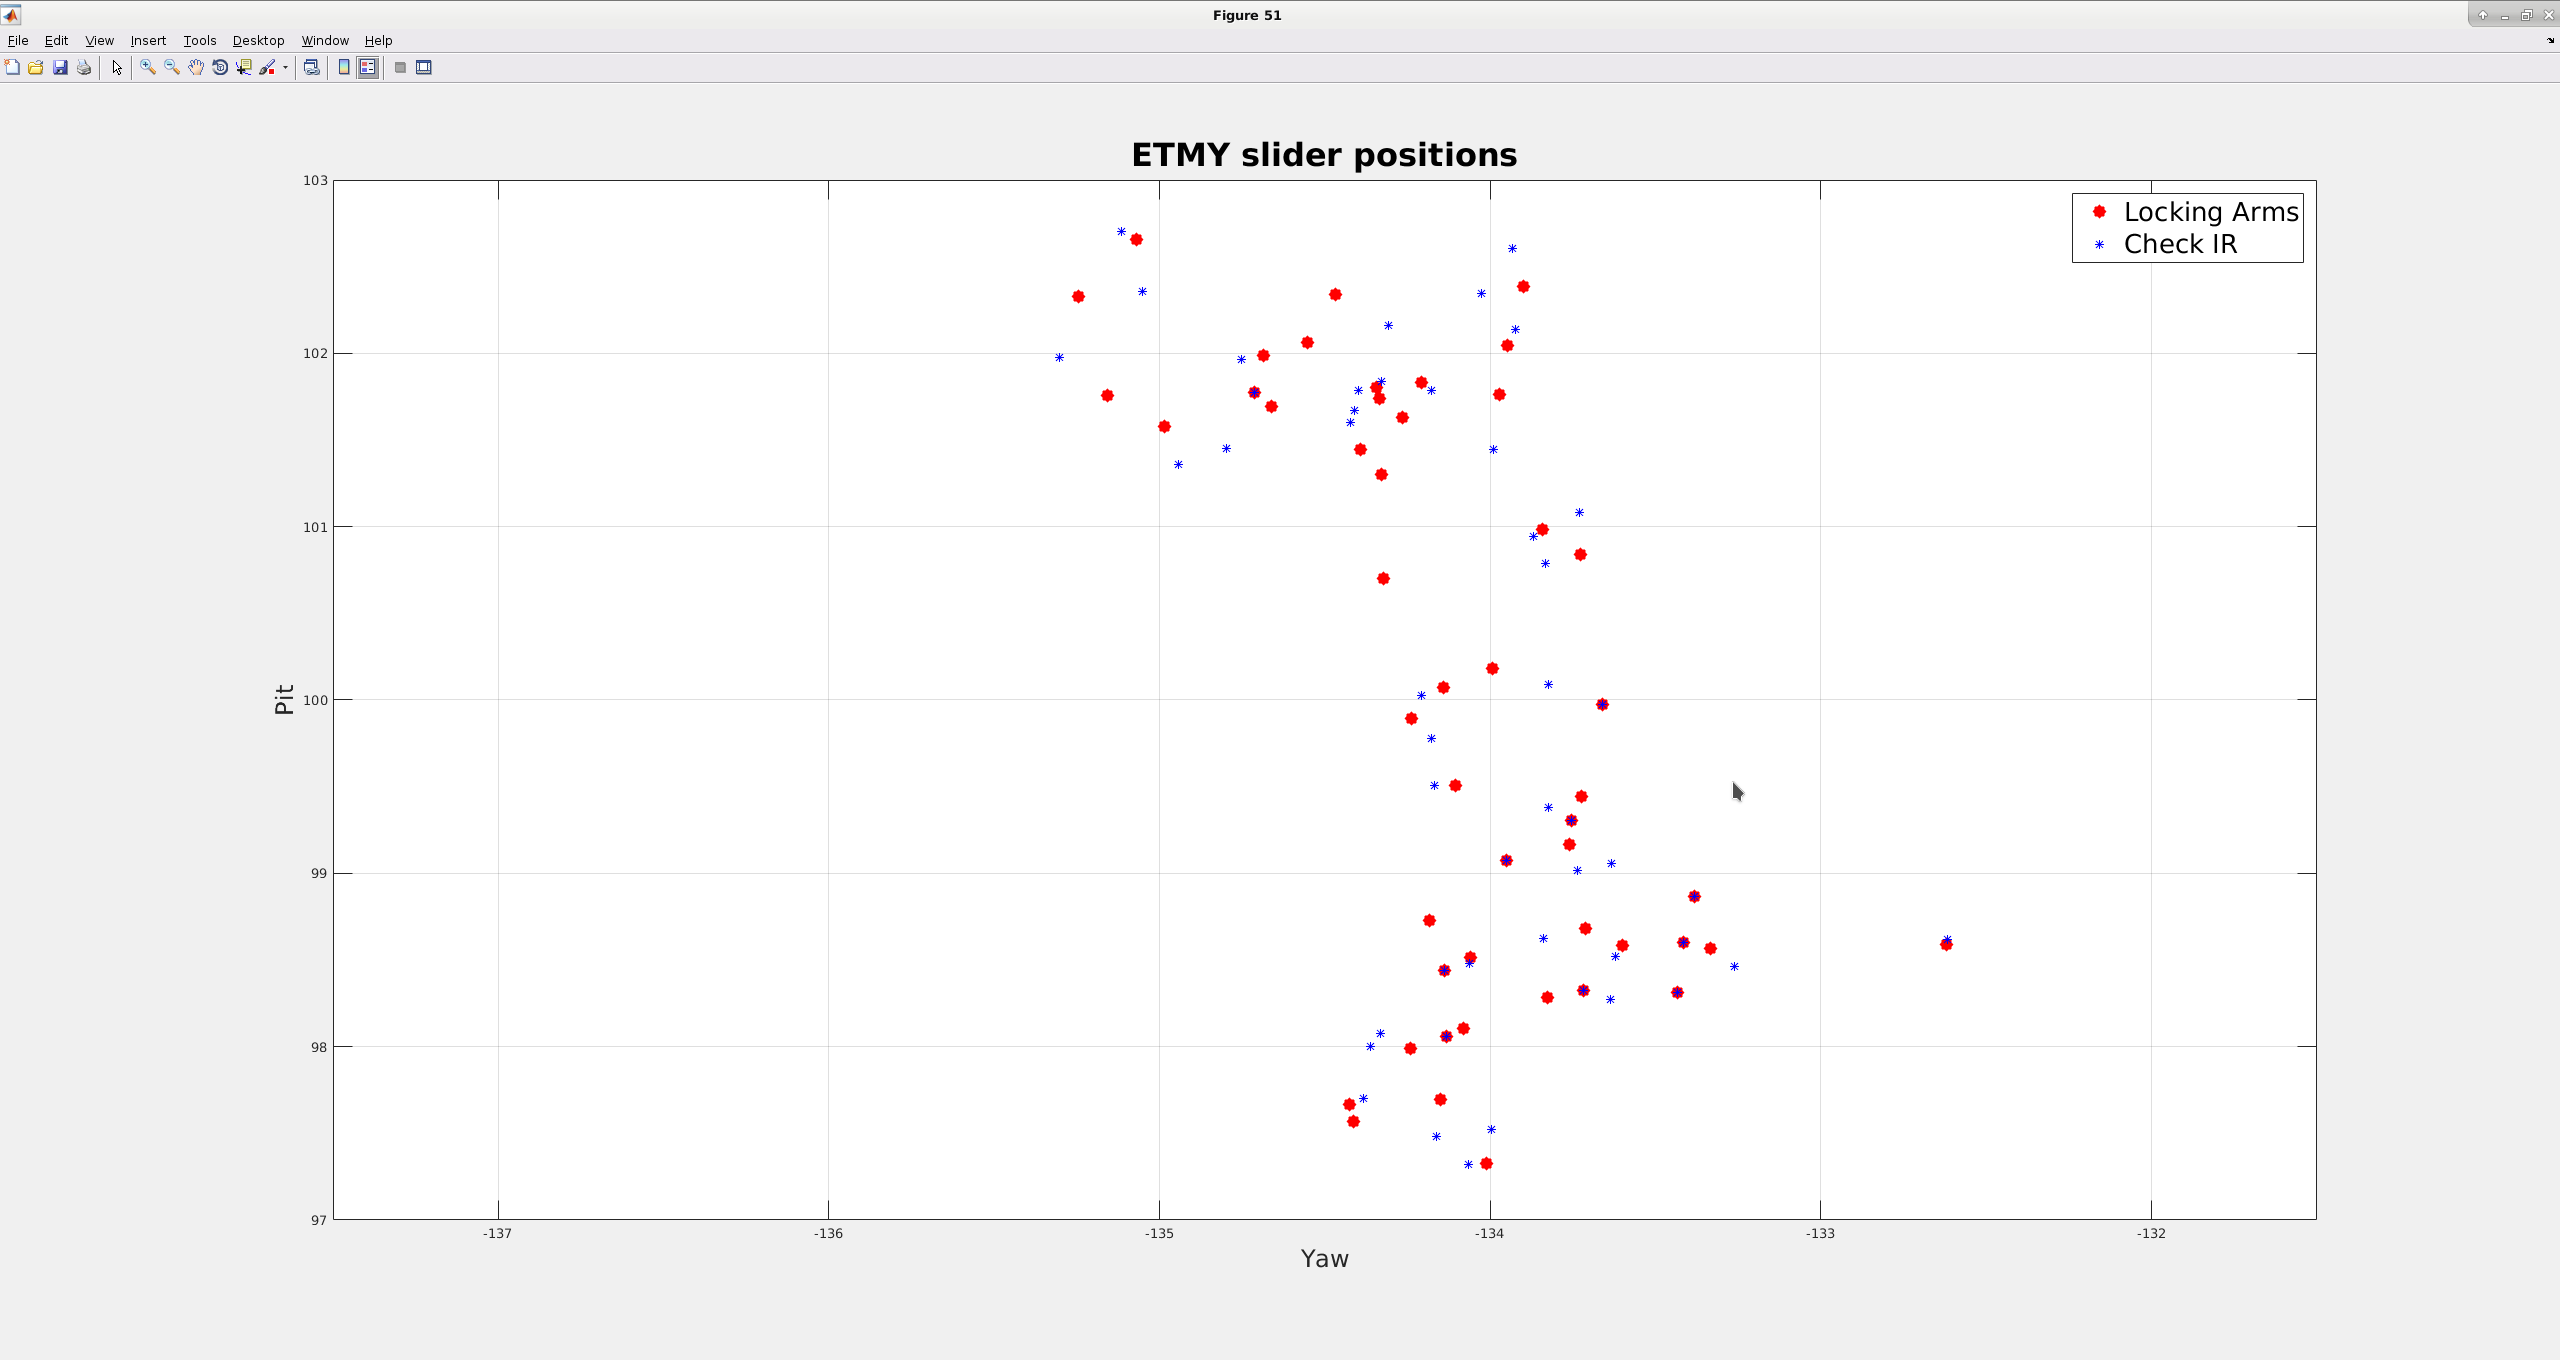
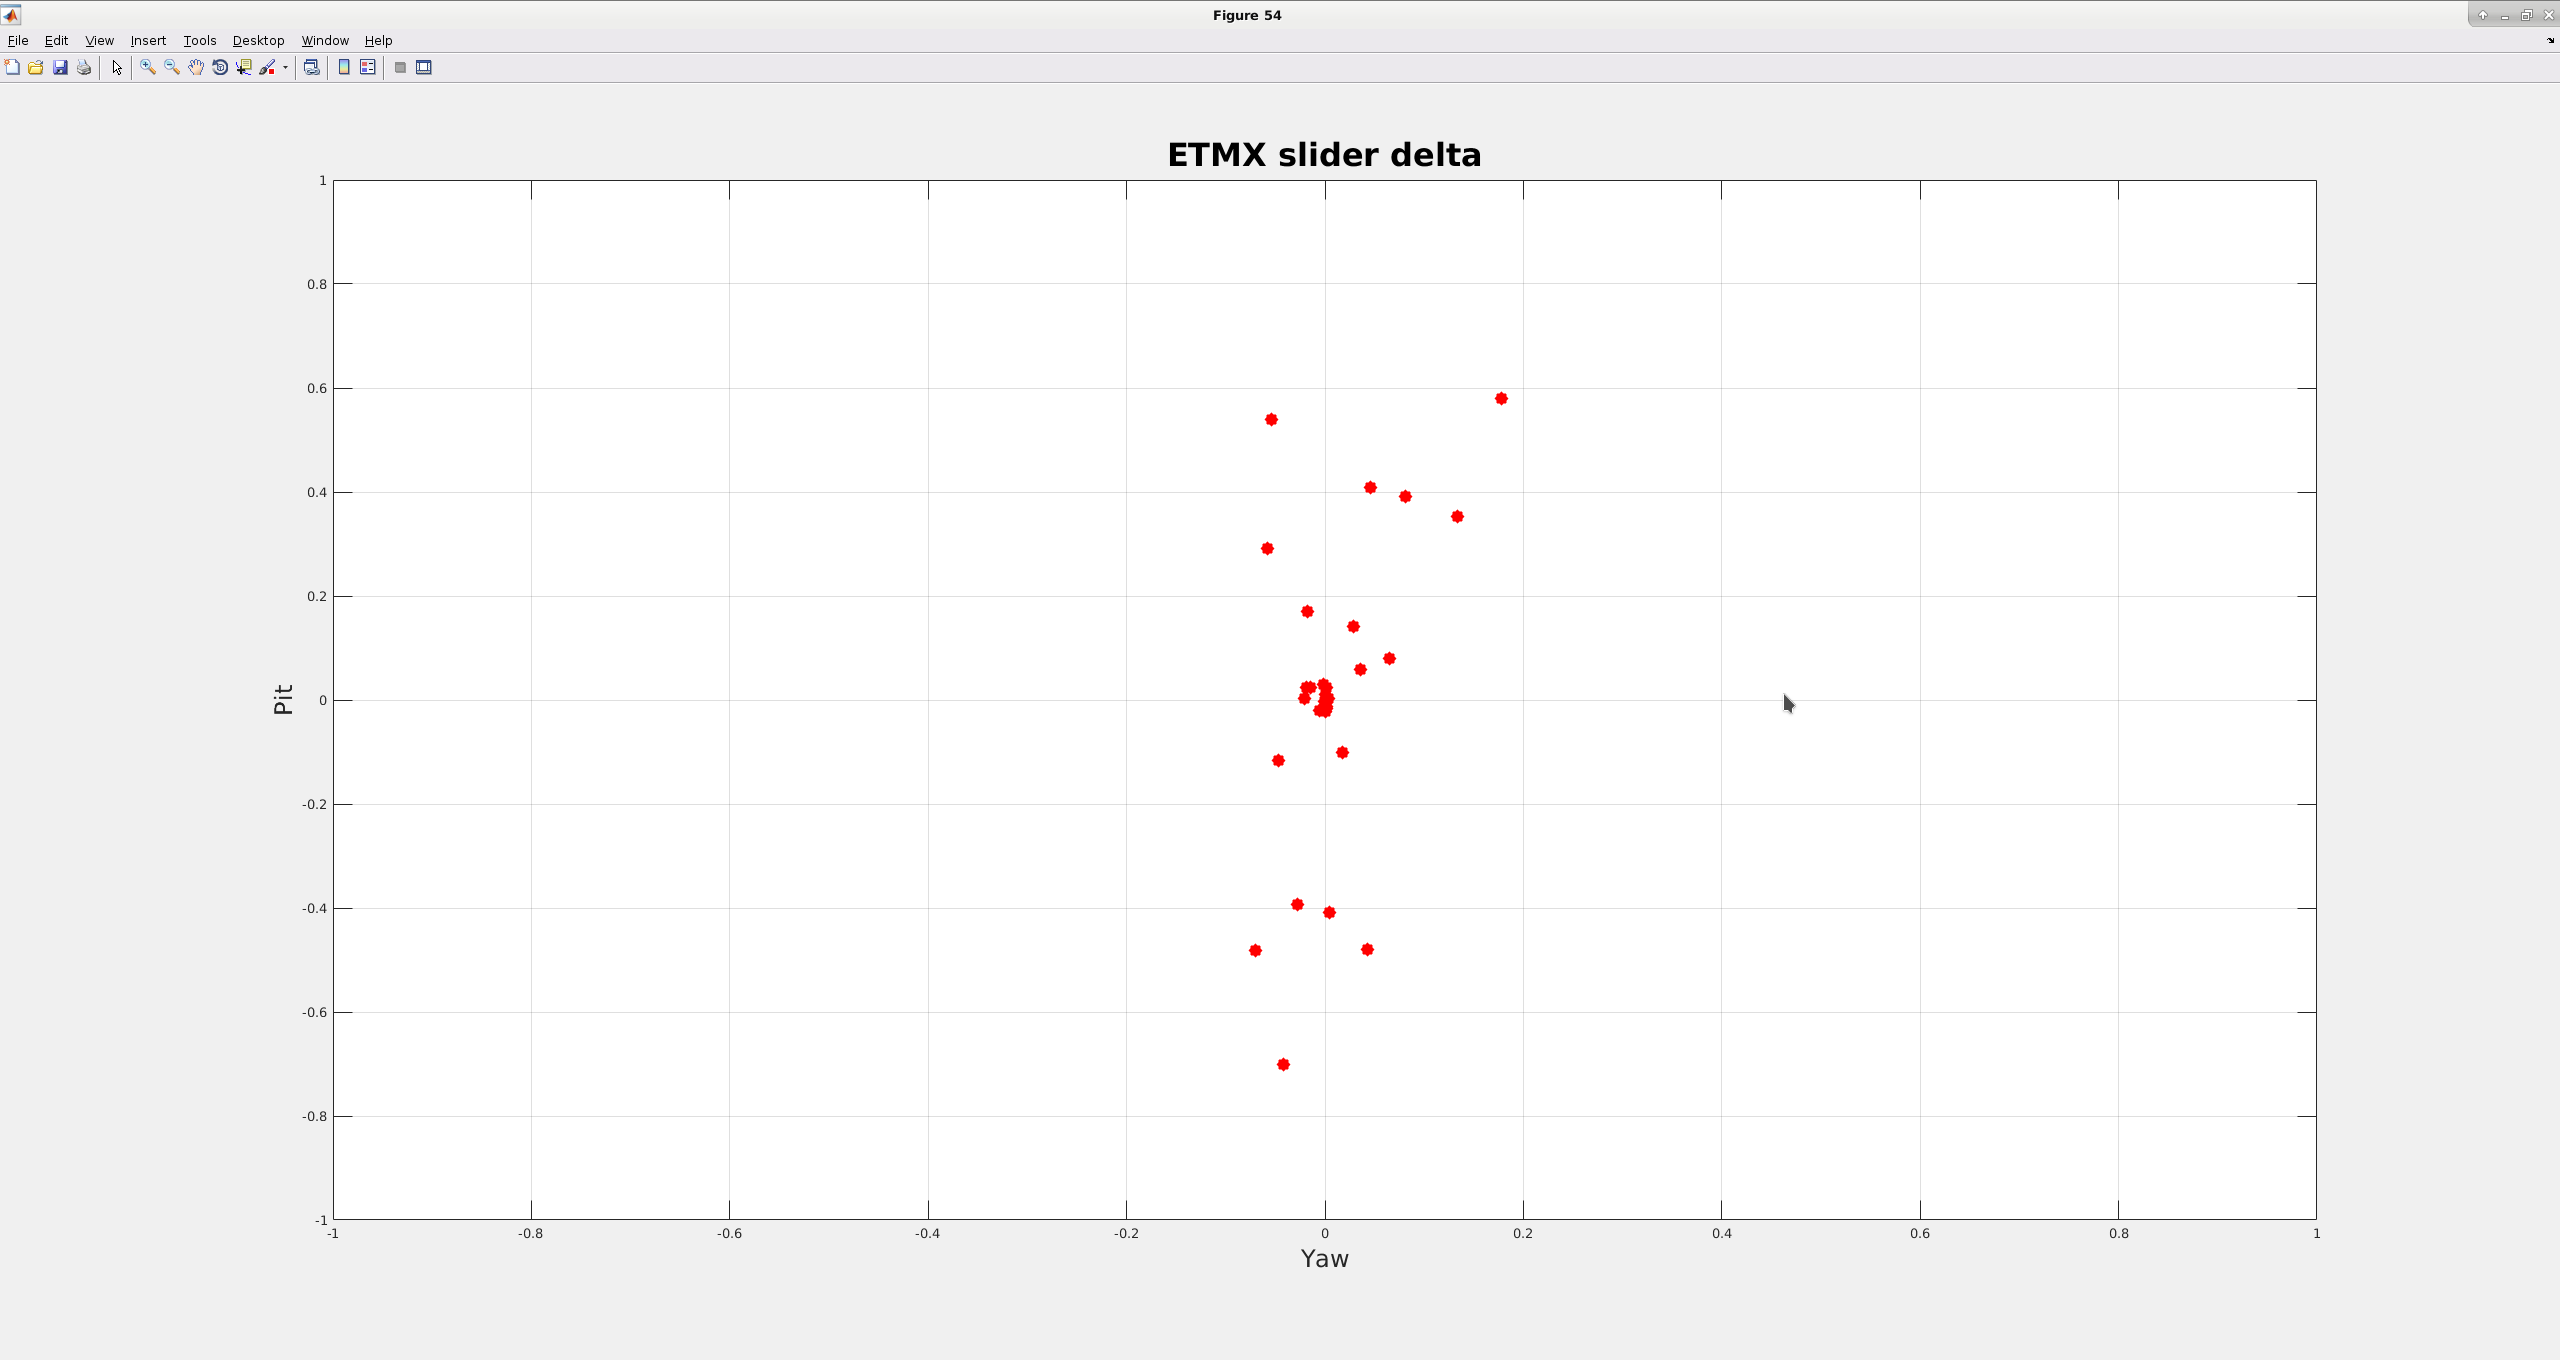
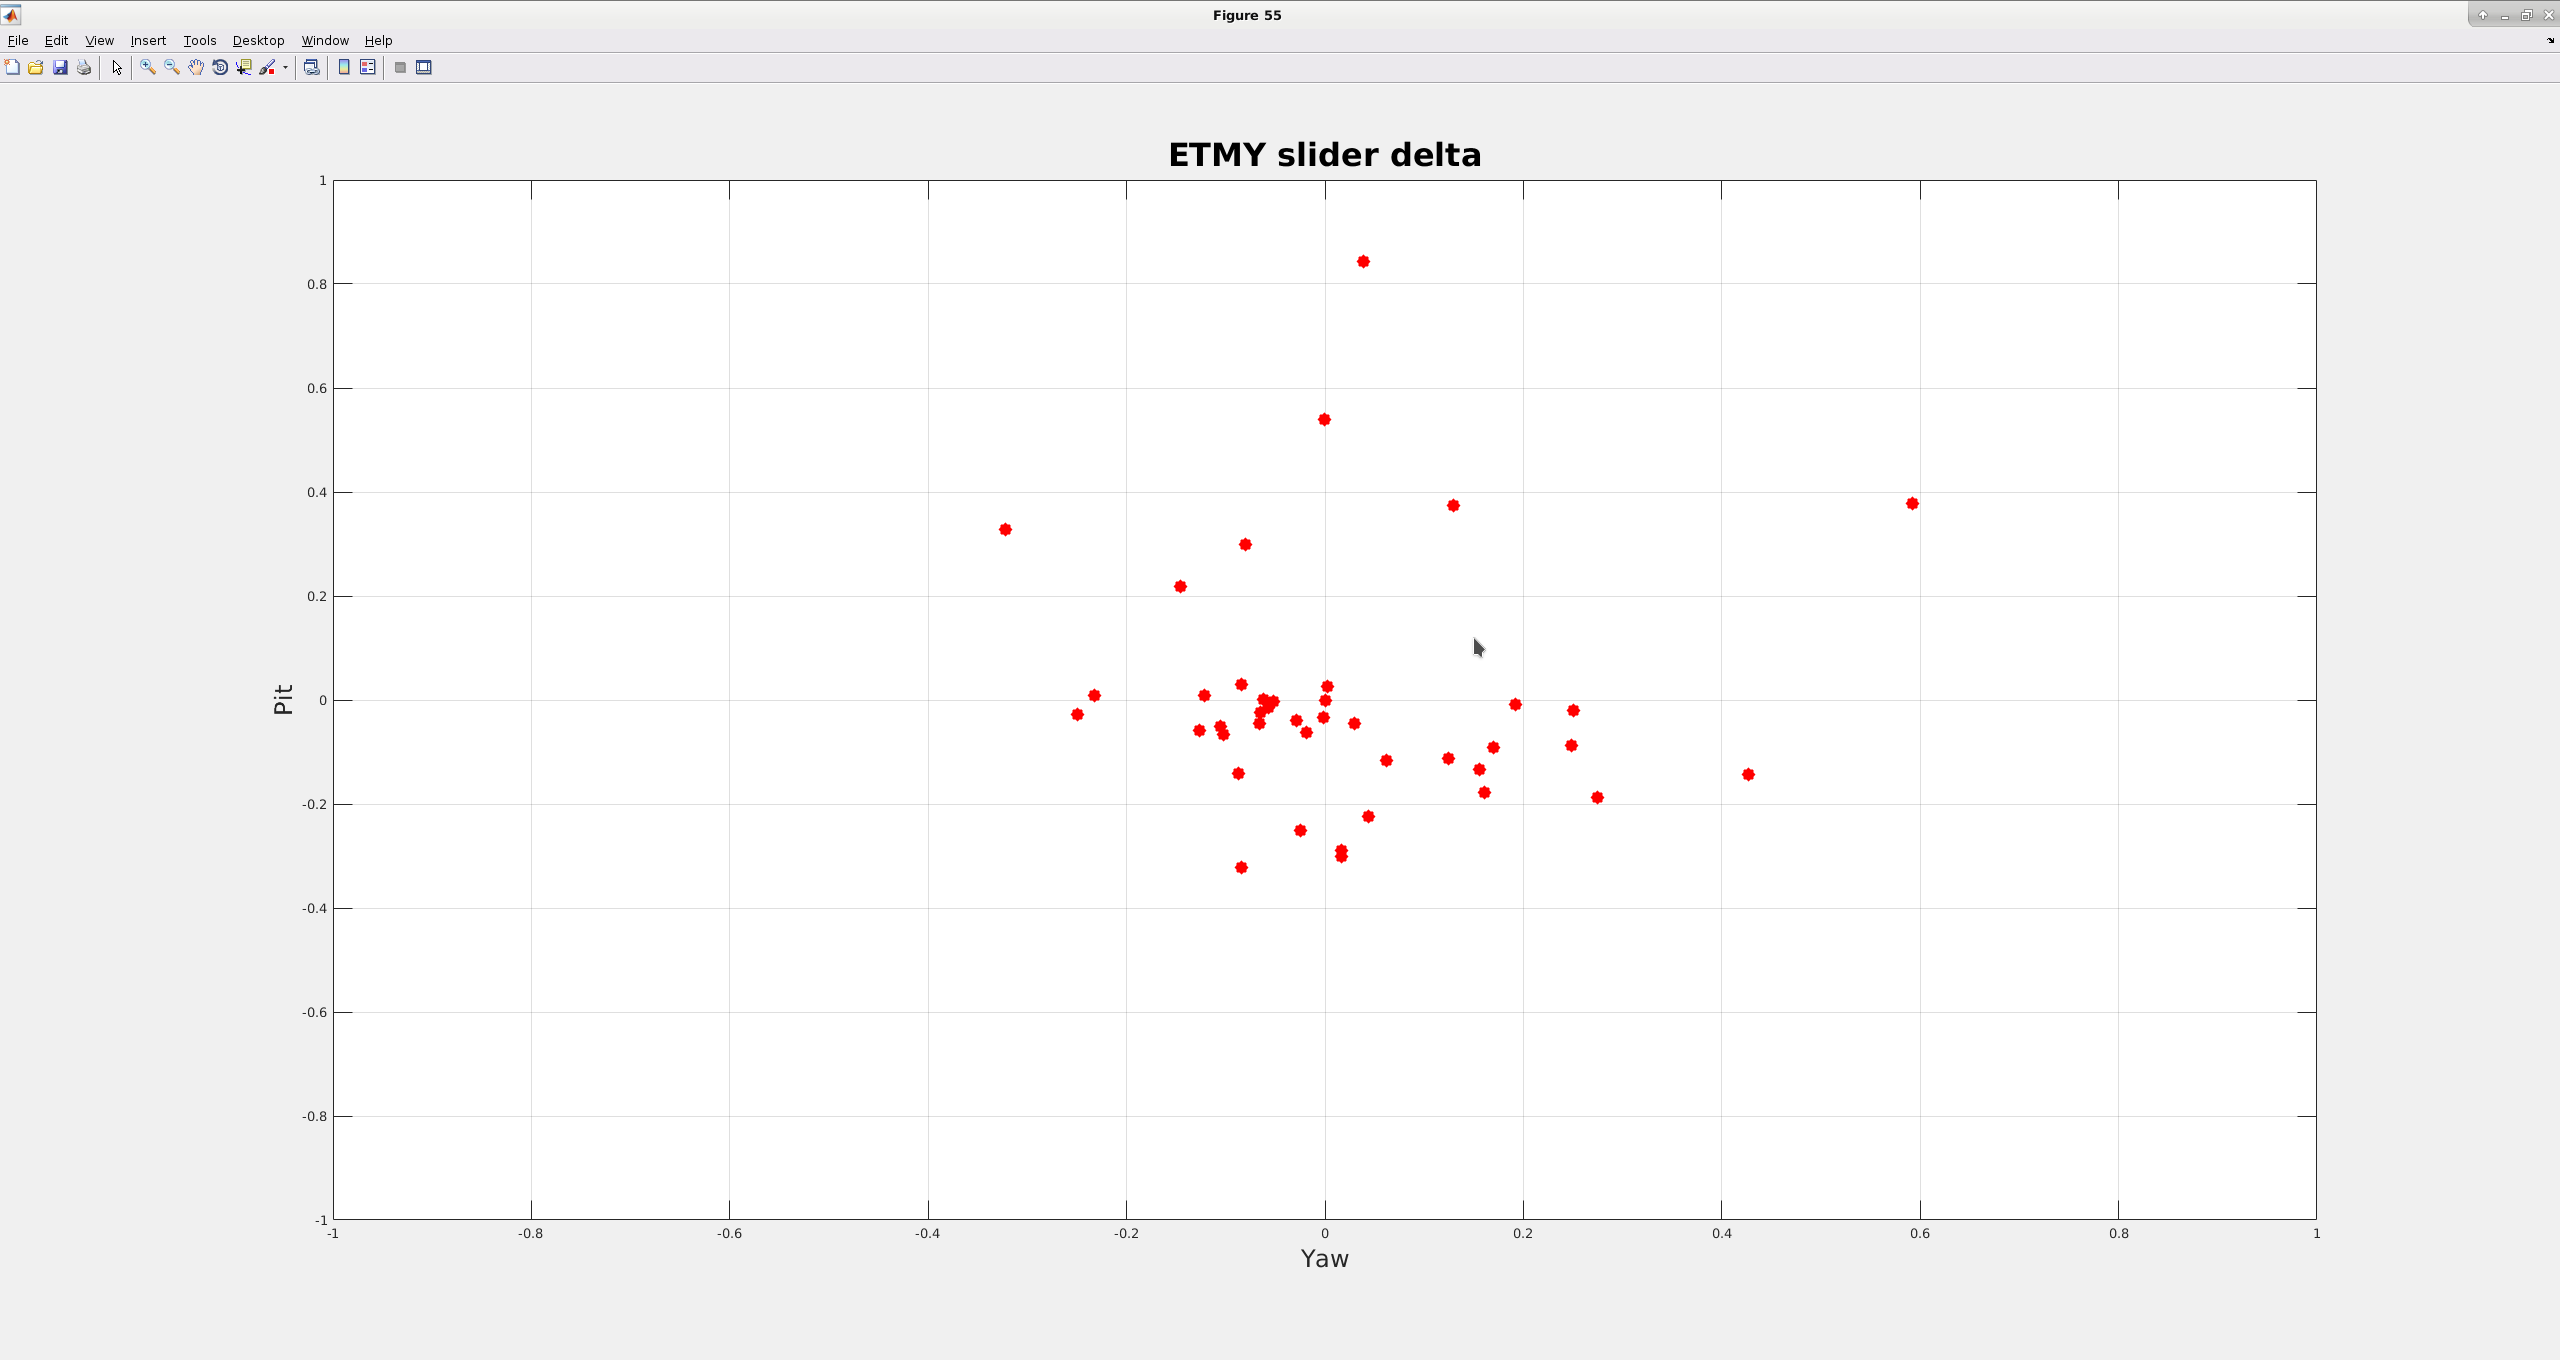
Third and fourth plots are the same points on a scatter plot, Yaw for the X-axis, Pit for the Y-axis. Again, the red dots are for LOCKING_ARMS_GREEN, blue are the slider positions at CHECK_IR. It's interesting that the dispersion for ETMX is tighter than ETMY, I've scaled the x and y limits so they are scaled the same. You can also see the jump in the ETMX Yaw alignment.
Plots 5 and 6 are differences between the two states for each lock attempt, so each dot represents the change in the slide value for a particular lock. Overall, ETMY (plot 6) seems more or less evenly distributed about the center, though if you remove the biggest deltas, you could say that the scatter is more dispersed in yaw than pitch. ETMX (plot 5) clearly mostly scatters in pitch though. The range for ETMX pitch is about 1.4 microradians in pitch, while for yaw its about .4 microradians.