jeffrey.kissel@LIGO.ORG - posted 17:29, Monday 02 December 2019 - last comment - 19:20, Thursday 05 December 2019(53632)
ETMX Actuator Strength Update: Changes that look Odd, But Probably Inconsequential
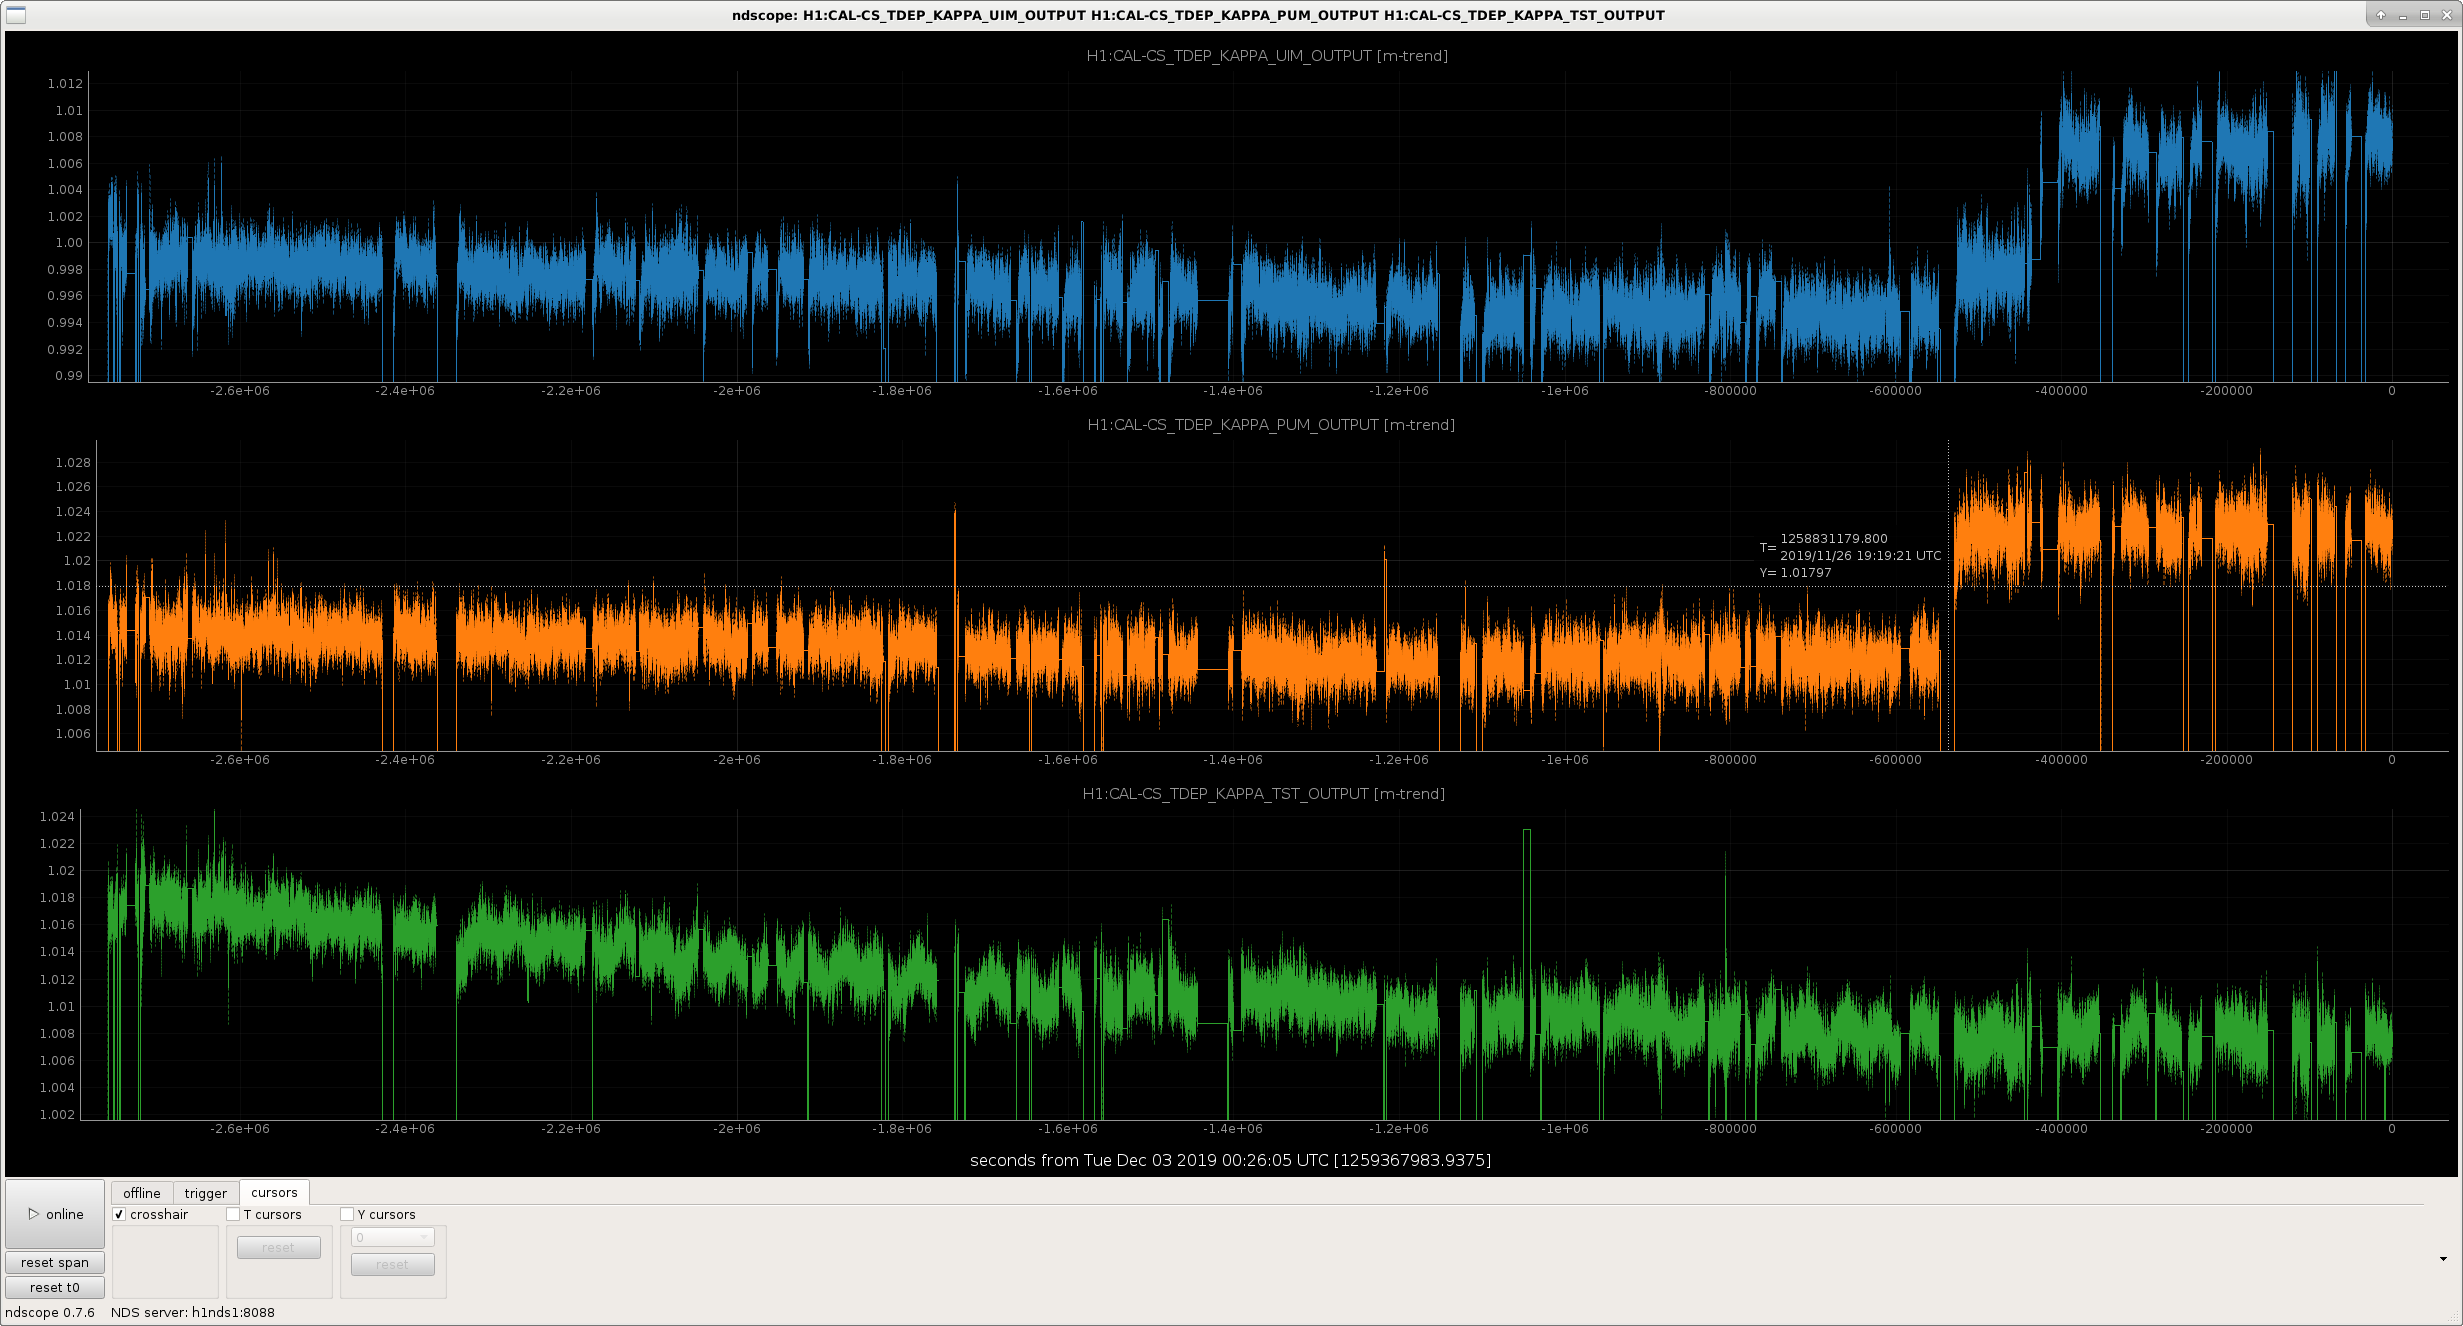
J. Kissel

I've processed the ETMX longitudinal actuation strength data from 2019-11-11 (see day-of LHO aLOG 53162) for each of the three stages. In doing so, I've trended the front-end produced time-dependent correction factors to see if the systematic error between "the actuator strength used in the currently-still-in-use 2019-09-09 model" (which is actually the same numbers we've been using since the start of O3 in April 2019) and "the fit to the 2019-11-11 data" is small (i.e. the percent difference is unity). In short -- it's the perennial question: "anything that shows evidence that we need to update the model?" or, asked differently, "any evidence that the time dependent correction factors are not doing their job?"

Summary: All continues to be well-understood and accurate at the level of concern needed with the O3 ETMX actuator. But, beneath that level of concern, there are interesting things happening.

The attached .pdfs are the plots that show the fits to the 2019-11-11 data. Below is a table highlighting the results which help answer the above question:
                               UIM              PUM               TST
    Reference Model           7.67e-08 (N/ct)  6.036e-10 (N/ct)  4.727e-12 (N/ct)
    MCMC Fit                  8.038e-08        6.086e-10         4.780e-12
    kappa via MCMC            1.0478           1.00824           1.01124
    kappa via CALCS           0.997            1.013             1.012
    Systematic Error          0.048%           -0.0047%          0.00075%
   (MCMC-CALCS)/MCMC


I was at first a bit alarmed by the 4% systematic error in the UIM, but the MCMC fit appears to be poor -- spoiled by the data point at 10 Hz -- so I've resumed a state of zen. Also, we've shown that a 5% scale factor systematic error on the UIM has no significant impact on the overall response function systematic error above 10 Hz, so even if the systematic error was real, I'd still brush it off.

The previous time this table was made was for the 2019-10-28 measurement. See LHO aLOG 52973. Then, all actuation fits agreed with TDCFs within 0.5%, so I argue that the TDCFs are tracking reality well.

Finally, the image attachment is a 1 month trend of the time-dependent correction factors, just because they turned out to be interesting -- but not consequential -- when I looked. The interesting points:
    (1) The high duty cycle from this month allows us to *clearly* resolve a six-hour period, 0.2% amplitude fluctuation in the ESD actuation strength. I attribute this to the first time LHO has demonstrably seen the impact of differential reaction-chain to main-chain distances changing due to tidal control. This change in chain-to-chain distance means the gap between reaction mass (the ESD pattern) and the test mass changes, thus impacting the ESD actuation strength. LLO regularly sees this because they drive all of their tidal control to *only* the main chain at the TOP mass level, as opposed to LHO which drives tidal to the UIM stage. This actuation strength fluctuation is real, noticeable, but at the 0.2% level, it doesn't really matter, especially since we're correcting for it.
    (2) The actuation strength as drifted down in 1 month, from 1.018 to its current value of 1.008. Again, inconsequential, because we correct for it, but I wonder what effect is causing this slow drift. I can think of three things that would evolve on that time scale: vacuum pressure, residual charge, and ambient temperature. The former two won't have changed over the course of the month, but trending further back in time reveals that that was a ~1% increase in drive strength between the end of O3A and the start of O3B, and the strength appears to just be returning to that level. The ambient temperature has changed for the colder over this month...
    (3) There has been significant step function in the PUM *and* UIM actuation strength, at the ~1% level after the 2019-11-26 the maintenance day break. The only activity that day at the end stations was powering up and leaving on the NCAL, setting up a PEM instrumentation array around it, and Robert making scattered light investigations. I could believe that the former two might have some electrical effect in the strength... but it's shear speculation.

I'll be gathering a new set of data this Wednesday to continue the assessment, and confirm that we see this ~1% increase in the sweeps as well. I suspect it will.
Images attached to this report
Non-image files attached to this report

Comments related to this report
In the above entry, I confusingly say
    I've trended the [... TDCFs ...] to see if systematic error between [ ... the model of the actuation strength ...] and [the fit to this new data] is small (i.e. the percent difference is unity).

I meant either
    - "the percent difference is close to zero" where percent difference is 100*[({new data fit} - model) / model] or
    - "the ratio is unity," where the ratio is {new data fit} / model
and in my haste convolved the two.

And then, I totally botched the reporting of the percent difference, adding the *label* for %, without actually multiplying by 100.

For example, for the TST stage TDCF, the percent difference is
    100 * (1.01124 - 1.012) / 1.012 = -0.075, and thus "0.075%"
and the ratio is just
    1.01124 / 1.012 = 0.9992


Sorry for the confusion! It's too late for me to edit the entry proper, so please forgive the error and interpret with the corresponding grain of salt.