jeffrey.kissel@LIGO.ORG - posted 18:19, Tuesday 10 December 2019 - last comment - 18:38, Tuesday 10 December 2019(53824)
First attempt at measuring Sensing Function Detuning while IFO is Thermalizing: Medium Success
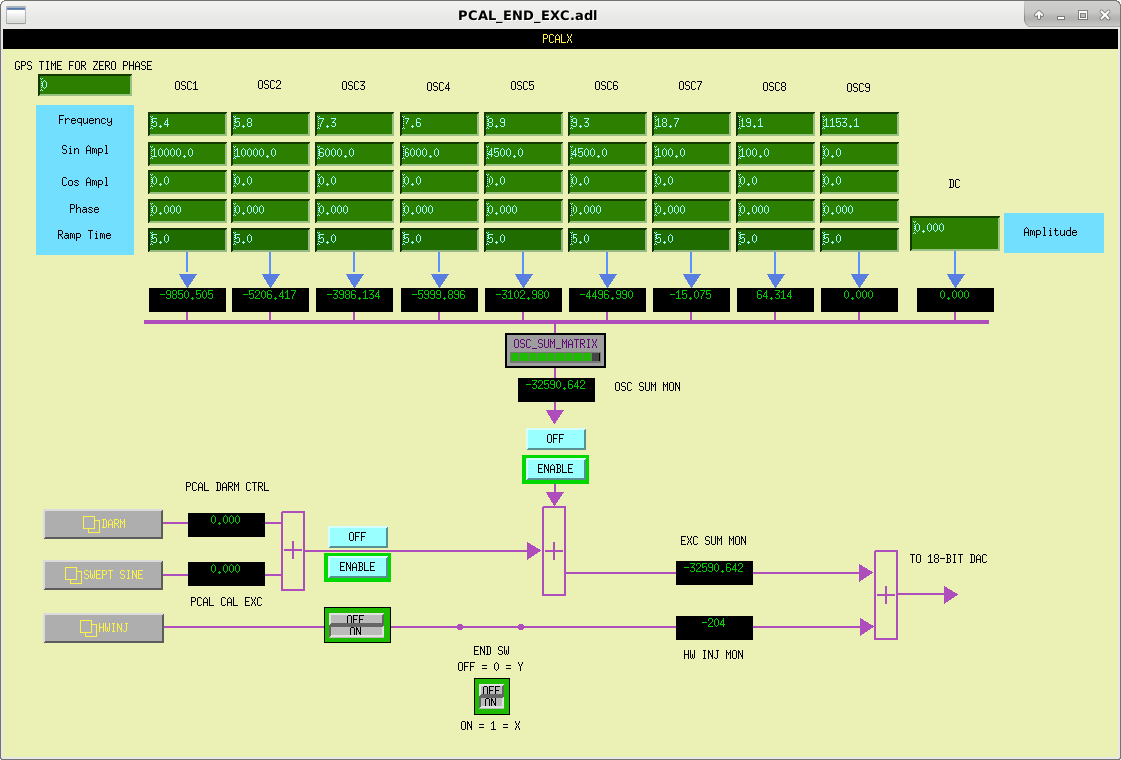
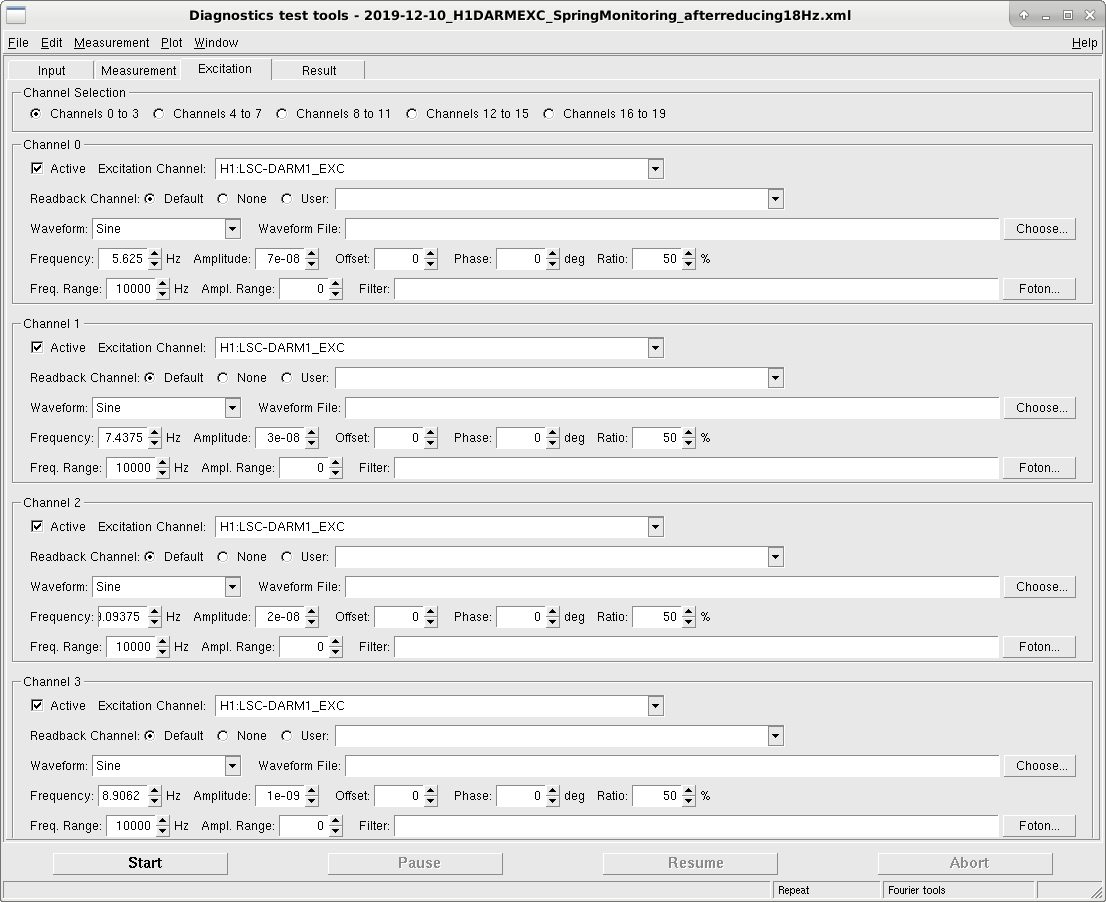
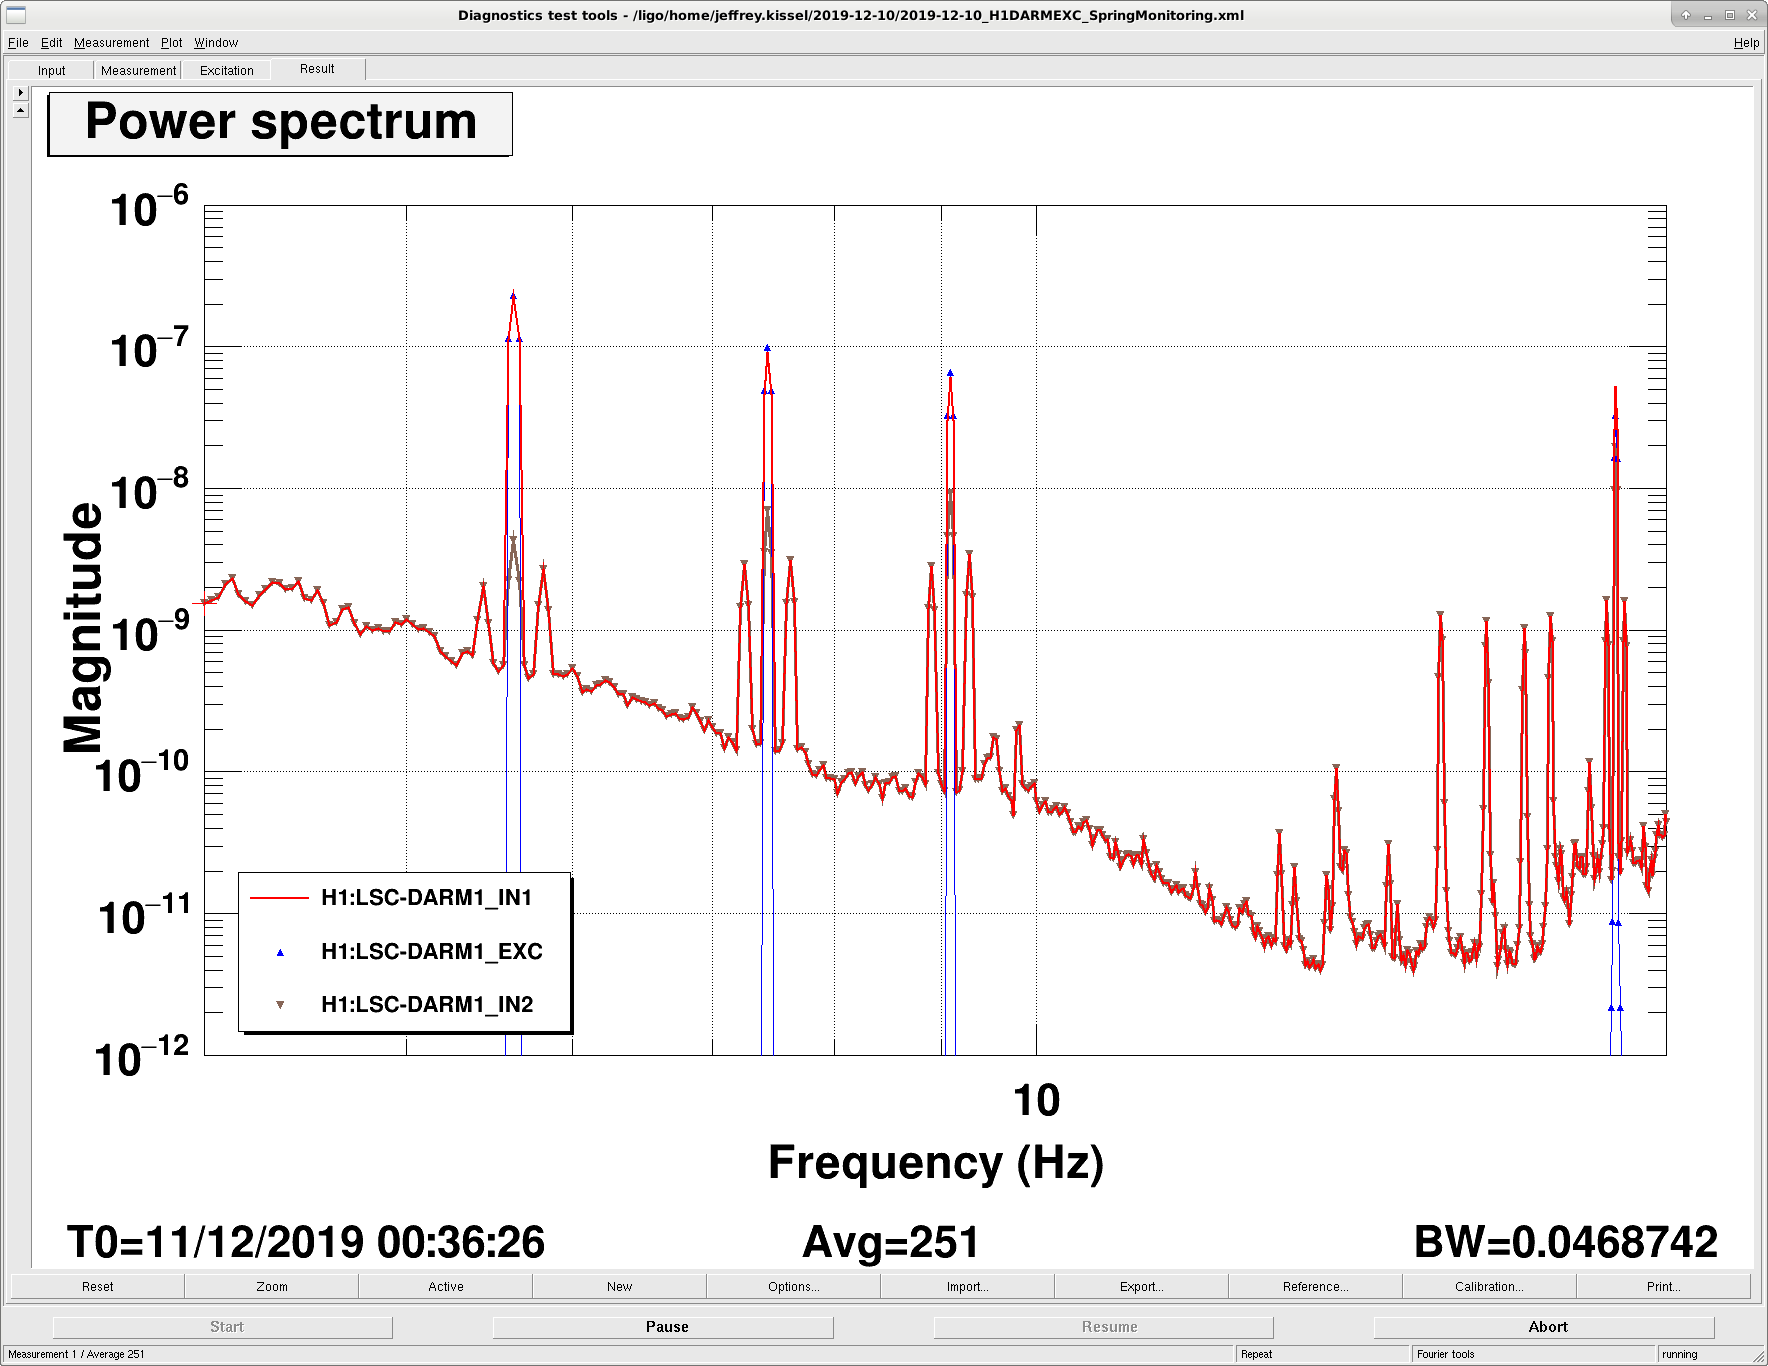
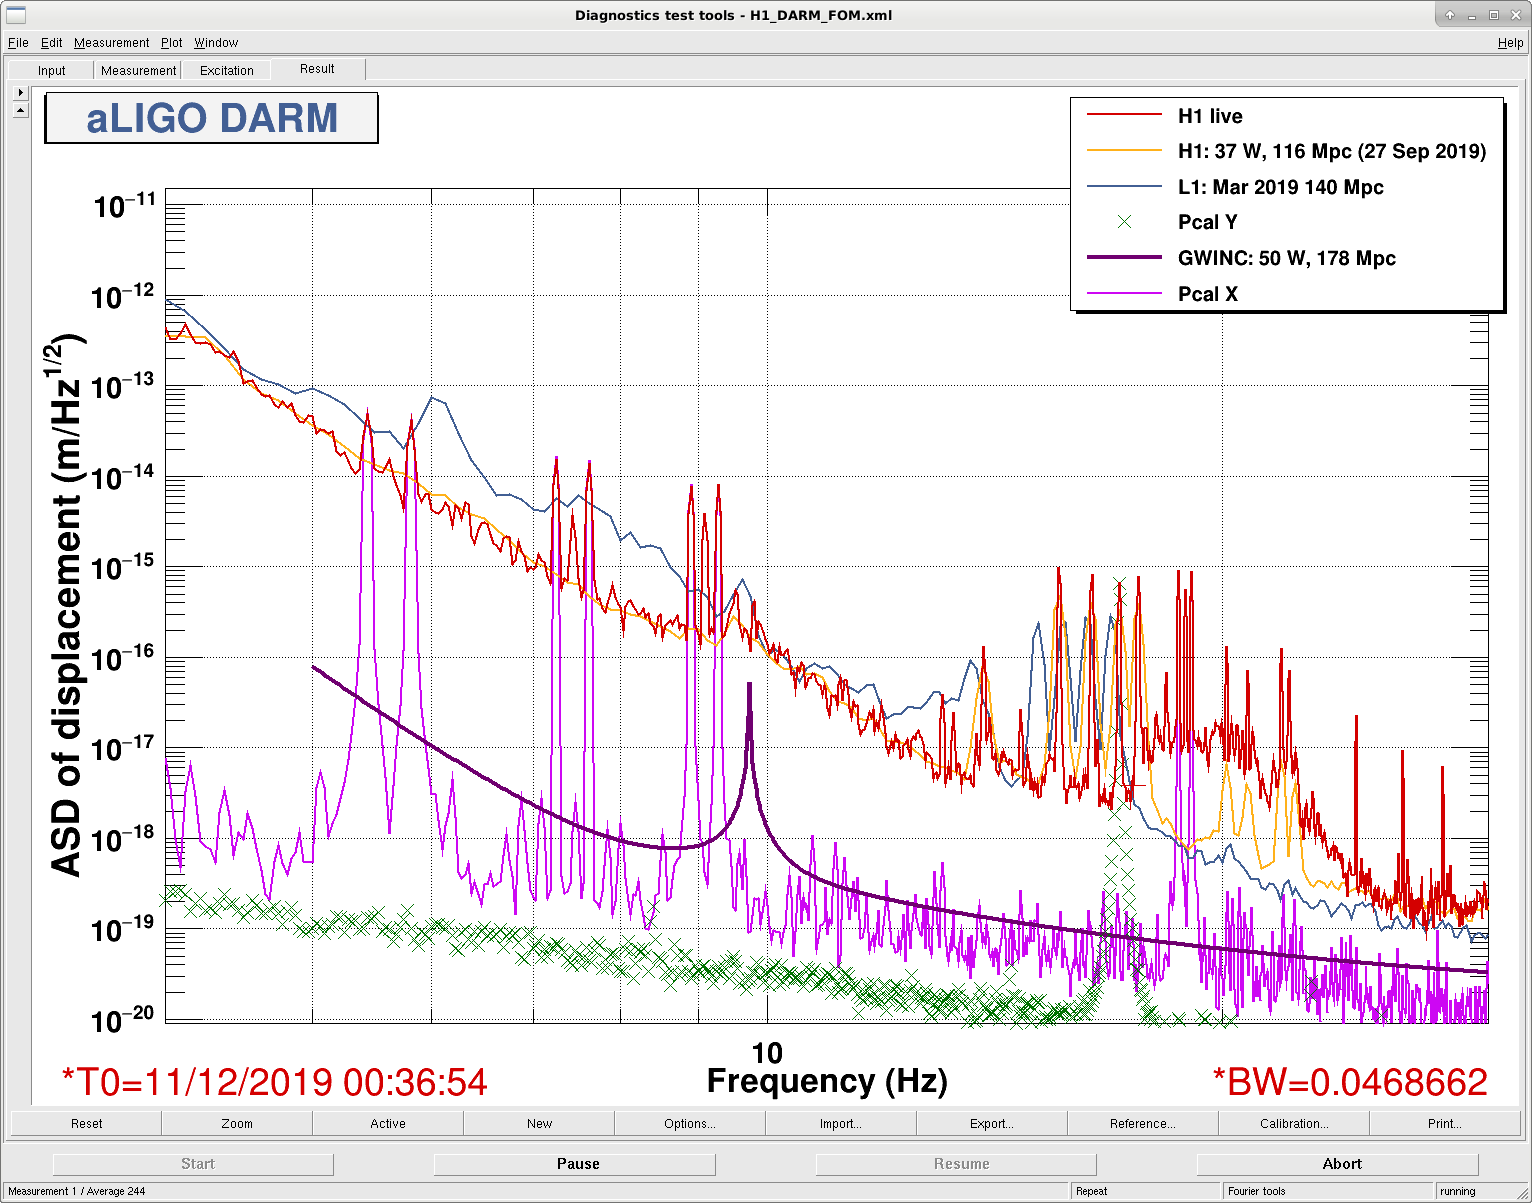
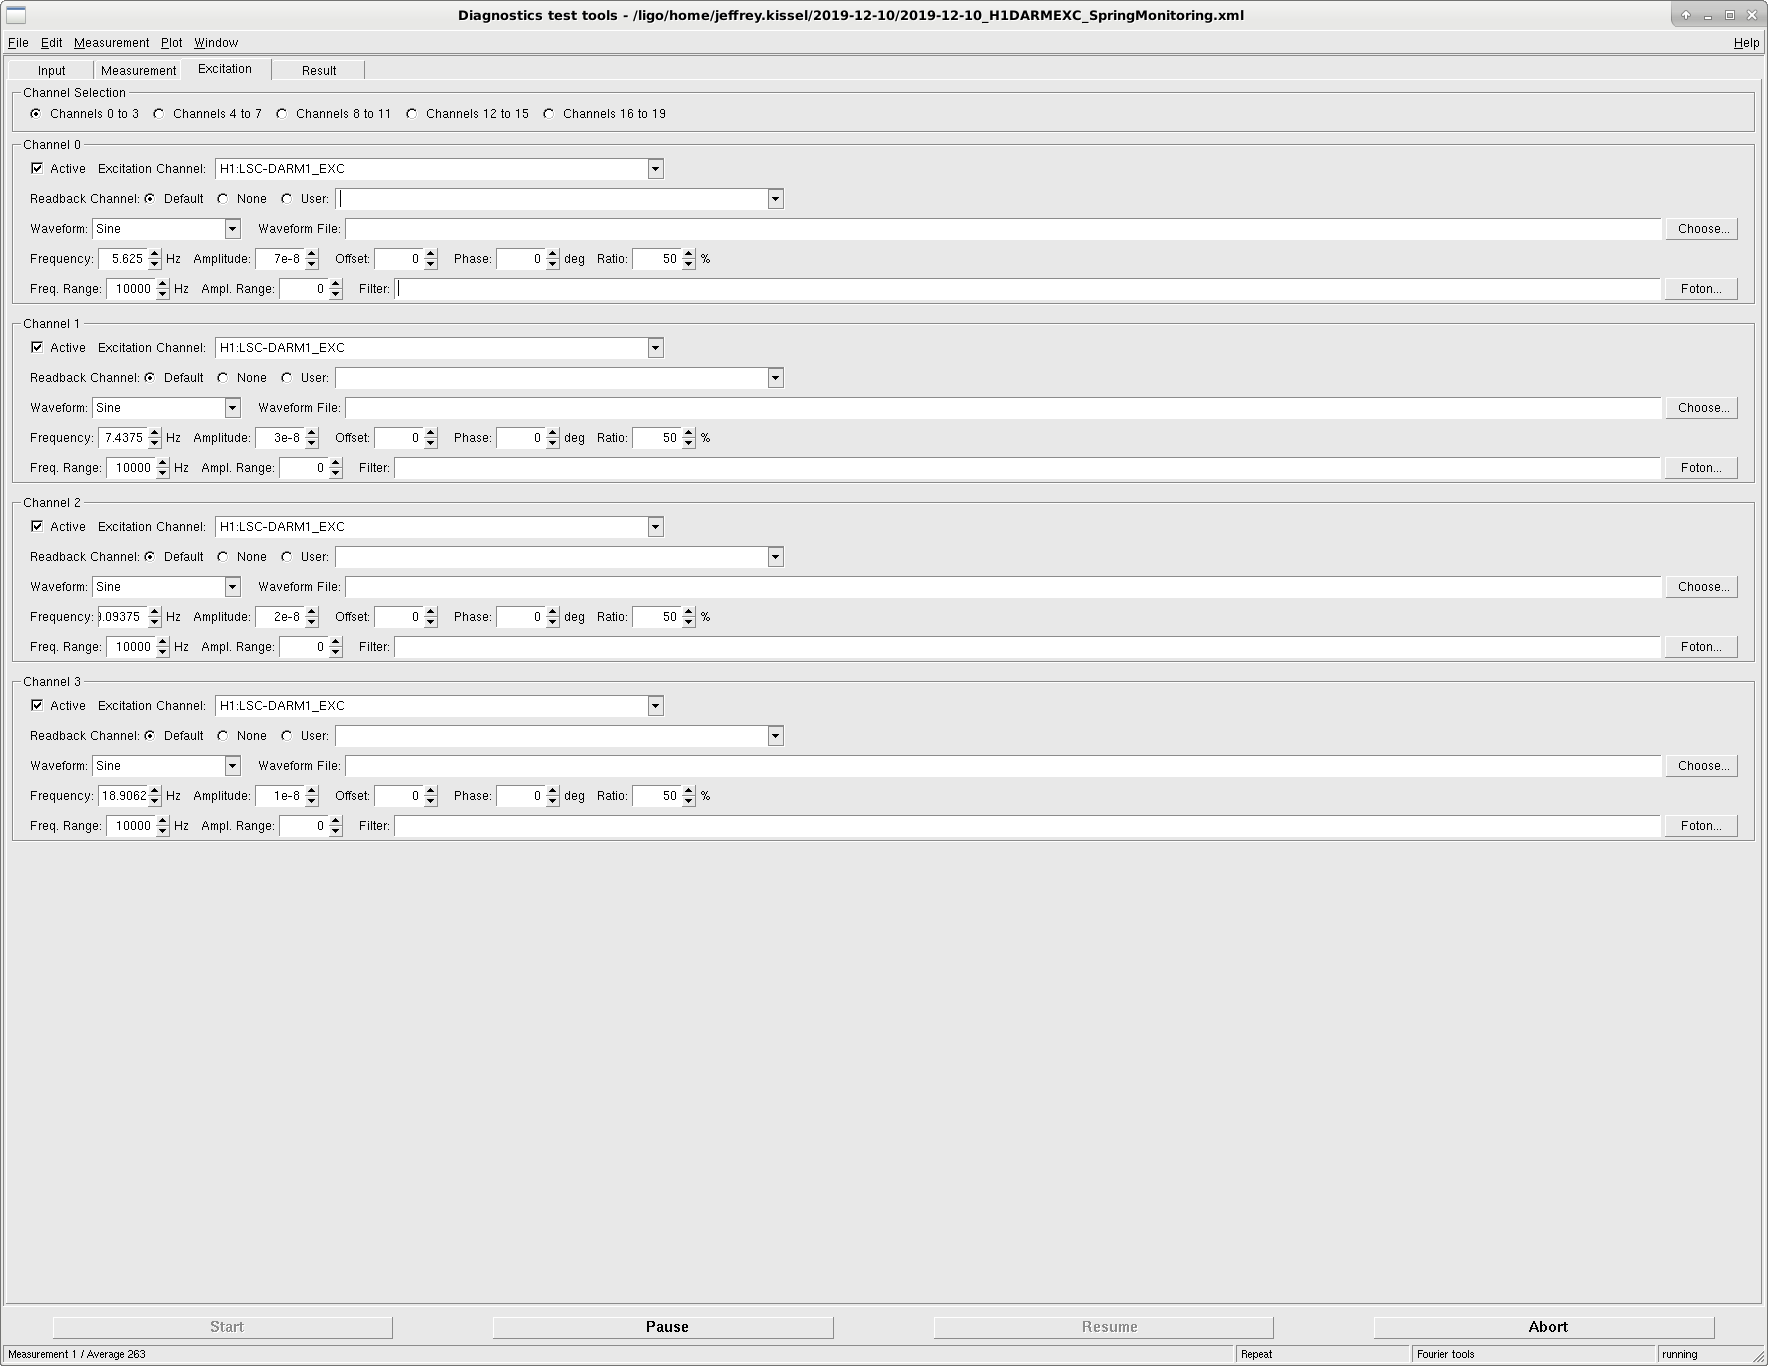
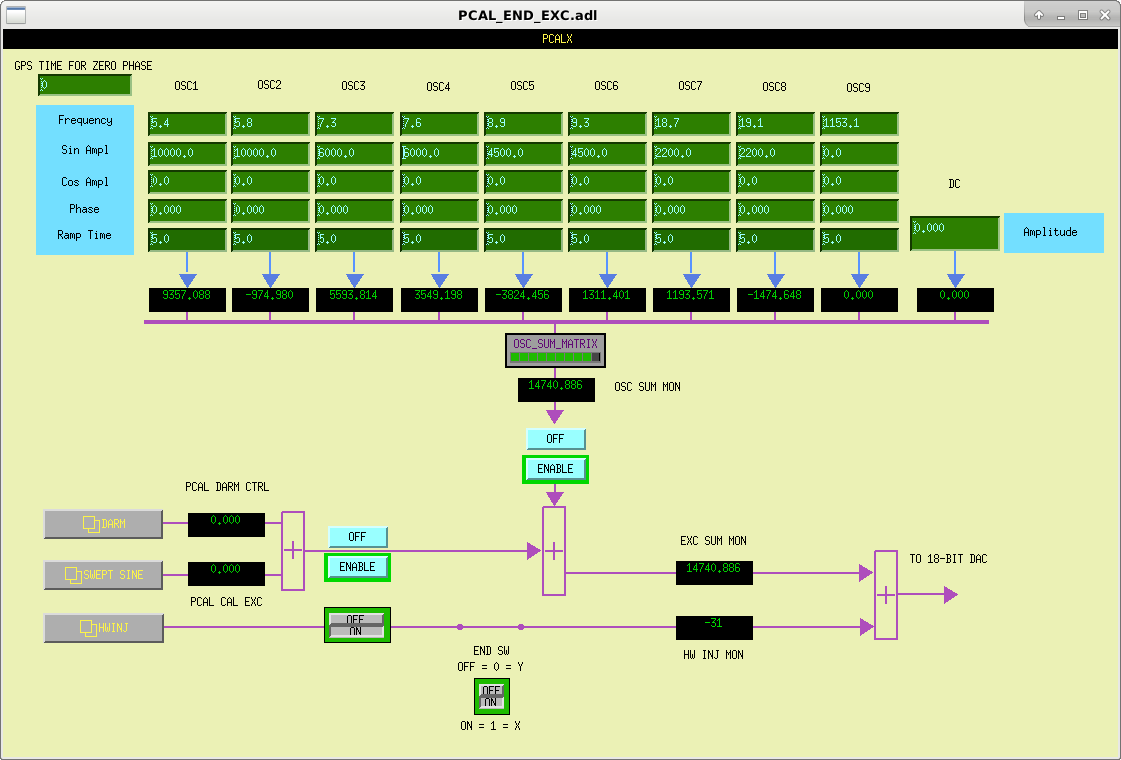
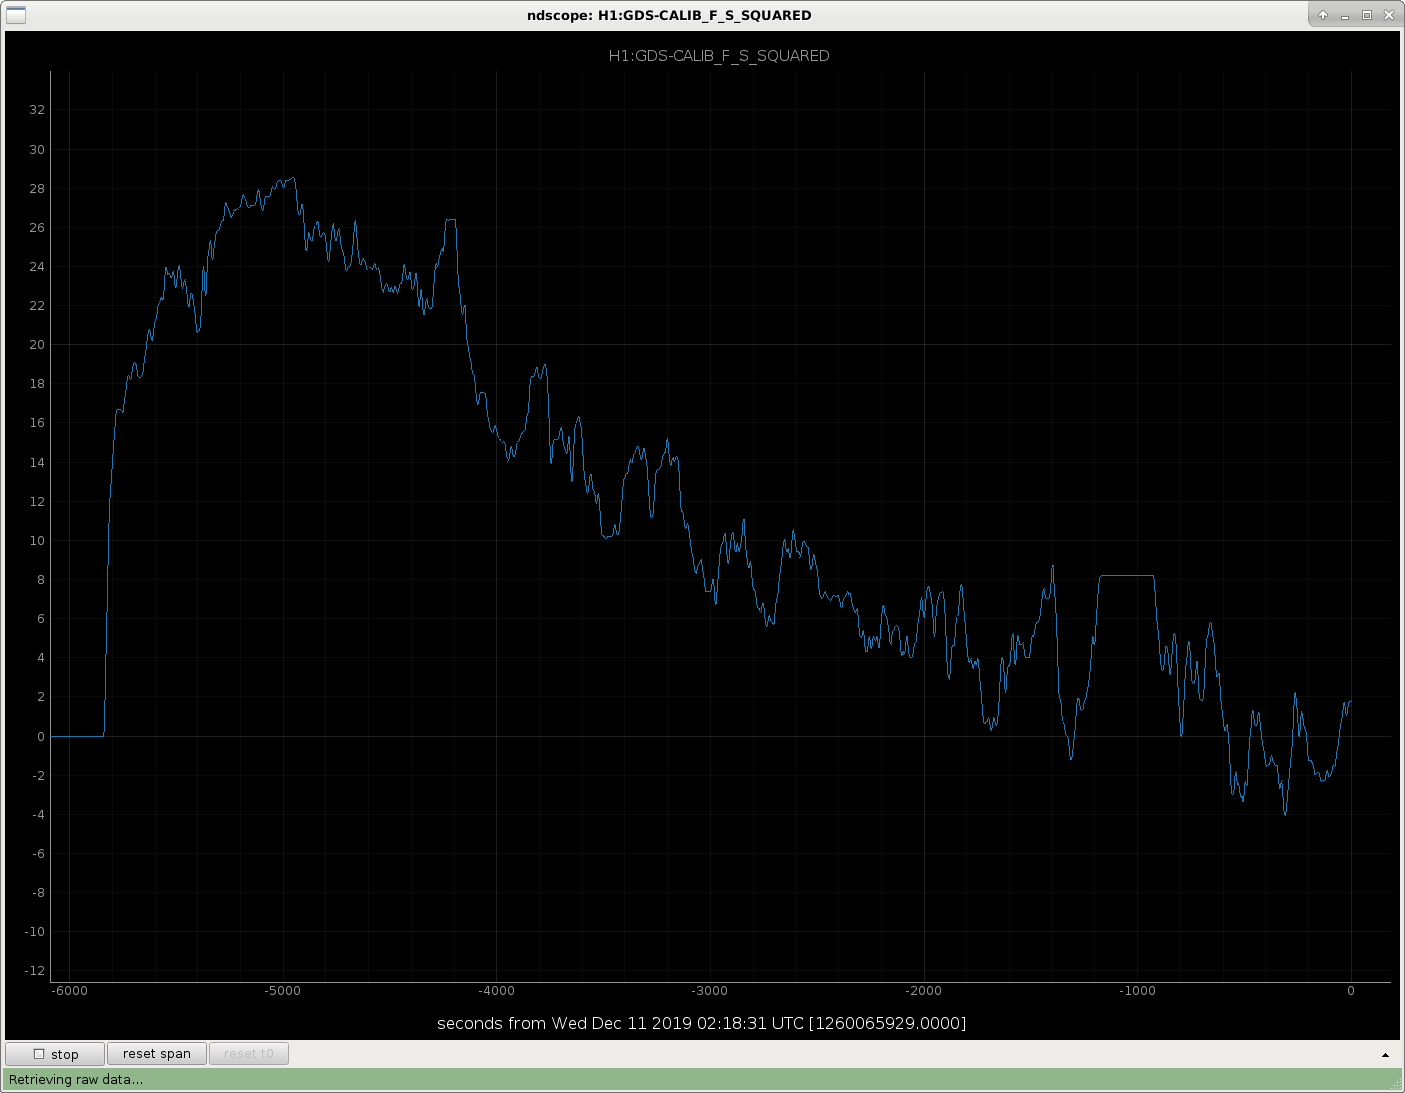
J. Kissel

Today, I tried to characterize / confirm the systematic error in the calibration that has been observed in PCAL to h(t) during the first ~hours of a nominal low noise stretch. Many more details about the effect, and what's been observed to date in yesterday's LHO aLOG 53775.

I've done so by driving clusters of new calibration lines at 4 new frequencies to measure the DARM Loop Suppression (1 / [1+G]), and surrounding them with PCAL X lines, in order to measure the loop-suppressed sensing function (i.e. the response function), ( C / [1+G] ).
I left these lines on during the entire lock acquisition process beyond DC readout, and for ~1.5 hours in to a nominal low noise stretch, in order to track the change over the entire apparent evolution of the detuning / L2A2L effect.

Here's why I say this was medium successful -- (G) == good news, (B) == bad news:
    (G1) I was able to find frequencies and tune amplitudes for the PCAL and DARM lines, such that we can easily repeat the test.
    (B1) *this* (start of the) NLN stretch had to be run with one less stage of whitening, because the ~18 Hz DARM line I put in was still too loud (I didn't want to change it mid power up, and only found out it was too loud after hitting nominal low noise)
    (B2) Because the line was close to saturating either the ESD DAC or the OMC DCPD's ADC, there were huge amounts of non-linear shoulders, which bled in to the ADS lines, which mean the spot position steering didn't go as well, or as fast as it normally does. We had to increase the ADS lines by a factor of 10, and reduce the ADS loop gains by a factor of ten.
    (B3) I had not checked this before starting the test, but essential channels for post processing, DARM1_IN2 and DARM1_EXC are not stored in the frames. So, I won't be able to truly plot the sensing funciton, C, alone -- only the loop suppressed sensing function, C / (1+G).
    (G2) But, at least with the new frequency points of PCALX, we should be able to at least corroborate what has been seen at 17.1 Hz PCALY line for the whole run.
    (B4) Likely, the 5.6 Hz, 7.4 Hz, and 9.1 Hz clusters of calibration lines are too loop suppressed, because G is too large by 5 Hz, so we'll only be measuring C/G = 1/(AD), which we know isn't changing. To truly expose the effects, we *need* the (1/[1+G]) measurement, as we do in the swept sign measurements.

So -- because I sucked up ~2 hours of IFO time with this data set, I'm going to analyze it anyways, but I really hope to:
    (A) Modify the h1omc front-end model such that DARM1_EXC, and DARM1_EXC are stored in the frames, and
    (B) Redo the measurement with [i] the 18 Hz line reduced by a factor of 10.

Time of data analysis start: Dec 11 2019 00:38:42 UTC
Time of data analysis stop: Dec 11 2019 02:19:00 UTC (or when ever we're back in nominal low noise.)

Exact frequencies used:
    5.4375-5.625-5.8125, 7.250-7.74375-7.625, 8.90625-9.09375-9.28125, 18.7188-18.9062-19.0938
where they're listed as PCALX - DARM - PCALX frequency clusters, and they were chosen to be bin-centered for a 30sec (0.03 Hz BW) FFT, assuming 50% overlap with a hanning window.
Images attached to this report
Comments related to this report
As a close out test, I quickly reduced the 18 Hz cluster by lots, then turned ON the final stage of OMC whitening, reduced the ADS lines to normal, and increased the ADS gains to normal, and confirmed that all was well and happy. So, all the saturation problems and huge shoulders were all solved by just backing off on the amplitude the 18 Hz cluster. Thus, the next time we do this, we can run in a mouch more normal configuration.

I attach the PCALX and DARM line settings after reducing the 18 Hz cluster.

These are what should be used in the future -- after we get DARM1_IN2 and DARM1_EXC stored in the frames.
Images attached to this comment