cheryl.vorvick@LIGO.ORG - posted 22:07, Wednesday 11 December 2019 (53851)
Mid-Shift Update and PSL and PSL chiller trends, before chiller swap to current
H1 in Observe.
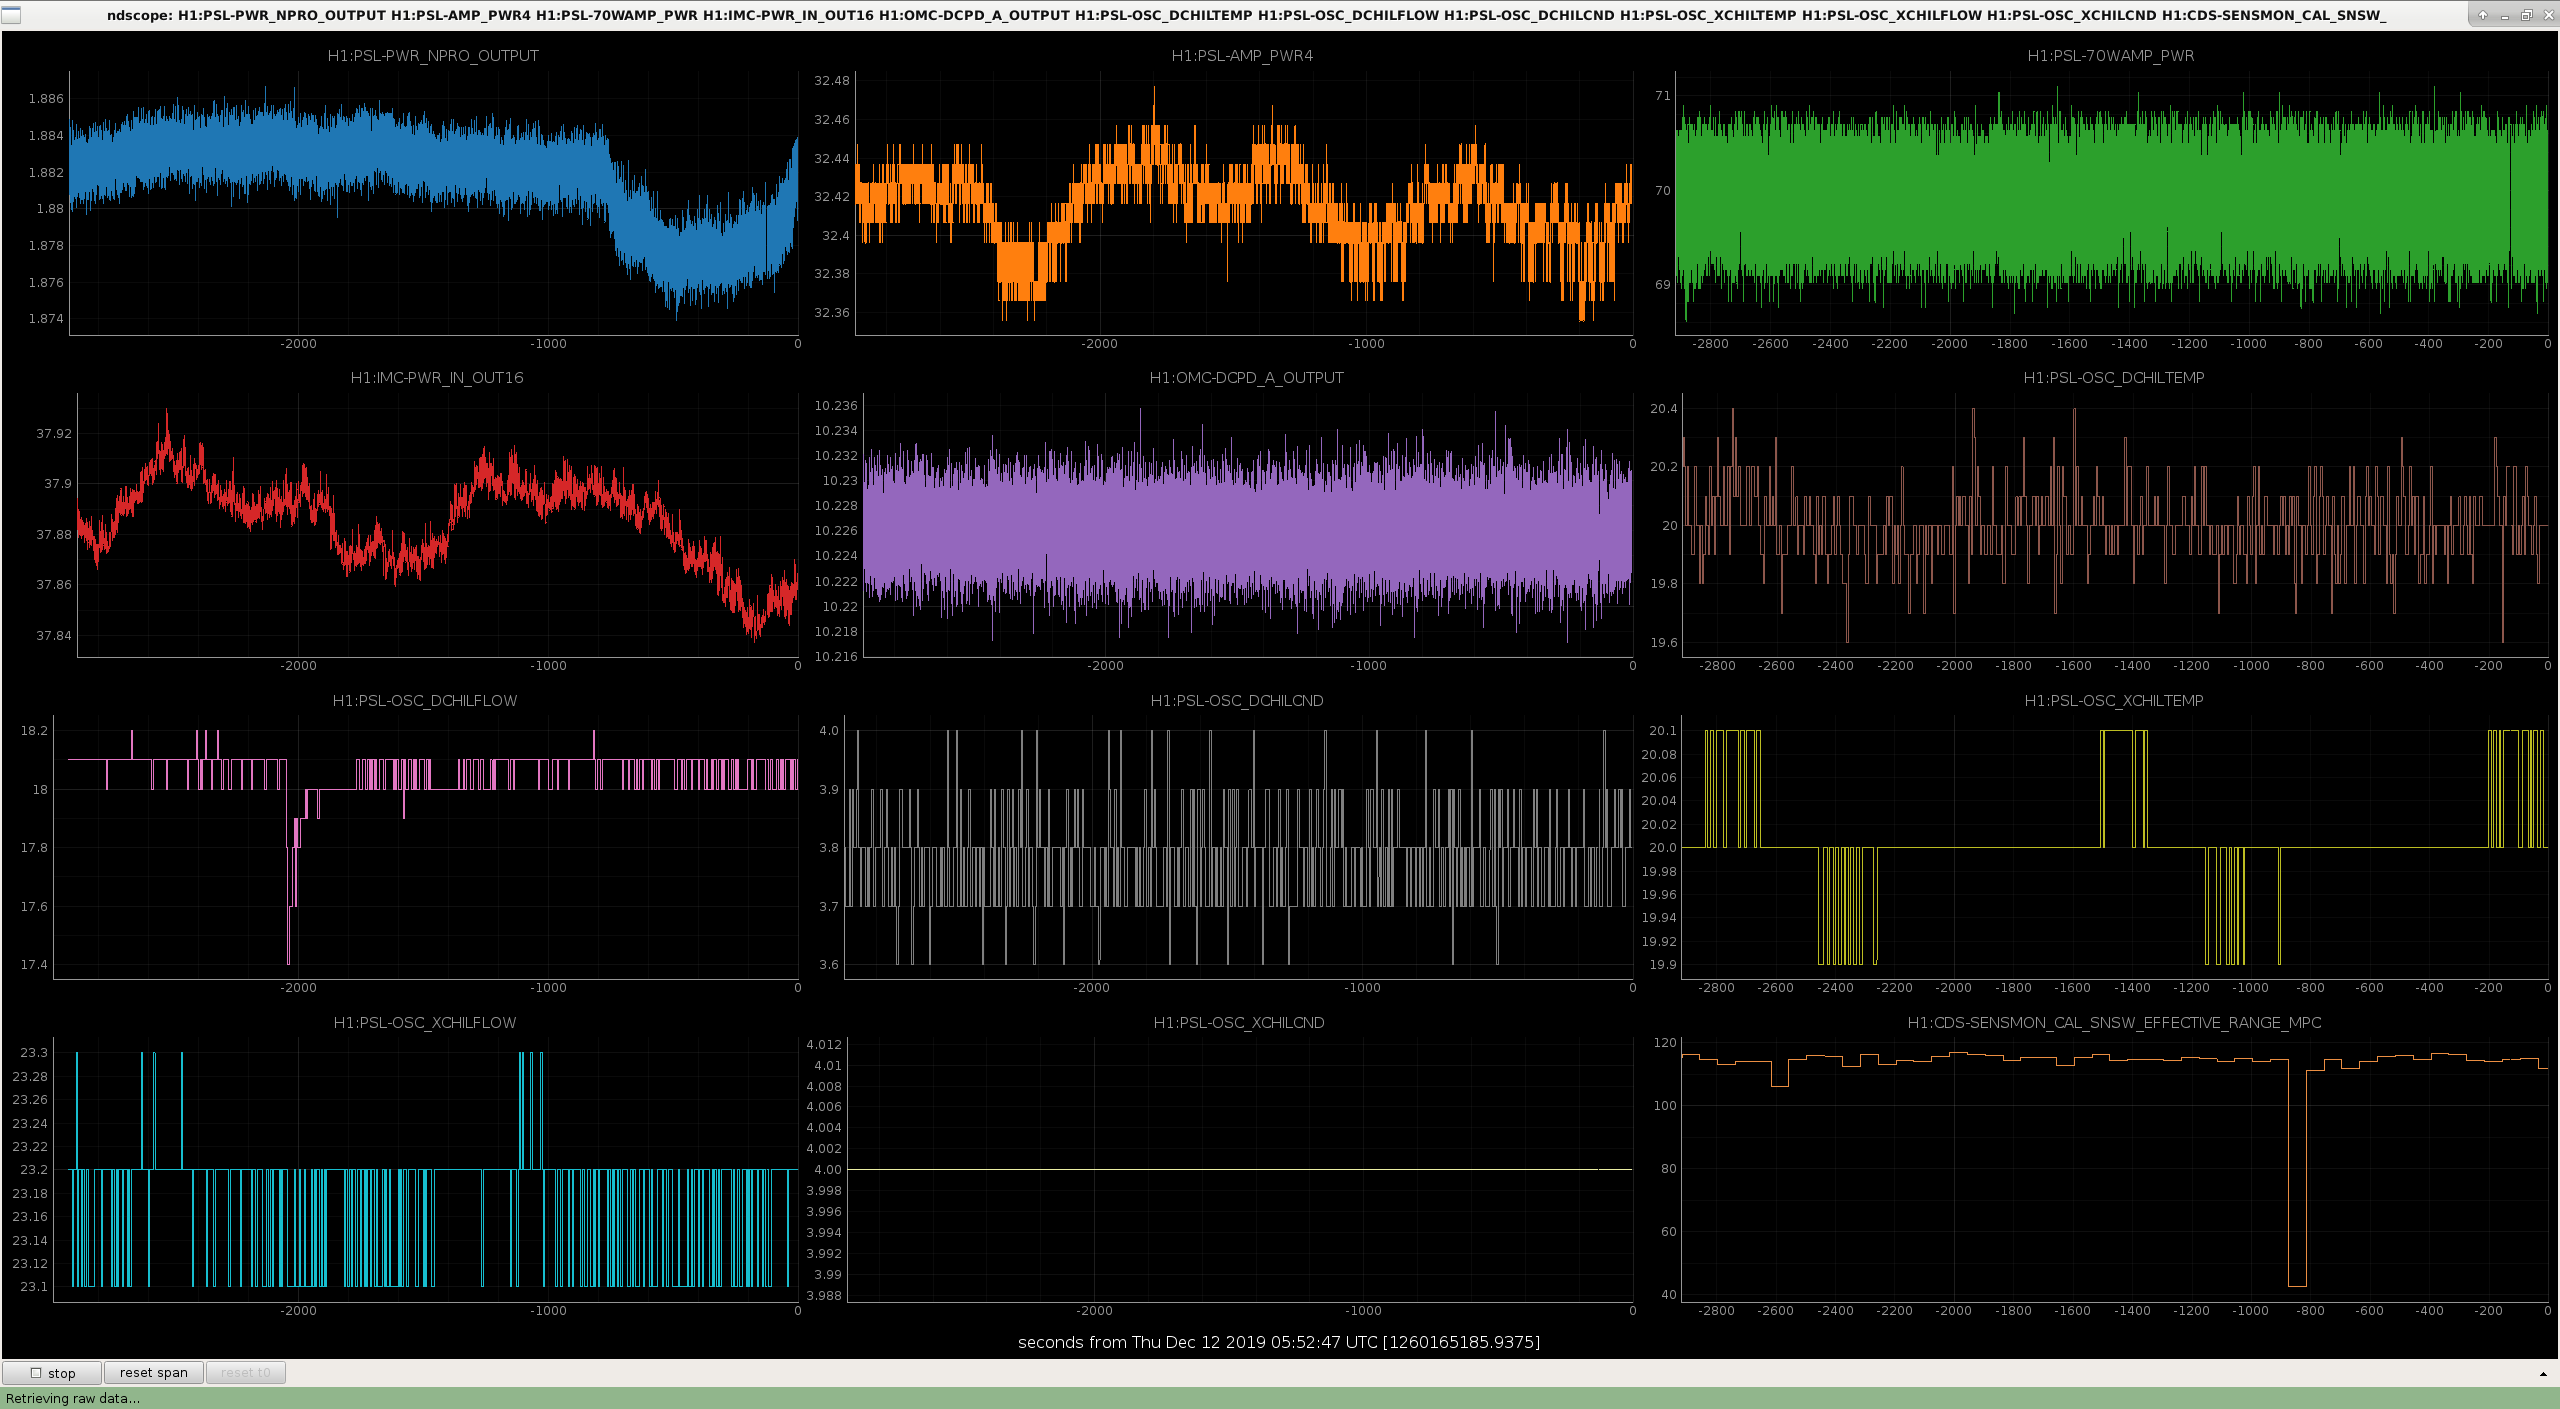
Plots attached show chiller and PSL power trends in the last lock before the chilller swap and the same signals in the current lock:
- plot 1 shows the last 2000 seconds of the last lock before the chiller swap - signals are stable
- plot 2 shows the recovery of the PSL, and the current lock (20000 seconds of data). As expected, thermal effects are seen in the drift of the power.
- plot 3 shows the last 2000 seconds of the current lock, to compared to plot 1 - the signals are as stable
- NOTE: there are changes in flow rate which have the potential to effect noise
Images attached to this report