evan.goetz@LIGO.ORG - posted 16:48, Friday 22 November 2019 - last comment - 13:39, Friday 20 December 2019(53439)
Summary of O3a H1 lines and combs
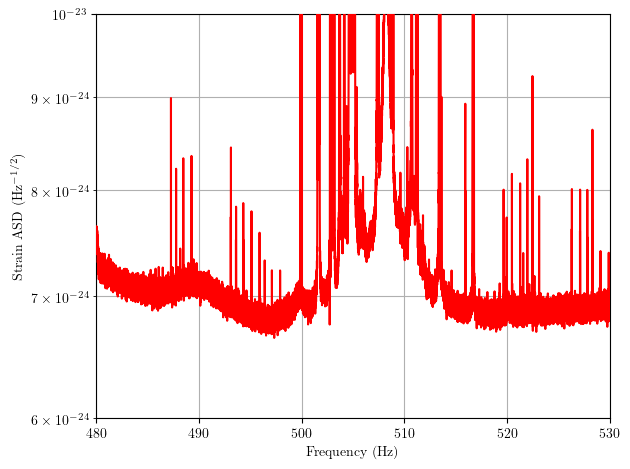
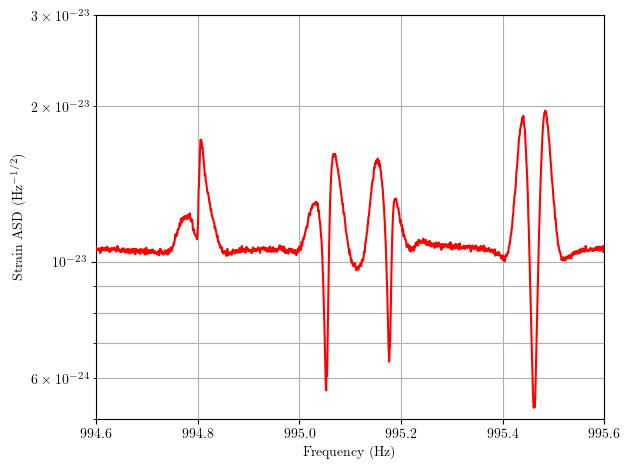
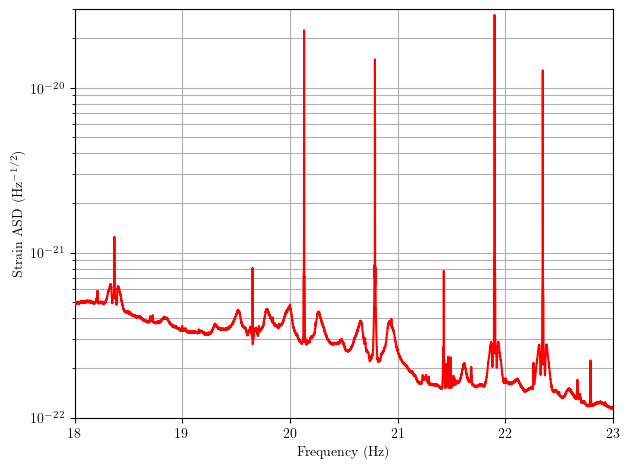
Cody Barschaw, Julian Carlin, Evan Goetz, Jack Heinzel, Sandra Hughey, Shivaraj Kandhasamy, Andrew Matas, Hannah Middleton, Lucas Mueller, Ansel Neunzert, Jay Tasson, Andres Vargas

Summary:
We have flagged and identified as many narrow spectral artifacts in the O3a averaged spectrum using ASDs of coherence length with 7200 seconds. From this flagged list, we have identified non-astrophysical lines and combs in a "vetted" list and maintain a list of unidentified lines. Overall, as reported in other aLOGs, the H1 data is much cleaner of narrow spectral artifacts than in O1 or O2. As always, nice work to commissioners and stay vigilant!

We highlight a few issues worth further investigation that impact both H1 and L1 spectra: 1) calibration line non-linearities; 2) apparent calibration line mixing with loud violin resonances; 3) weird non-physical "anti-line" features that dip below the shot noise sensitivity around certain violin resonances; 4) ASC dither lines are loud with significant sidebands. Item 3 may be due to mismatch in violin notch filtering or because of some issues damping the resonance, and item 4 is only an issue at H1.

See the linked files: Vetted list and Unidentifed list

Details:
Using standard CW tools in LALSuite, we generated 7200 s long SFTs from the C00 calibrated h(t) frames, only selecting observing times using H1:DMT-ANALYSIS_READY data from April 1 - Sept. 30. The SFTs were then averaged using noise weighting (a running median of the noise variance on a per-SFT basis) in order to generate an O3a average ASD. This provides rejection of high noise SFTs, fine frequency resolution, and a large number of averages in order to reveal narrow spectral artifacts that may remain hidden in a normal ASD.

Our team then divided the data for both H1 and L1 into broad frequency bands to flag all narrow spectral artifacts, attempting to identify combs and lines where possible. Those identified as non-astrophysical go into the vetted list, and everything else remains in the unidentified list.

Highlights:
- Calibration lines: 15.1, 15.6, 16.4, 16.7, 17.1, 17.6, 35.9, 36.7, 410.3, 1001.3, 1083.7, 1153.1, 1501.3 Hz
These are fairly obvious since they are on tenth Hz frequencies. Simple aLOG search was all that was needed. Calibration lines have been moved, but the run-average spectra see all of them. Also worth noting is that the 1153.1 Hz "cancelling" line is the same frequency as a roaming L1 line. Was this chosen on purpose? Generally we don't like to make coherent lines between detectors, so I'd advise moving this to a different frequency.

- Calibration line non-linearities occuring at 2f, f_1+f_2, or f_1-f_2: (27 lines identified in H1 so far)
Not as obvious, but has been identified at H1 as a problem (see LHO aLOG 48161) and also shows up at L1.

- Calibration line mixing with loud violin harmonics (at least 278 lines, see linked files above)
Identified at H1 (see see LHO aLOG 48161 and LHO aLOG 49281) and seen also at L1 by their spacing in concordance with the calibration line spacings (see, for example figure 1). It appears this problem is more of an issue with the violins are rung up, but they may also be present at a lower level even if the violins are not excited. Damping the violins and/or reducing calibration line amplitudes may help, but neither may be a good solution for a variety of reasons.

- Non-physical "anti-line" features in the spectra (13 features identified in H1)
These can be seen in spectra like in Figure 2 and are clearly dipping below the shot noise sensitivity of the detector around certain violin harmonics. It is not caused by the noise weighting of the SFTs; changing to a simple arithmetic average shows the same features. I speculate that this could be due to some kind of notch filter mismatch around the violin resonances or it could be due to a problem in the violin mode damping. Maybe there is a better idea for the cause. This may have escaped notice before because it's not seen in the summary page spectra or control room spectra. Other ideas?

- ASC dither lines: 18.37, 19.653, 20.131, 20.789, 21.9, 22.347 Hz
Only an issue in H1 since the L1 dither lines are all below 10 Hz and we don't yet see any issue with noise above 10 Hz caused by them. These lines are loud (some are larger in the h(t) ASD than the calibration lines) and have fairly substantial sidebands, see figure 3. It would be great if the SNR can be turned down on these lines and/or moved. I'm sure there is good reason for being where they are and as loud as they are. Maybe the commissioners could have a look at this.

Other details can be found on the main wiki page for organizing this effort, and recent presentation slides in the DCC.

We will have to check for any new lines in cleaned data. Additions or revisions can always be made in the git repo containing these lists.
Images attached to this report
Comments related to this report
Tagging CDS
I have two theories about what these "apparent" nonphysical things happening in the h(t) ASD around the violin mode frequencies, and it's "technical" enough that I wrote a presentation about it: see G1902343.

The message: we're likely both over damping some of the violin modes, and we're definitely not including all the intricacies of the "parasitic" violin mode damping loops in the DARM loop model, and thus they are not calibrated out of h(t).