I looked at the very noisy period over the weekend associated with the high microseismic peak to double check that the noise was consistent with https://alog.ligo-wa.caltech.edu/aLOG/index.php?callRep=54298, and that the R0 path we are hoping to incoporate into models on Tuesday would likely help. The figure shows that the arch frequency spacing in DARM pretty well predicts the relative velocity of L2 and R2. The hypothesis is that the scattering path is between the ESD traces on the RM and the HR coating on the TM, with the arch frequency spacing given by the TM-RM relative velocity and the arch stacking in frequency due to multiple cycles on this path with 90% power loss each cycle. R0 tracking would reduce the TM-RM relative motion and appears to have helped at LLO https://alog.ligo-la.caltech.edu/aLOG/index.php?callRep=50897 .

Hi Robert,
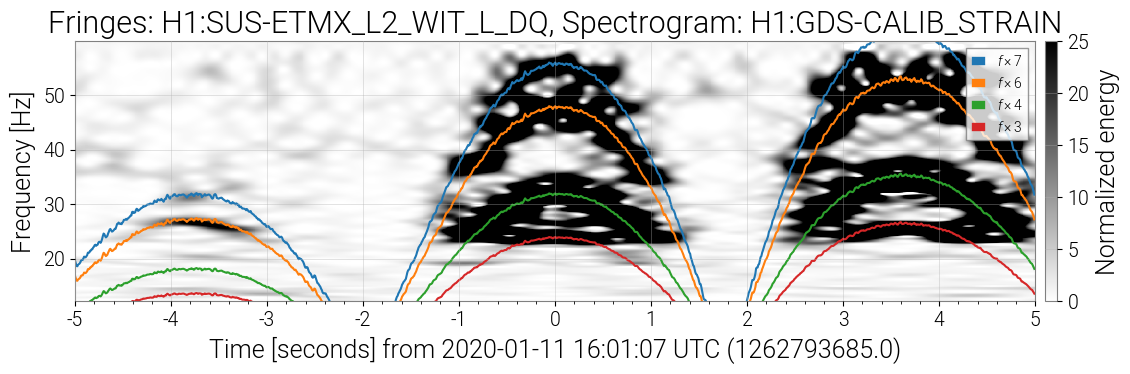
Figure 1 below is an overlay of the same data you showed, but the spectrogram made with an omega scan, and the fringe frequency calculated from SUS_ETMX_L2_WIT_L_DQ using f=N*abs(2 v(t)/lambda) where v(t) is the velocity (derivative of that channel). The outcome agrees with what you saw, the fringe predictions line up, and specifically, the multiples of N=3,4,6,7 are visible in the h(t) data.
This was run on the hanford LDG cluster using the following commands:
conda activate /home/detchar/.conda/envs/ligo-summary-3.7
python -m gwdetchar.scattering -i H1 -m 3,4,6,7 -d 10 -t 10 -c viridis 1262793685
This scattering functionality was written into gwdetchar by Alex Urban.
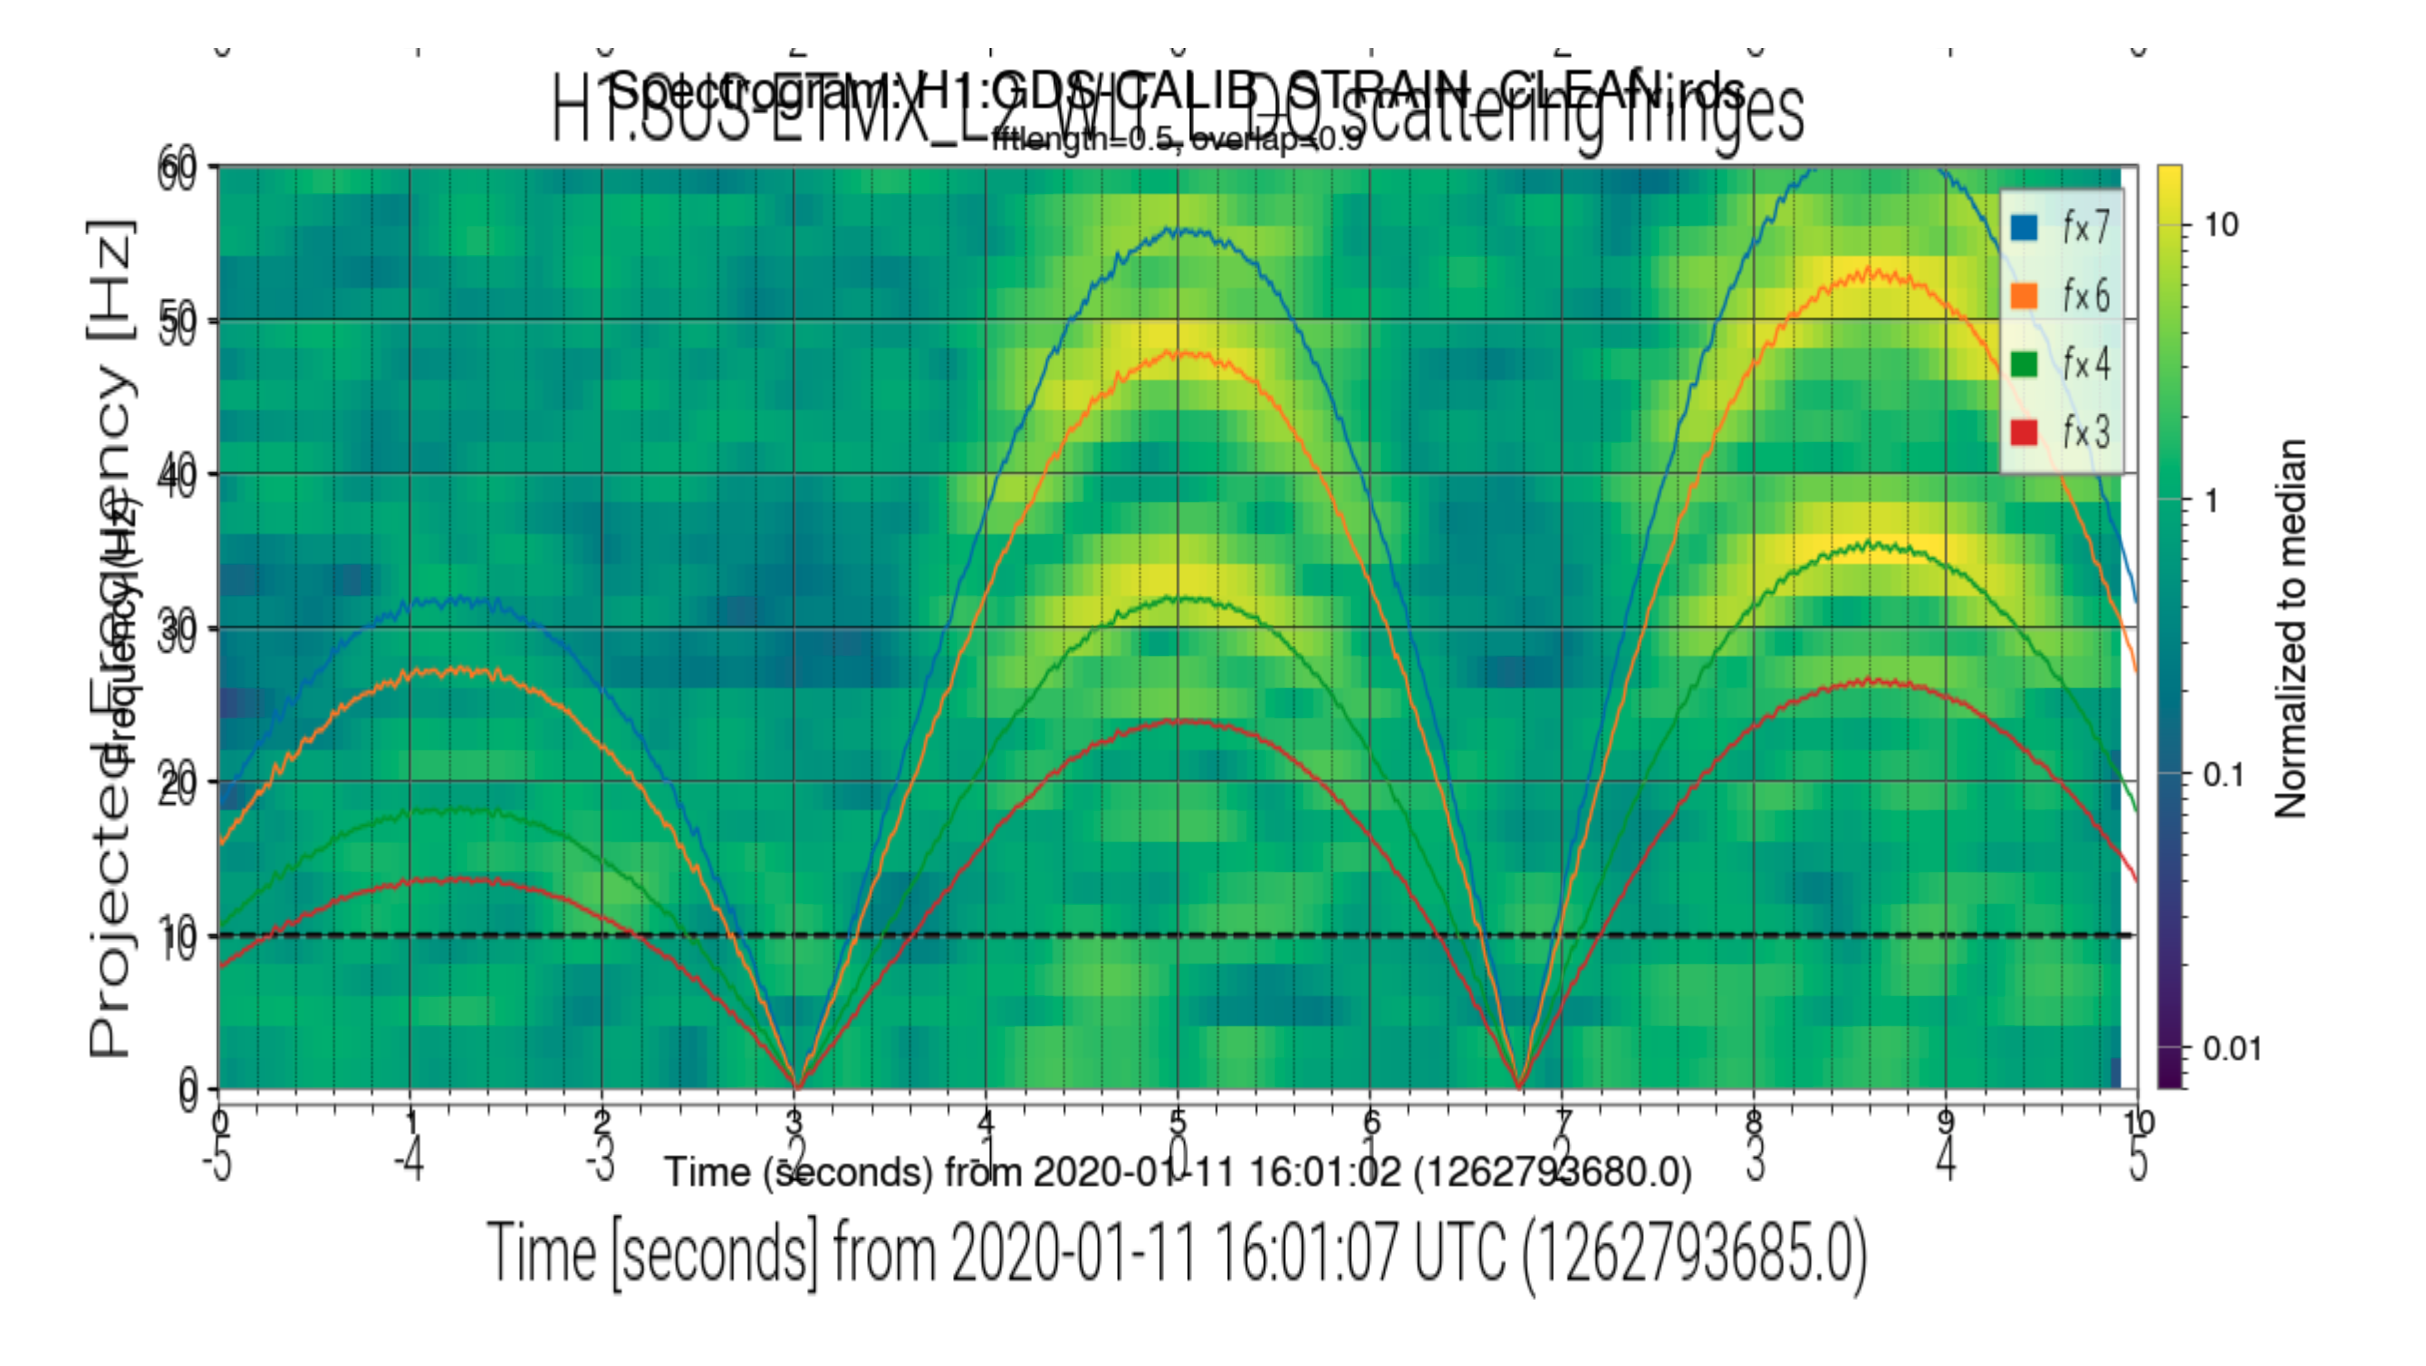
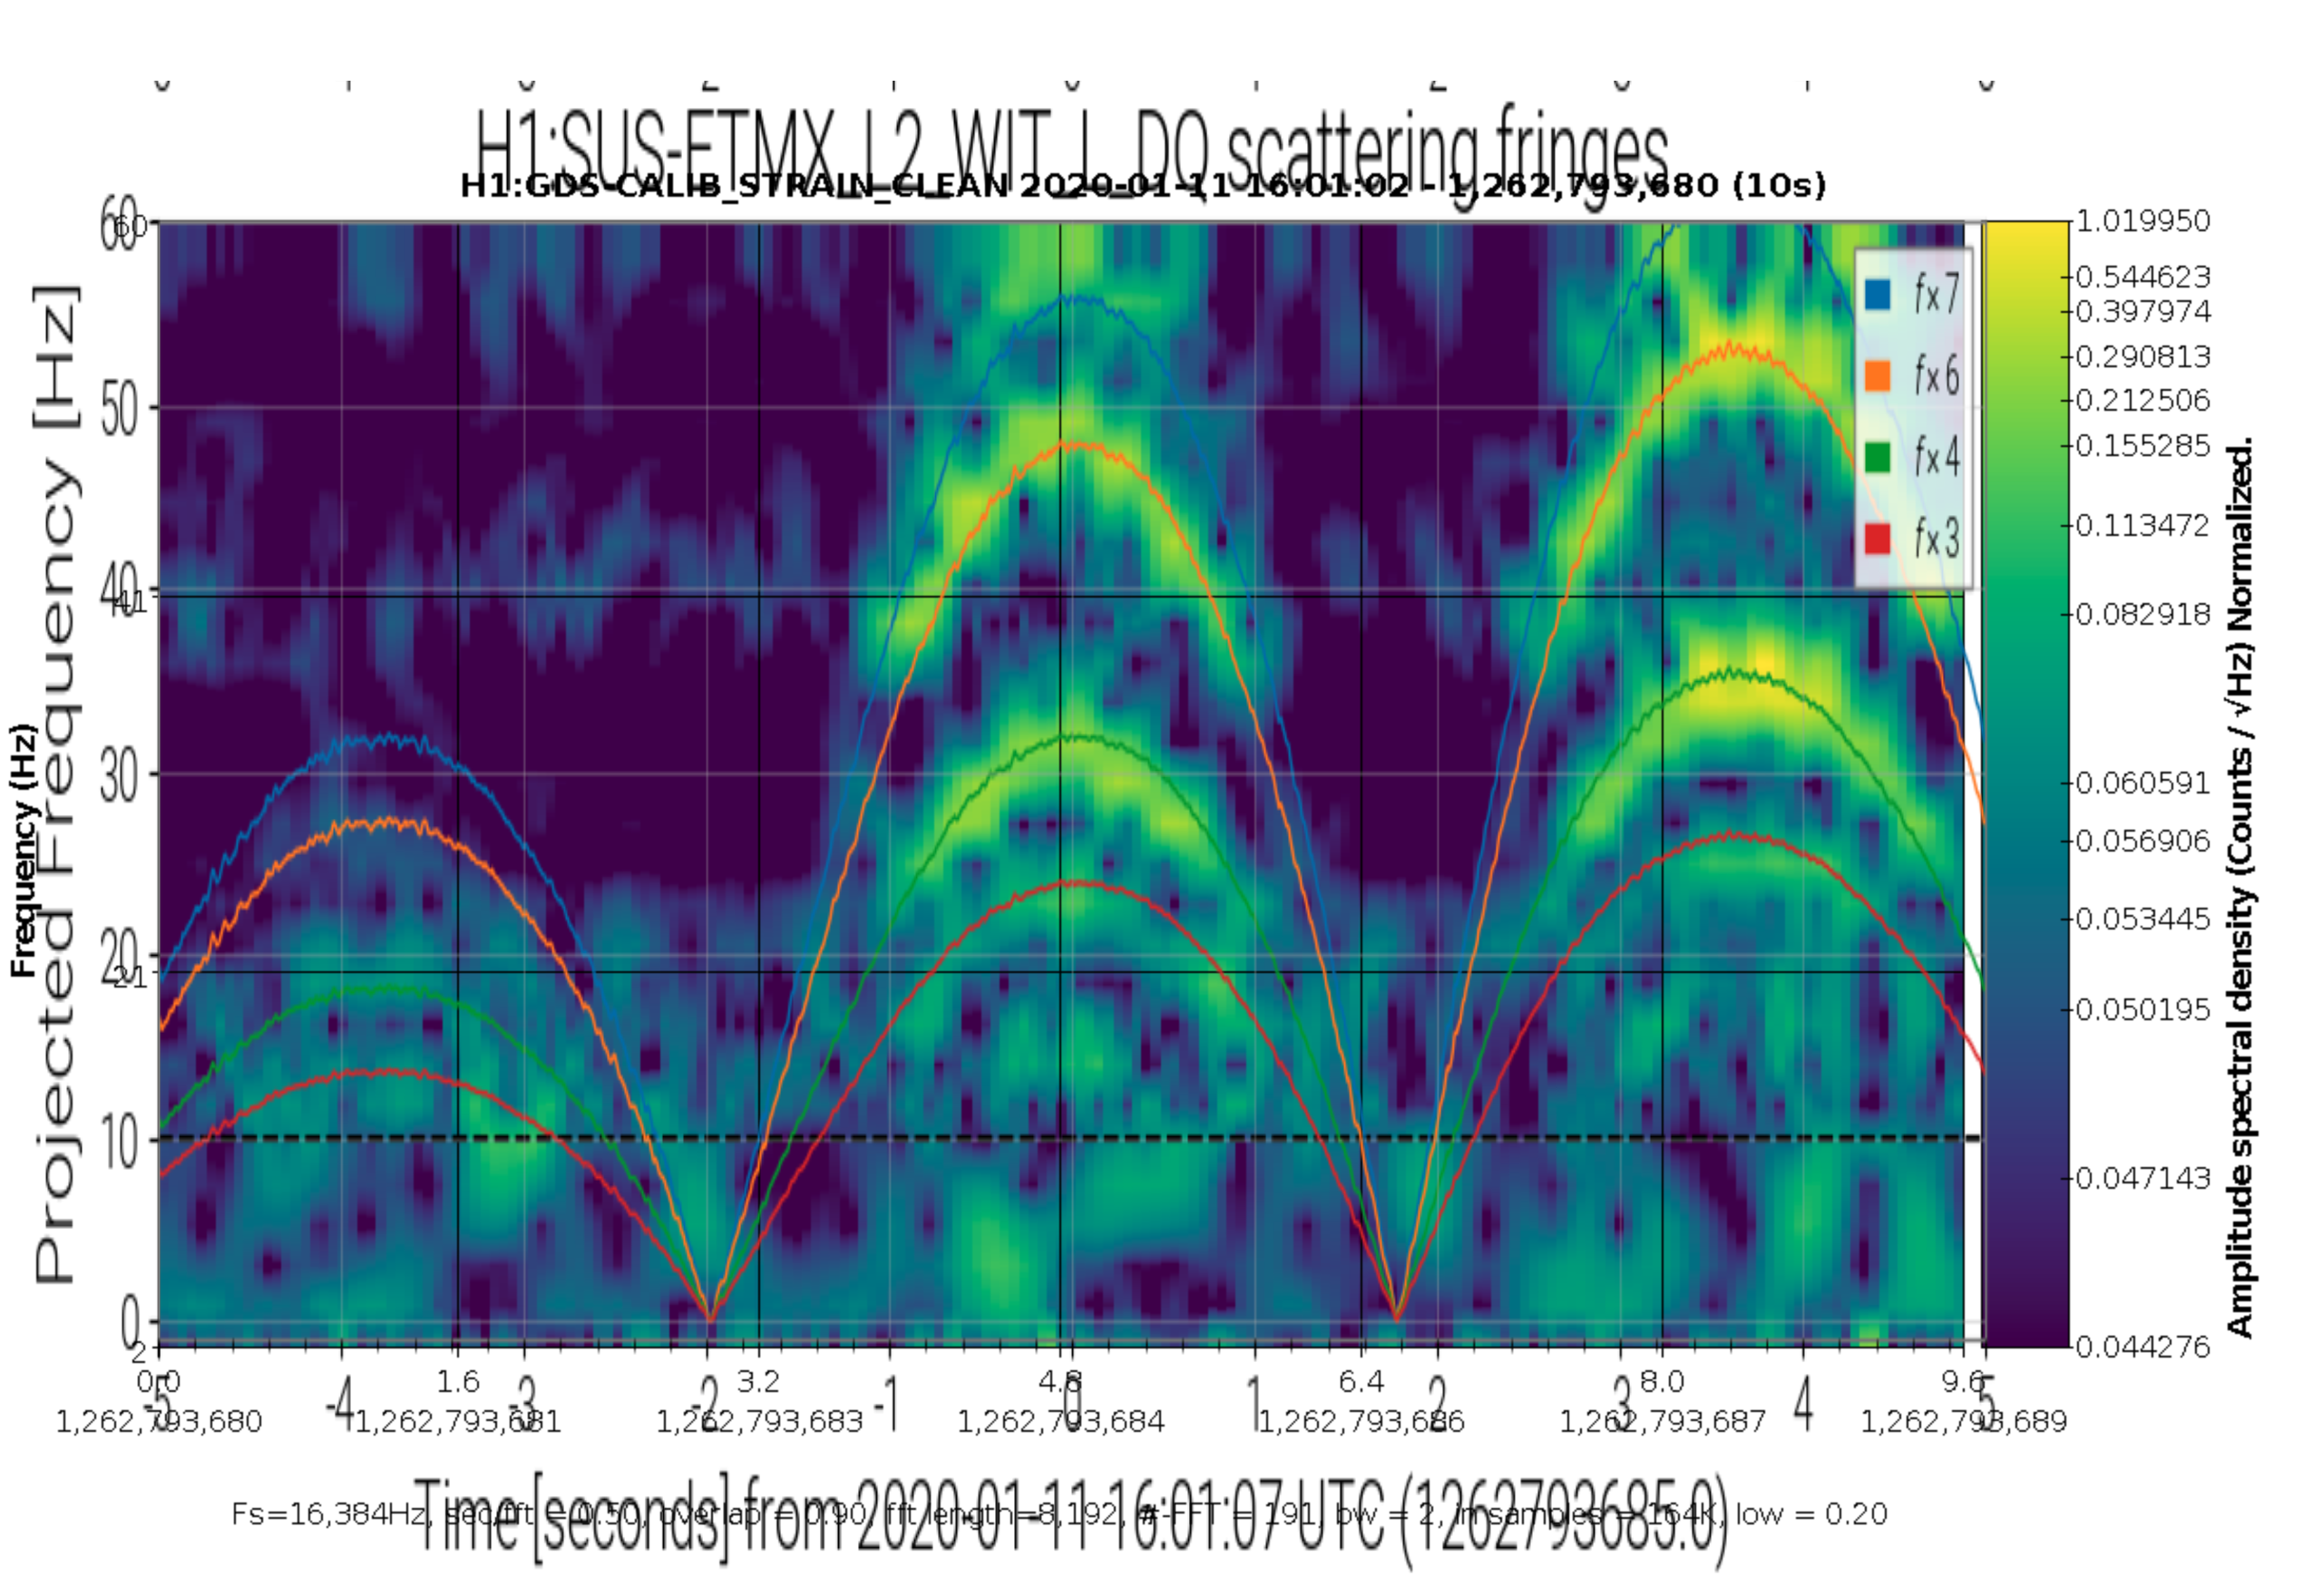
Figures 2 and 3 shows the same data, but overlaying the fringe prediction that the Python code produces on the two different spectrogram types available on ldvw (scaled to fit axes).