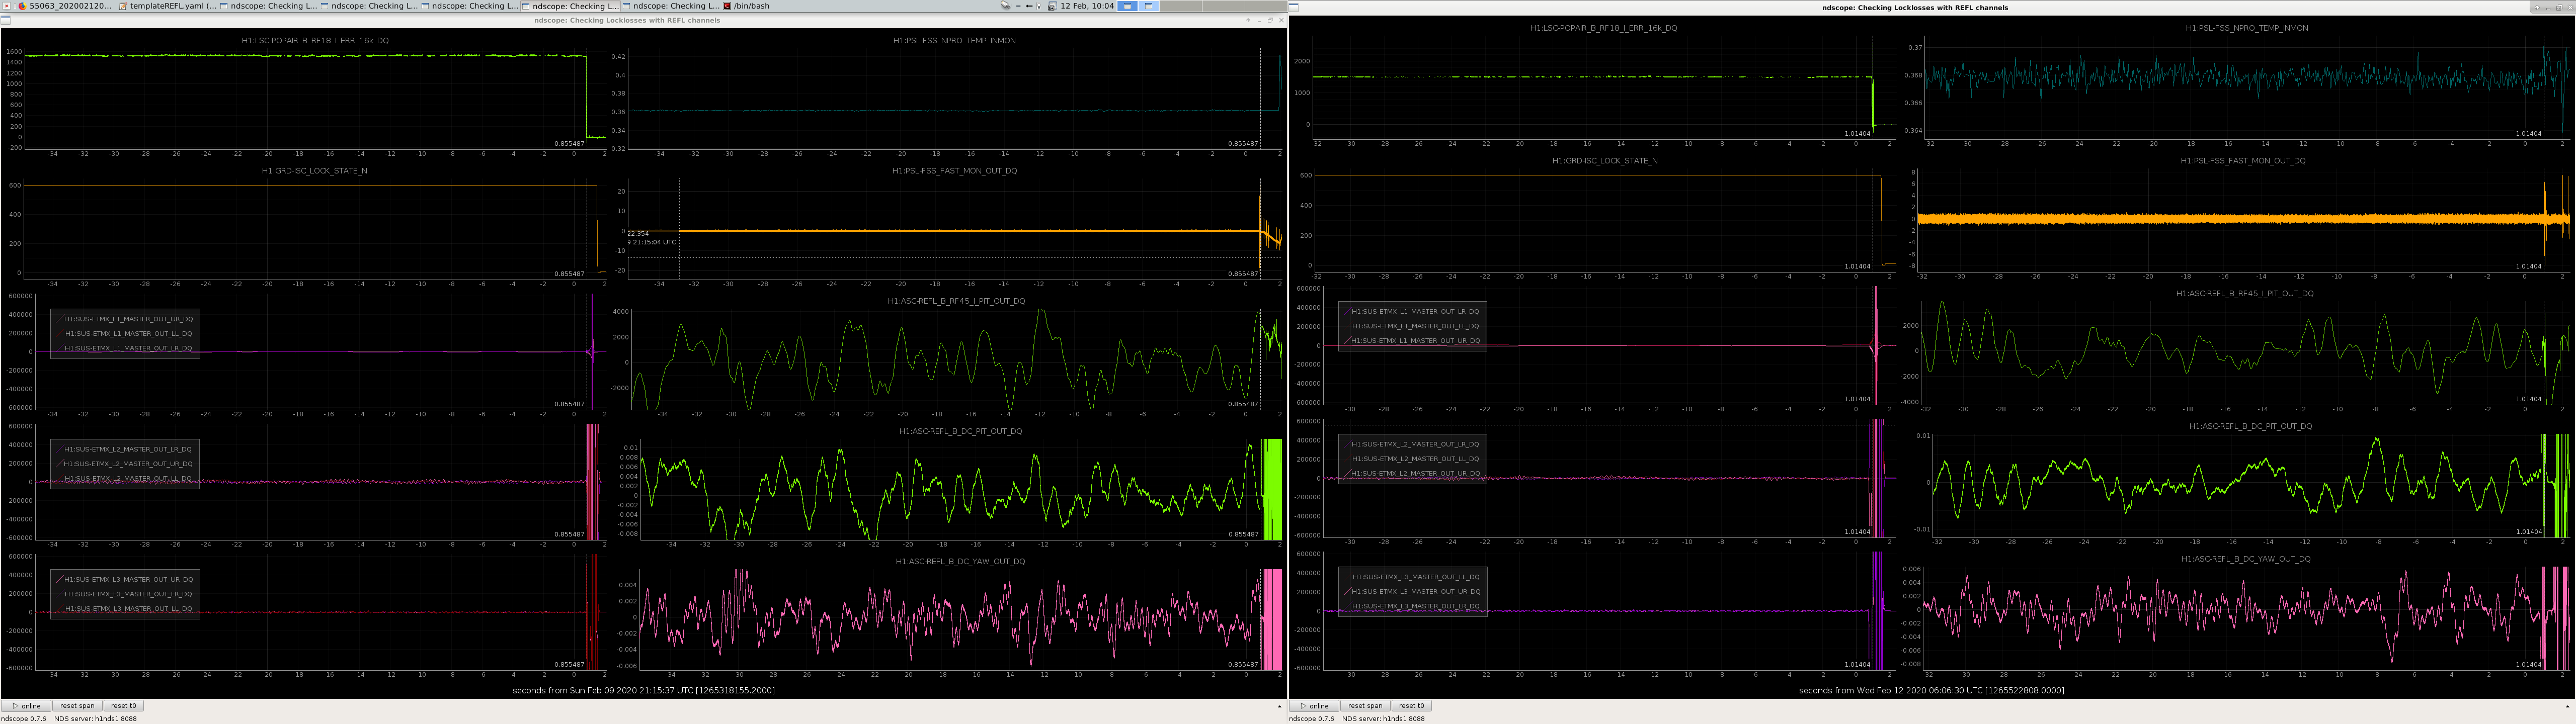
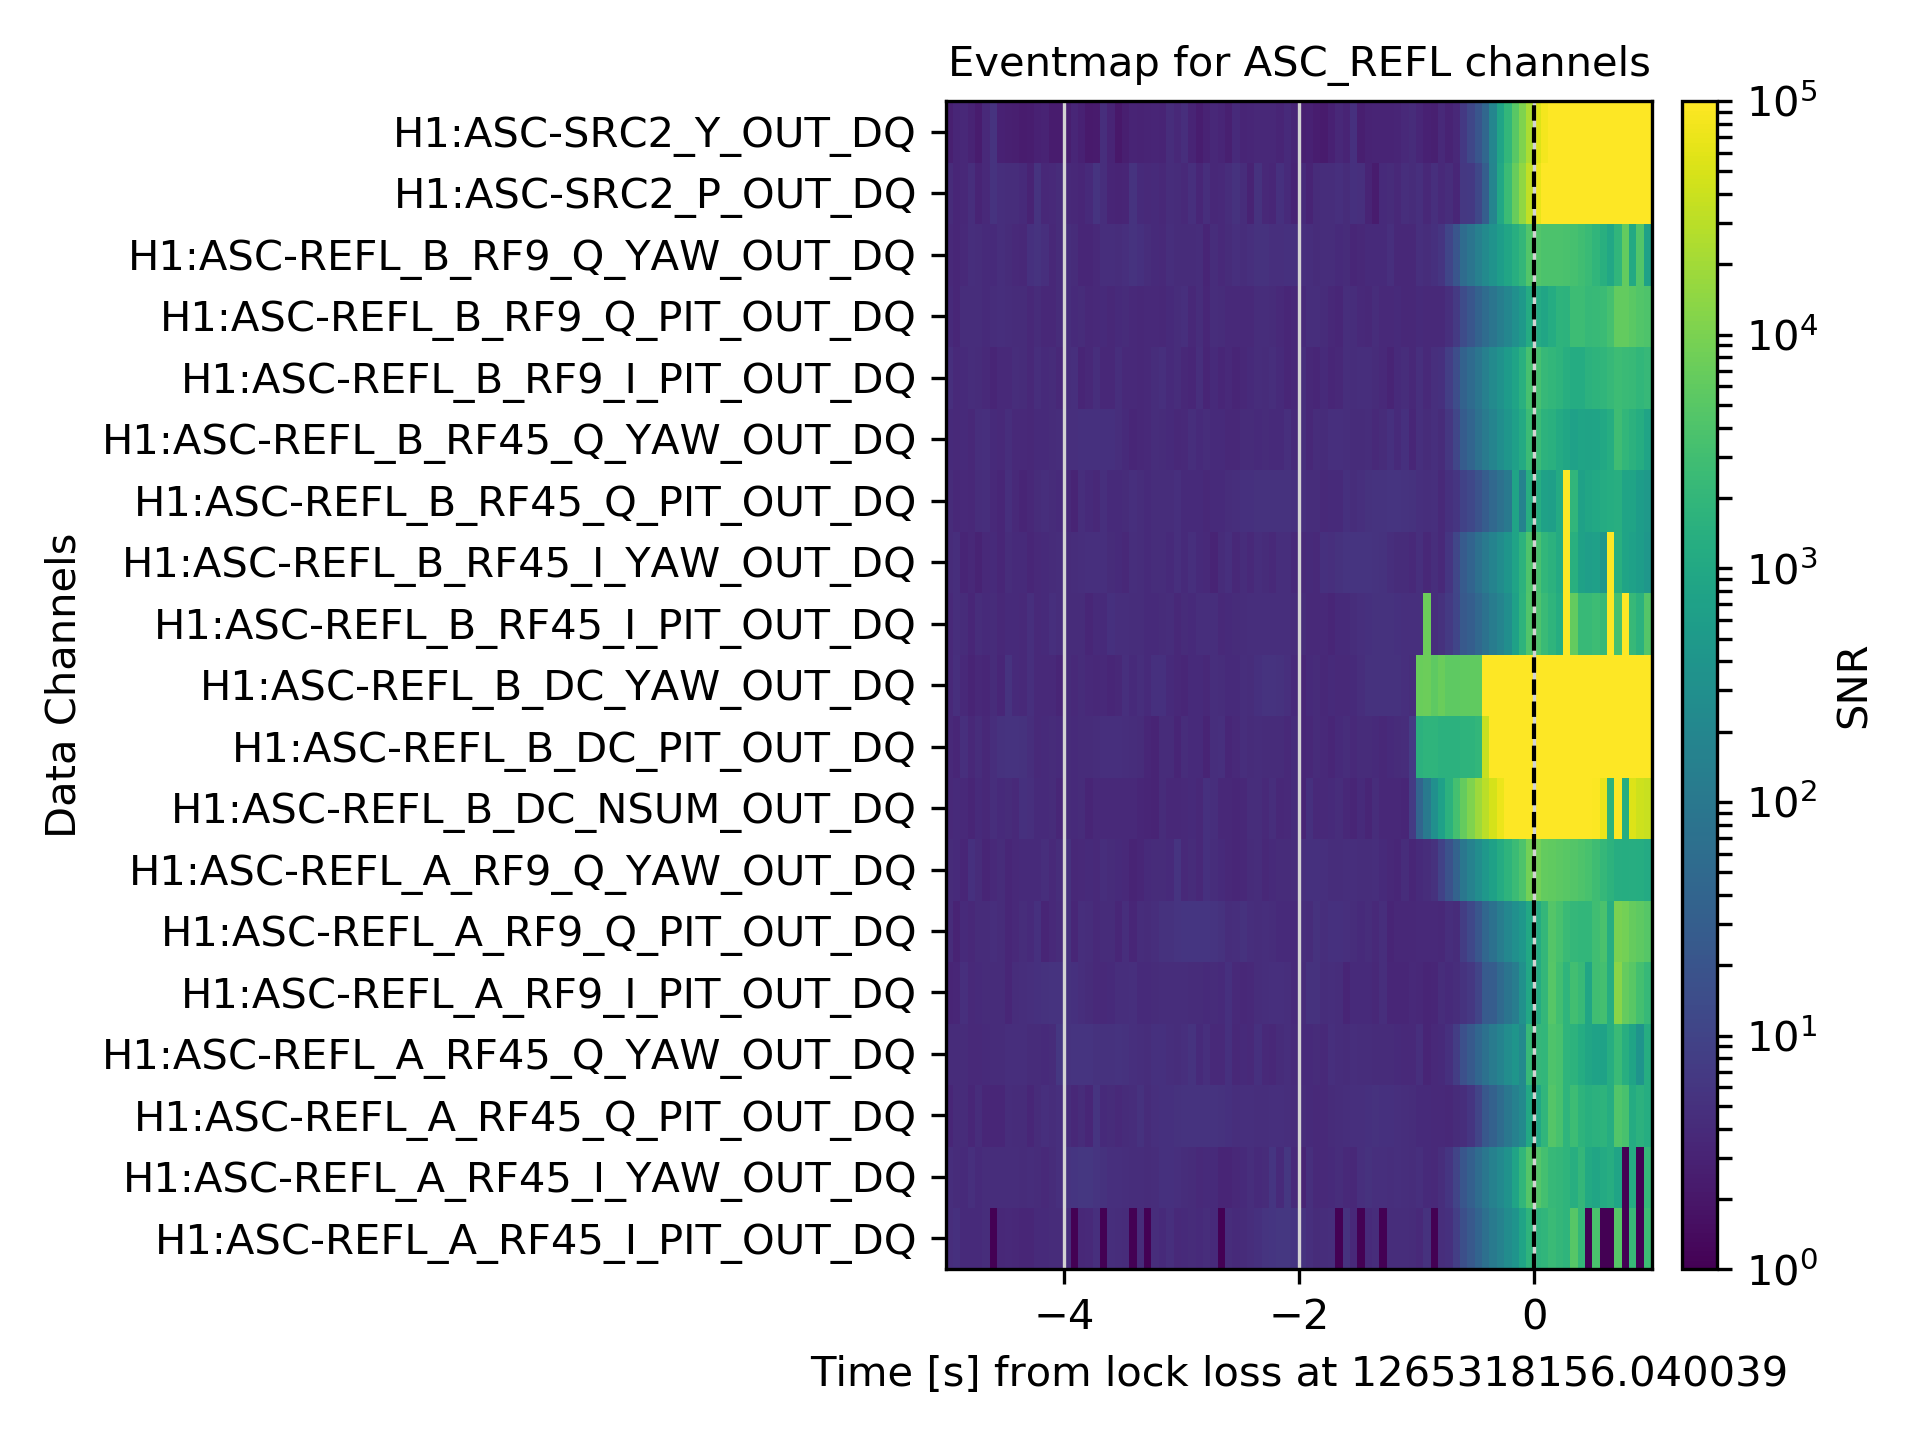
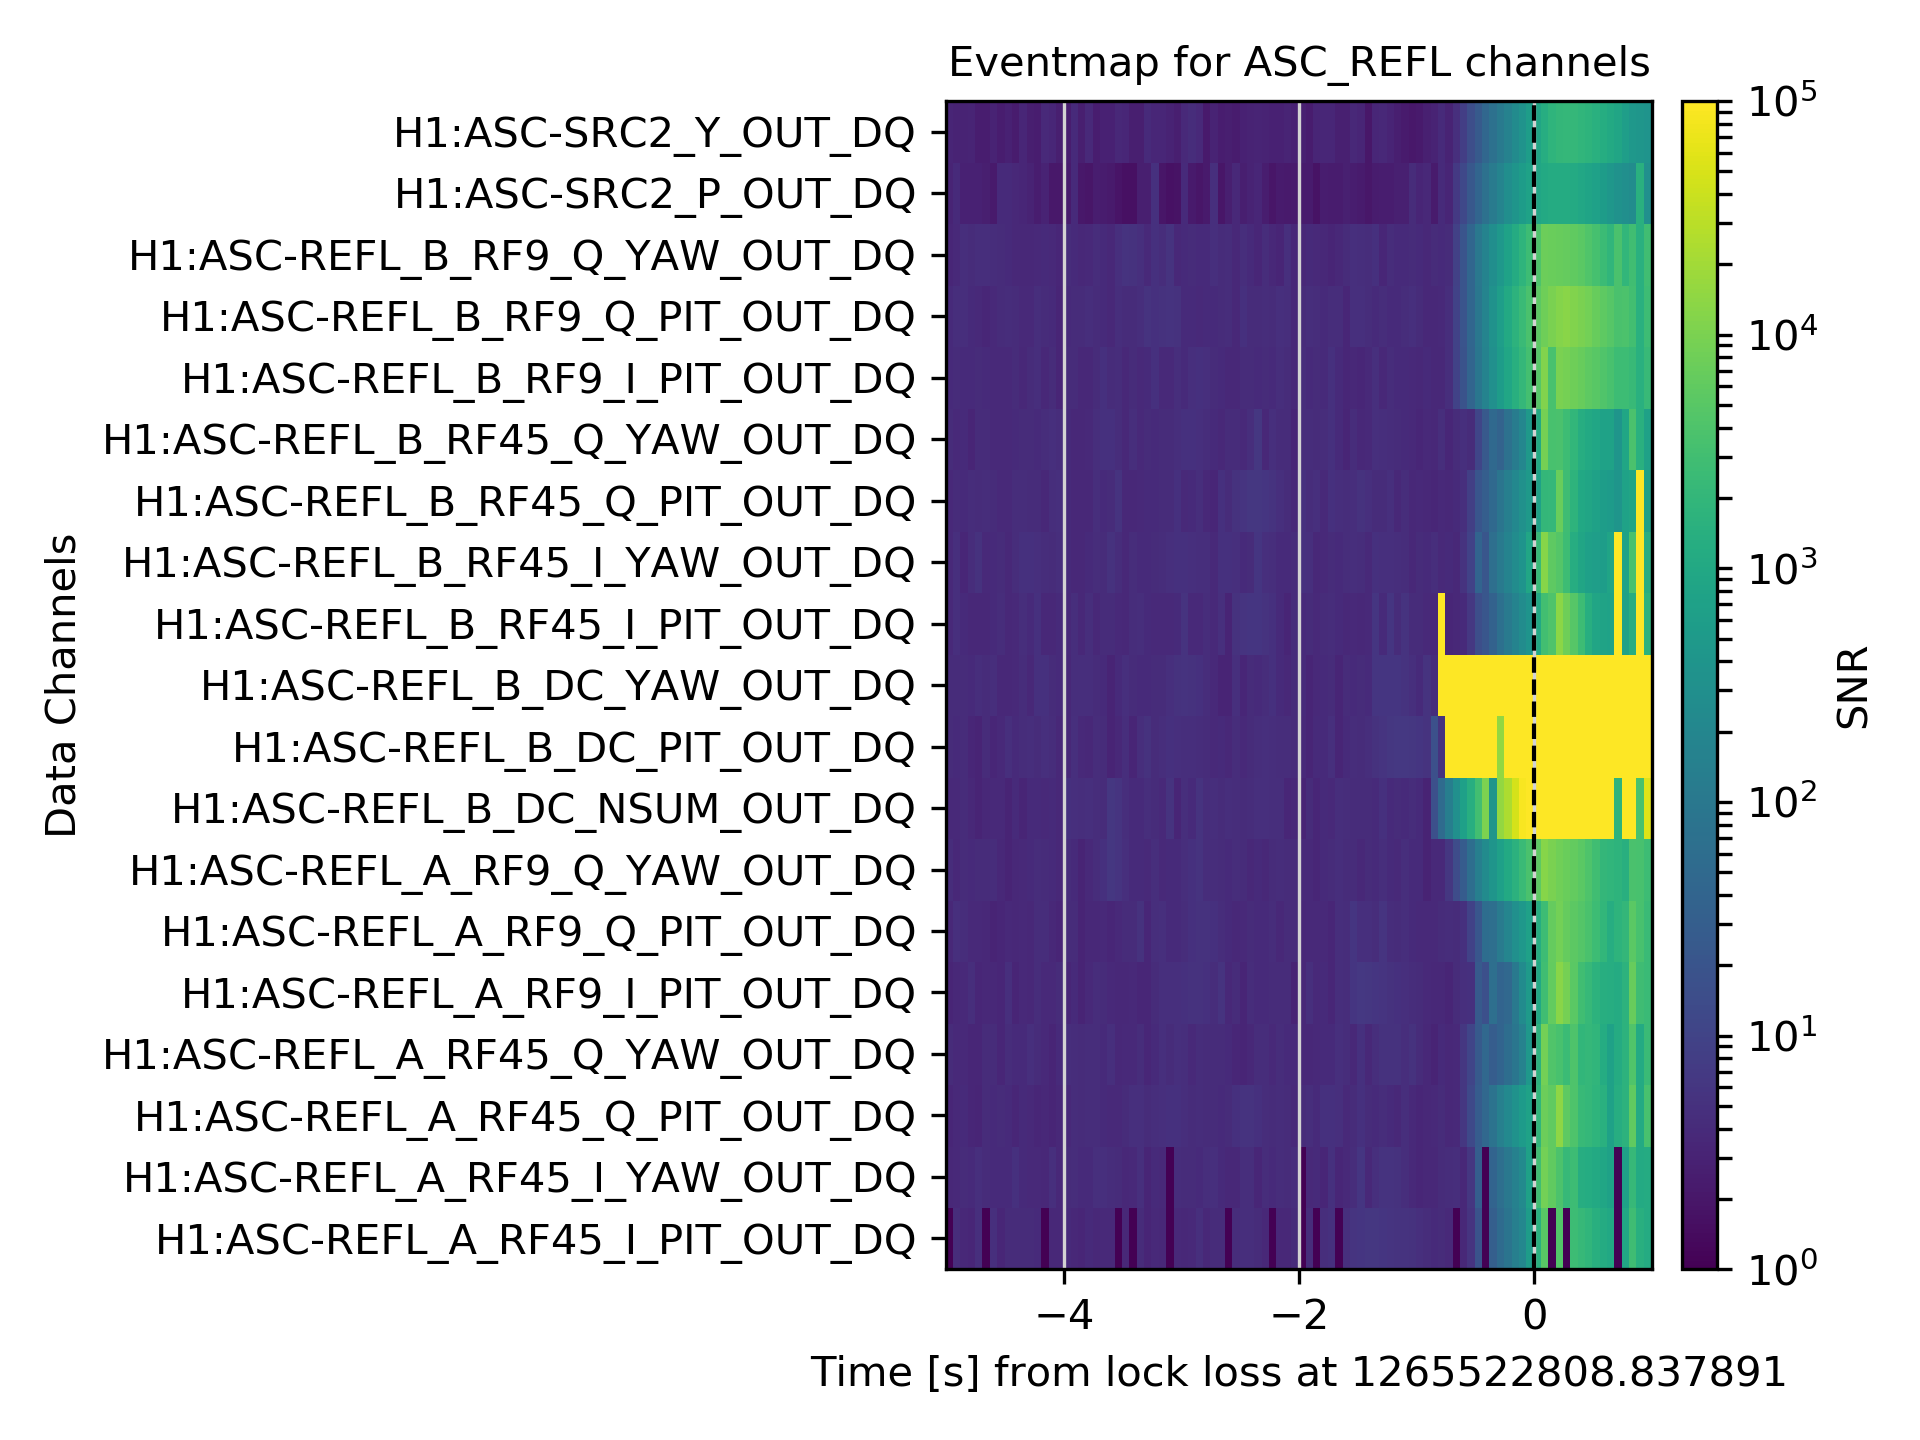
A lockloss on 9 Feb 2020 at 21:15 UTC, and on 12 Feb 2020 at 06:06 UTC, were both suggested as belonging to the catagory "fast lockloss." Both show there are no saturations in ADC Overflow Plots, however both have very similare patterns in Glitch Heatmaps for H1:ASC-REFL_B_RF45_I_PIT_OUT_DQ before lockloss.
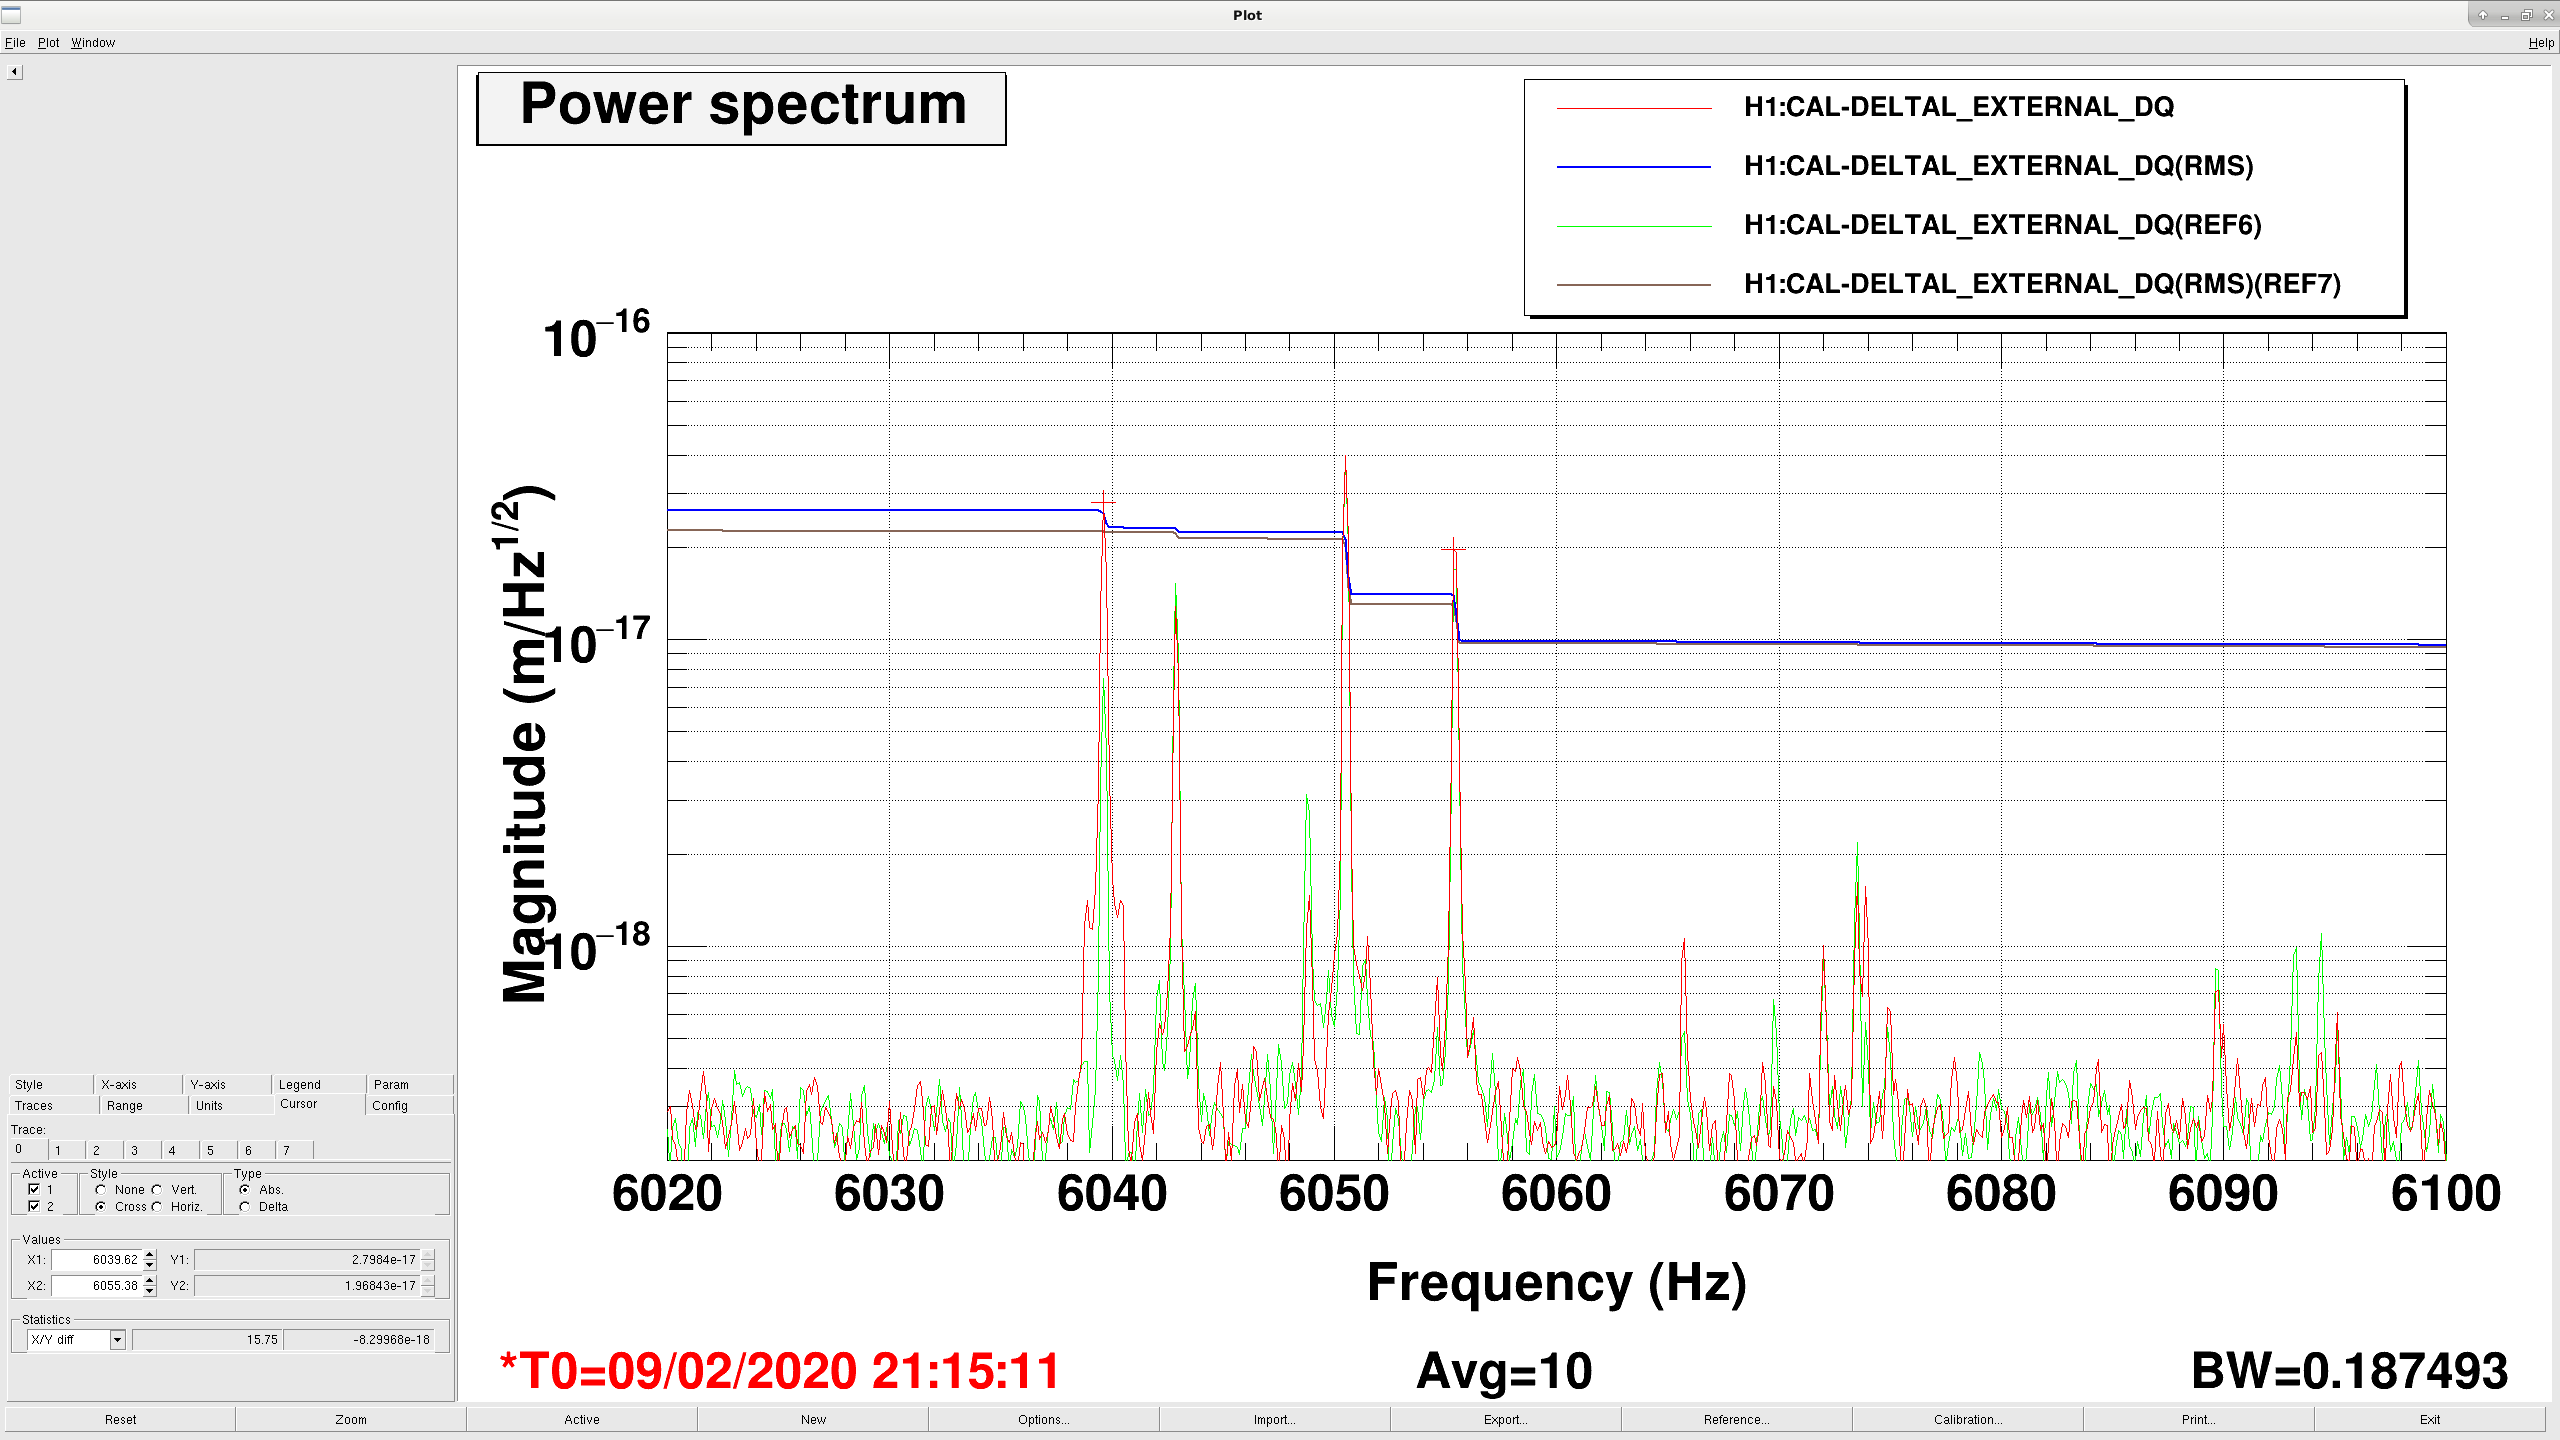
For the lockloss on 9 Feb, the downsampled PI mode peaks in DARM around 6KHz increase near the lockloss, when compared to earlier in the lock.
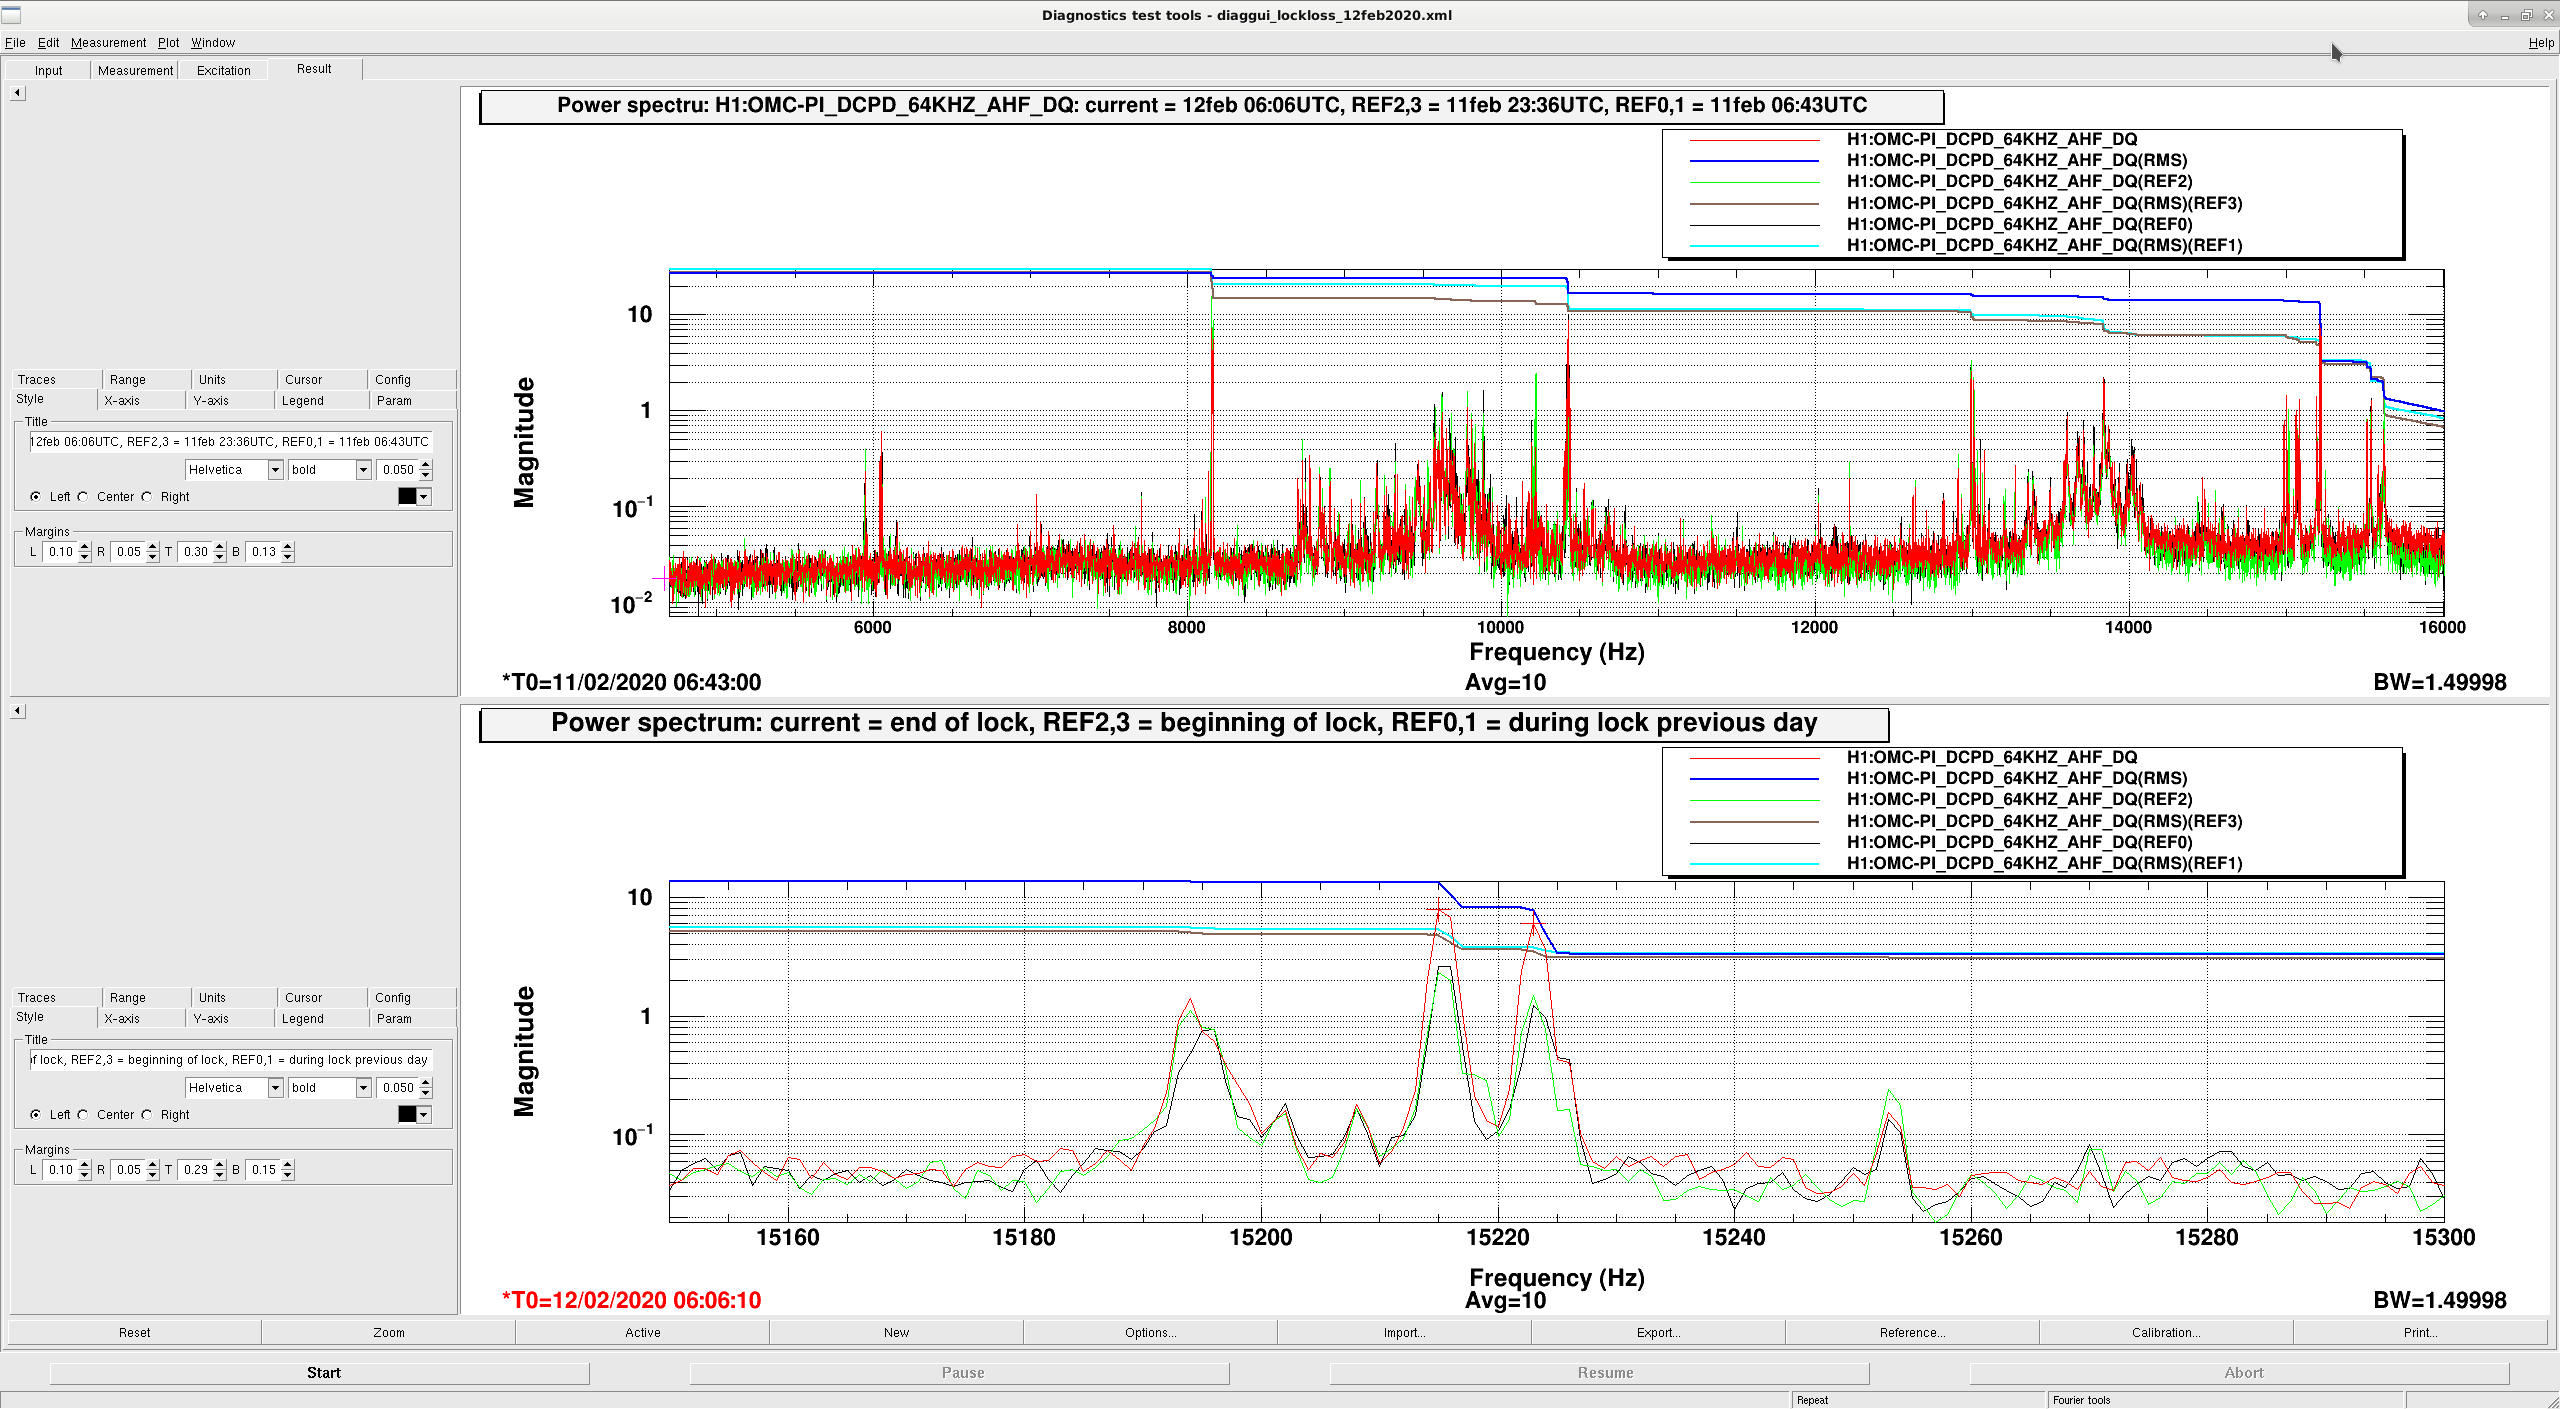
For the lockloss on 12 Feb, the peaks in OMC-PI_DCPD_64K around 15220Hz increase just before the lockloss when compared to earlier in the same lock, and when compared to the middle of the lock on the previous day.
Attached:
- lockloss 9 feb, 21:15 UTC - Glitch Heatmap for H1:ASC-REFL_B_RF45_I_PIT_OUT_DQ
- lockloss 12 feb, 06:06 UTC - Glitch Heatmap for H1:ASC-REFL_B_RF45_I_PIT_OUT_DQ
- lockloss 9 feb, 21:15 UTC - power spectra of DARM around 6KHz
- lockloss 12 feb, 06:06 UTC - power spectra of OMC-PI_DCPD_64K around 15220Hz
Looks very interesting Cheryl!
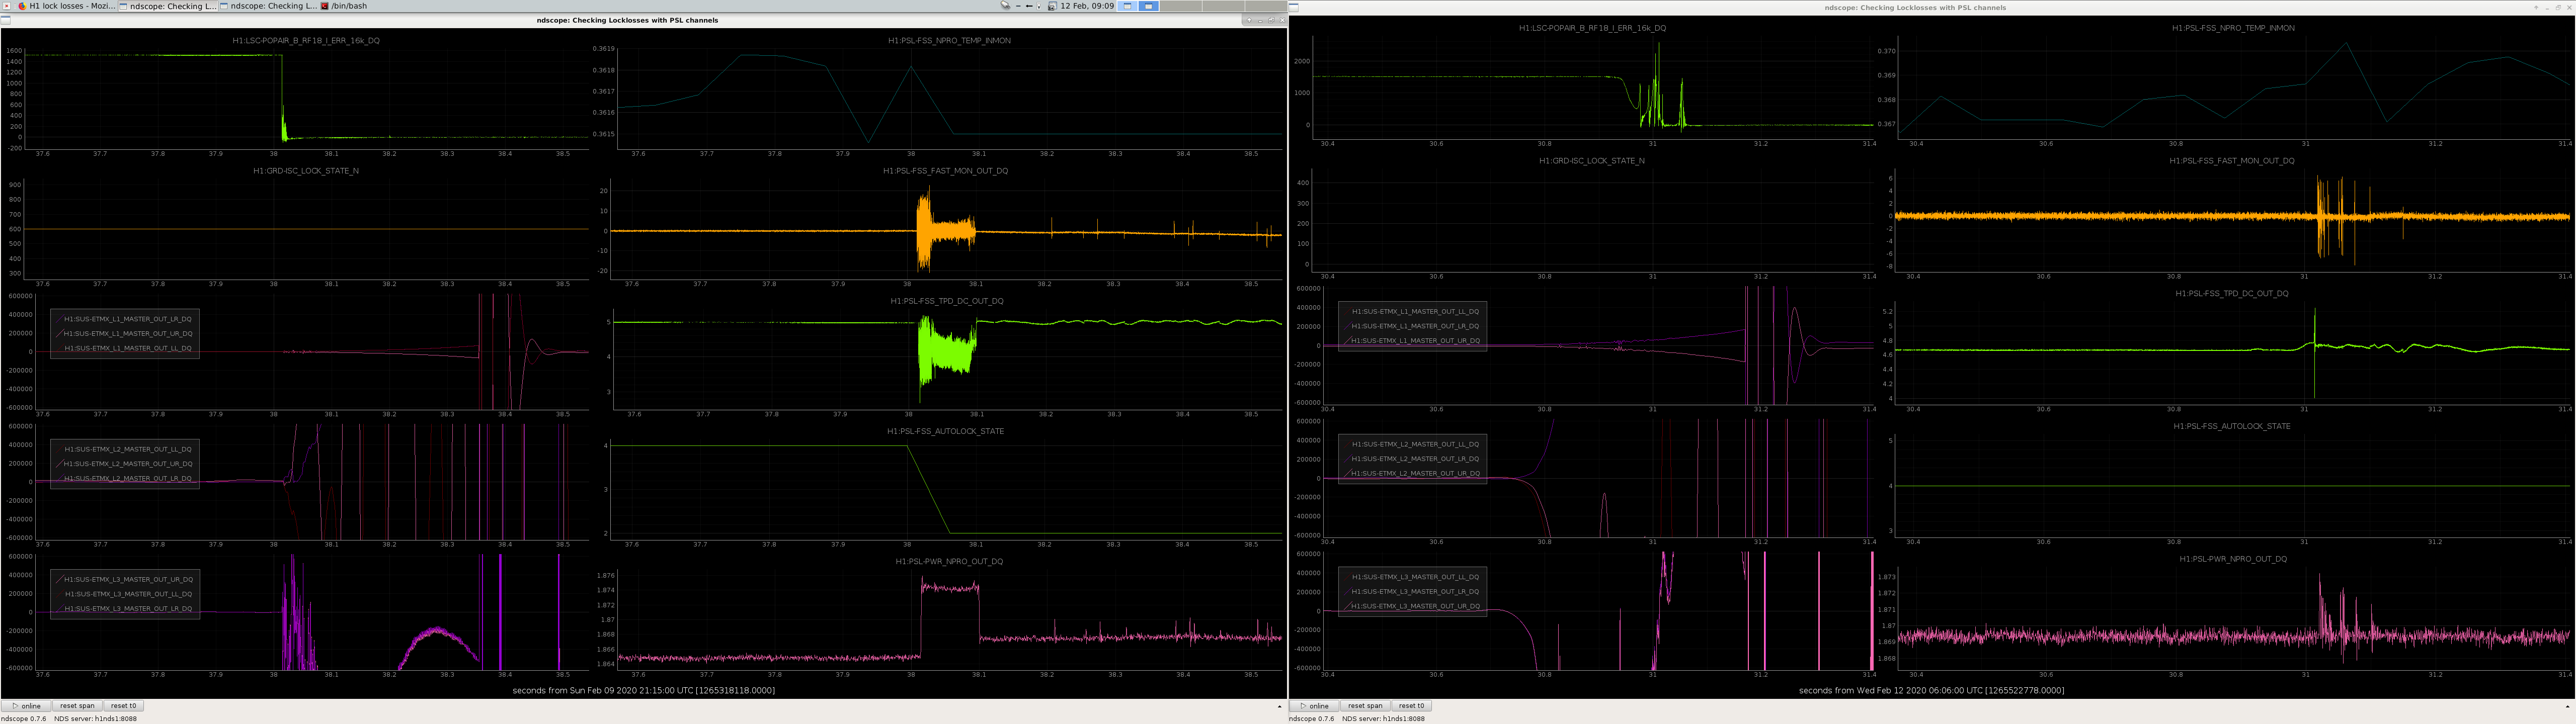
I would suggest that the two lockloss are quite different though. 09 Feb 2020 21:15 UTC being very fast (1ms), but 12 Feb 2020 06:06 UTC actually being relatively slow (40ms with the ETMX suspension signals starting to saturate 200ms before lockloss). This can see from the attached ndscope plots (1 second in length), using the H1:LSC-POPAIR channel for measuring how long the lockloss took and the 3 bottom left plots for ETMX suspention L1, L2, L3.