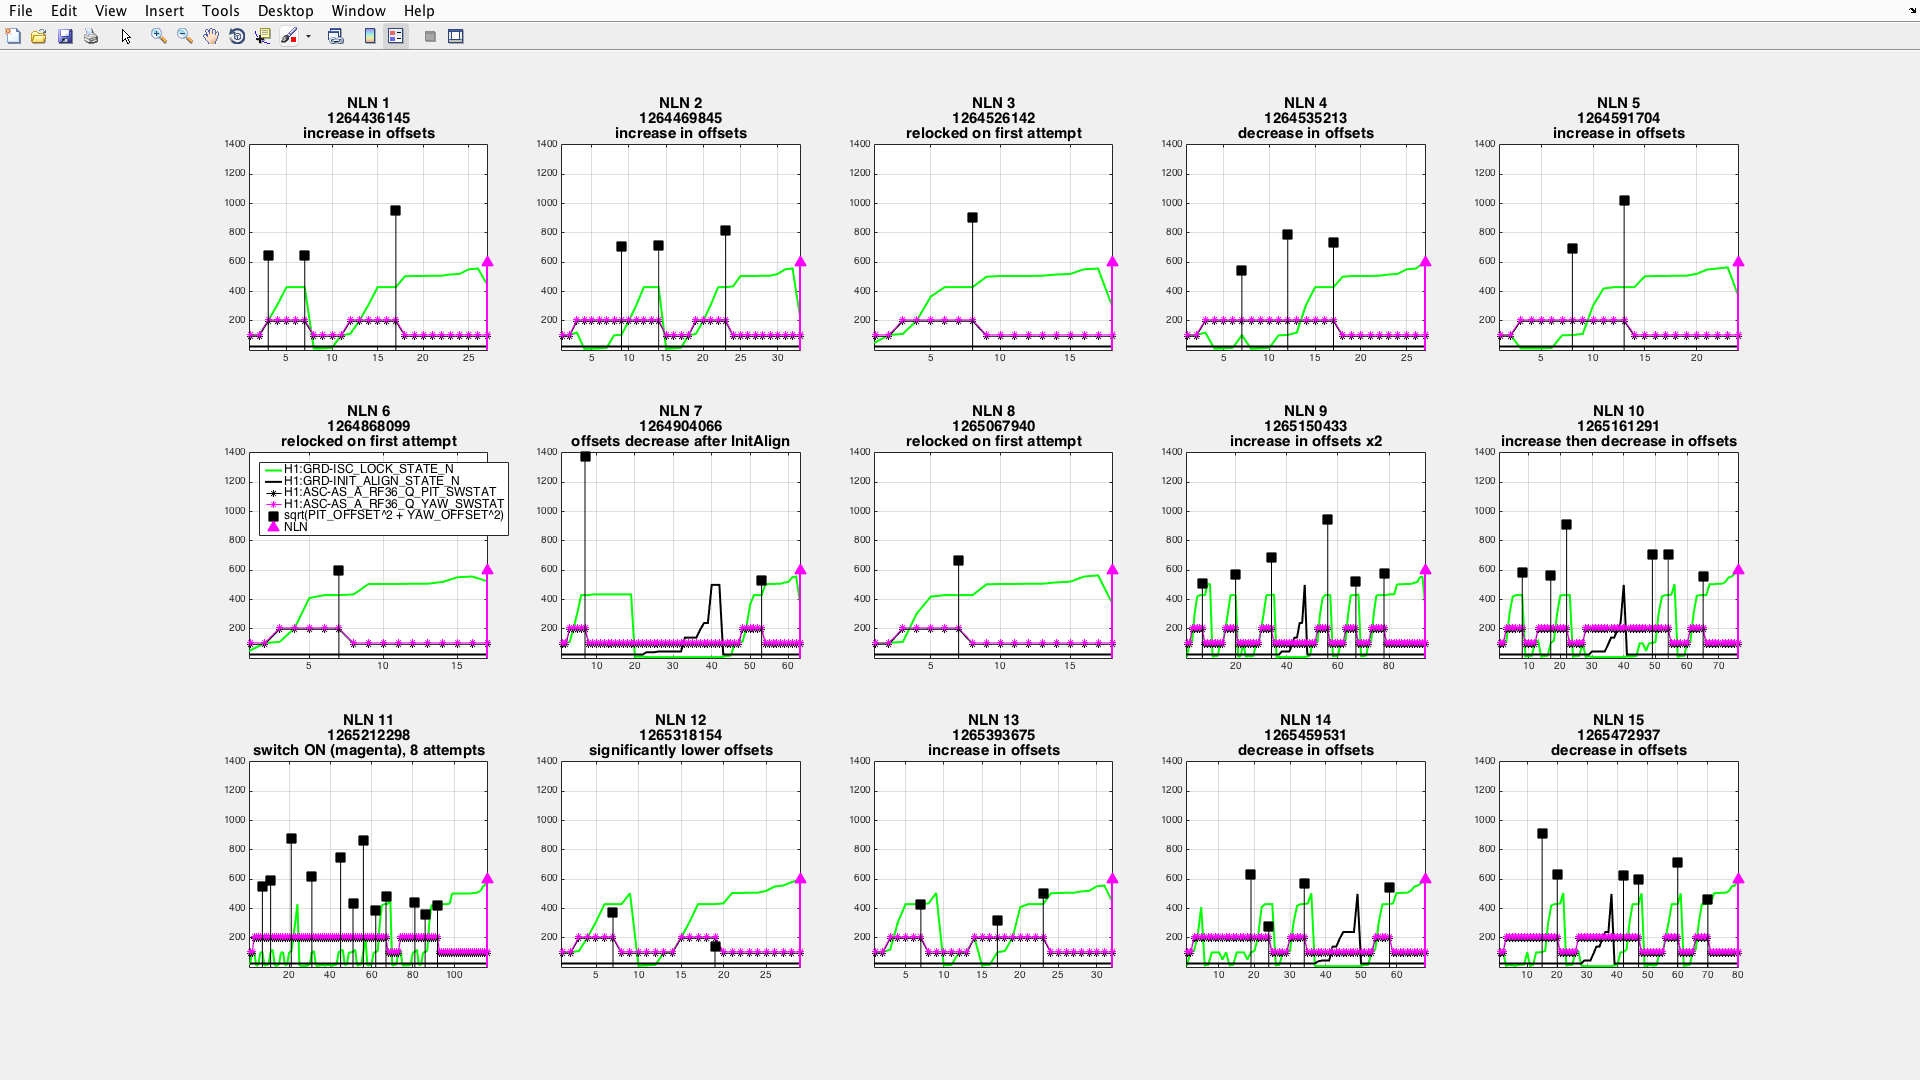
Looking again at H1:ASC-AS_A_RF36_Q_PIT_OFFSET and H1:ASC-AS_A_RF36_Q_YAW_OFFSET, while relocking H1, I've plotted 15 relocks, and instead of plotting pitch and yaw, I've plotted the sqrt(pit^2 +yaw^2), which represents the combined offset required for each relocking sequence that reached ISC_LOCK =110, where the offsets are set.
In the attached plots, I collected data at the interval of 120 seconds from LL (lockloss) to NLN (Nominal Low Noise). Then I reduced the data further, but starting 120 seconds before the first time that the AS_A pitch and yaw offsets were set, and ending at NLN. Any lock atempts that are before the first time that ISC_LOCK reached 110 are not shown, however every lock attempt from the first ISC_LOCK = 110 to NLN is included, so each plot shows continuous data along the X axis, every 120 seconds.
The legend is only on one plot (ugh), so I'm listing it here, and givning more detail, which applies for each of the 15 plots:
- H1:GRD-ISC_LOCK_STATE_N - green solid line
- H1:GRD-INIT_ALIGN_STATE_N - black solid line, data is multiplied by 5, to make the trace easy to see
- H1:ASC-AS_A_RF36_Q_PIT_SWSTAT - black line with astrics, data is divided and shifted by some value to fit plot
- H1:ASC-AS_A_RF36_Q_YAW_SWSTAT - magenta line with astrics, data is divided and shifted by some value to fit plot
- sqrt(PIT_OFFSET^2 + YAW_OFFSET^2) - black solid squares, with vertical black lines
- the black solid square is the last data point before the offsets are set to zero
- NLN - magenta uward pointing solid triangle, with vertical magenta lines
- the magenta triangle is the first data point where ISC_LOCK is at or above 557. The need to select data points that are less than ISC_LOCK = 600 is an artifact of sampling every 120 seconds
- Each NLN was verified by subtracting the START times (GPS start times) for each data point. During relocking the data points are 120 seconds apart, and when H1 reaches NLN and stays in Observing, the difference between the START vlaues is greater than 120 seconds.
In the title of each plot is the NLN number, 1-15, the START time (GPS start time), and a comment about the offsets (black squares), and if they were increasing or decreasing, or the SWSTAT remainded in the "offset ON" for multiple relocking attempts. I didn't collect the OUTPUT AS_A pitch and yaw data for this data set, but have for other data sets, so the SWSTAT is included here just to give a sense of how often it changes, and how often it stays in the ON position.
There are some interesting changes in the offset values, and in particular the change in plot NLN 11, bottom left corner, with a change from before x = 60 to after that is clearly visible, but there is no change to INIT_ALIGN. I could imagine that a manual alignment of one or possibly a few optics is the soure of the change, but I haven't looked into it, so at this point the explanation is unknown.
Even though this data is from a month ago, it has an interesting feature, which is that each row of plots has it's own set of offset values that relocked and made it to NLN:
- the top row: all relocking offset values are at 700 or above
- the middle row: all relocking offset vaues are between 530 and 670
- the bottom row: all relocking offset vaues are below 545, and as low as 140
Charting the max, min, and mean values:
| max | min | mean | |
| top row | 1023 | 734 | 904 |
| middle row | 665 | 523 | 575 |
| bottom row | 541 | 140 | 464 |
This suggests some change that might be possible to track down, and I found this data with no particulare goal in selecting the number of relocks, or when in time, other than within the last 2 months, so it's very possible that all of the data for relocking would have this feature, which could reflect changes that happen on the scale of days to weeks.