To get a better check for quad hysteresis after the idaho EQ, I have started a script which will move the quads slowly in pitch for the next 50 minutes, (starting around 3:20 UTC April). The attached python code can be copied and pasted into a guardian prompt to duplicate this measurement.
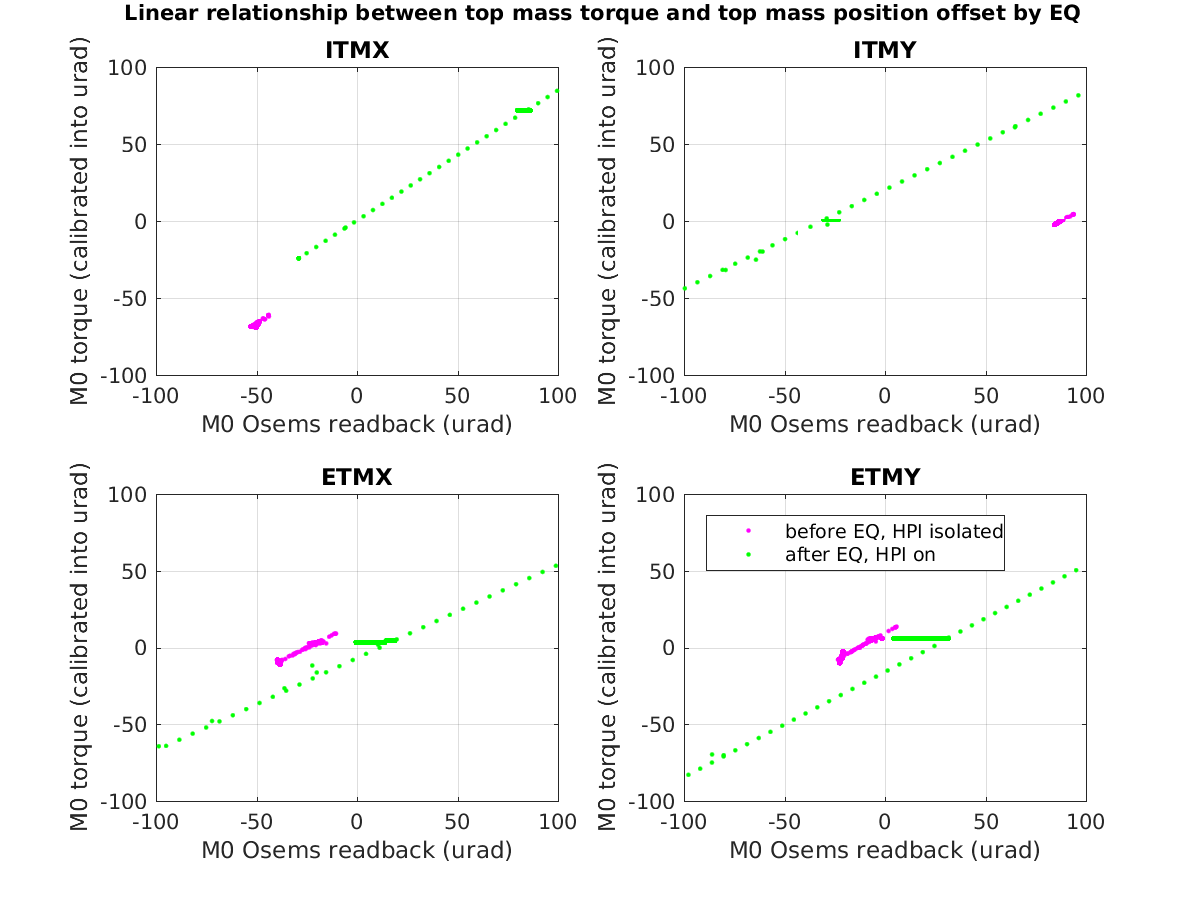
Result: The hysteresis seen in the quad top masses is rather similar from the Idaho EQ to the hysteresis we saw after the Montana EQ in 2017.
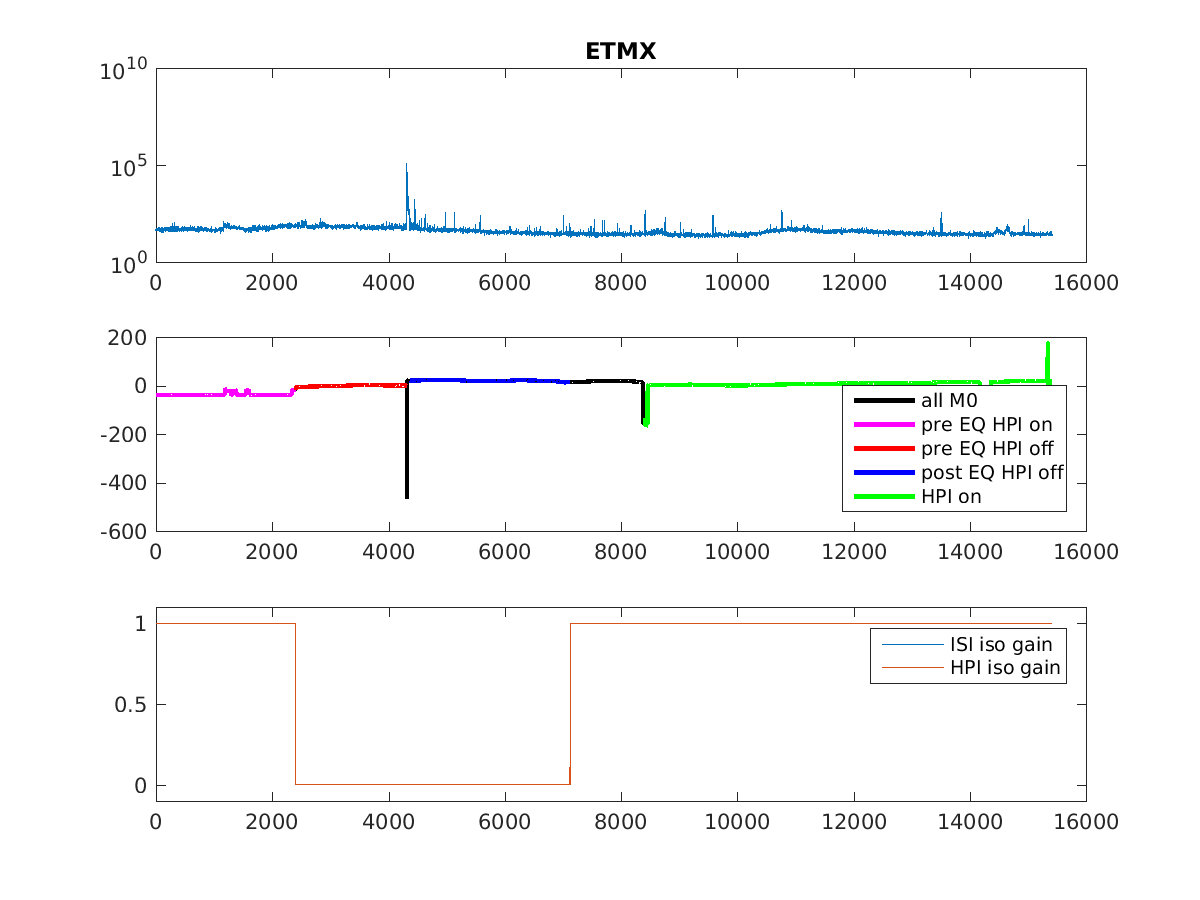
The first attachment is similar to the time series in 55880 but includes at the far left the time this morning when I slowly ramped the opticaliang offset around. To make the second plot easier to read, I am only including 2 sets of data, with HEPI position loops on before and after the EQ. I also fixed a factor of 2 which was missing in both 55880 and in the original version of this script for the Montana EQ 37799. (I had correctly calibrated the torqu applied by F1 into urad of displacement that it creates, but this is a little confusing because this is only half of the pitch drive, I've multiplied by 1 so that the slope of these lines should now be 1).
The shifts listed in this table are just eyeballed, I didn't do any fitting, and the Montana ones I mulitplied by 2 from the original plots to account for the factor of 2 calibration difference.
| approx offset from Idaho EQ | Montana EQ | |
| ITMX | ~20urad | ~ 20 urad |
| ITMY | ~80 urad | ~ 40 urad |
| ETMX | ~ 20 urad | ~ 50 urad |
| ETMY | ~ 30 urad | ~50 urad |