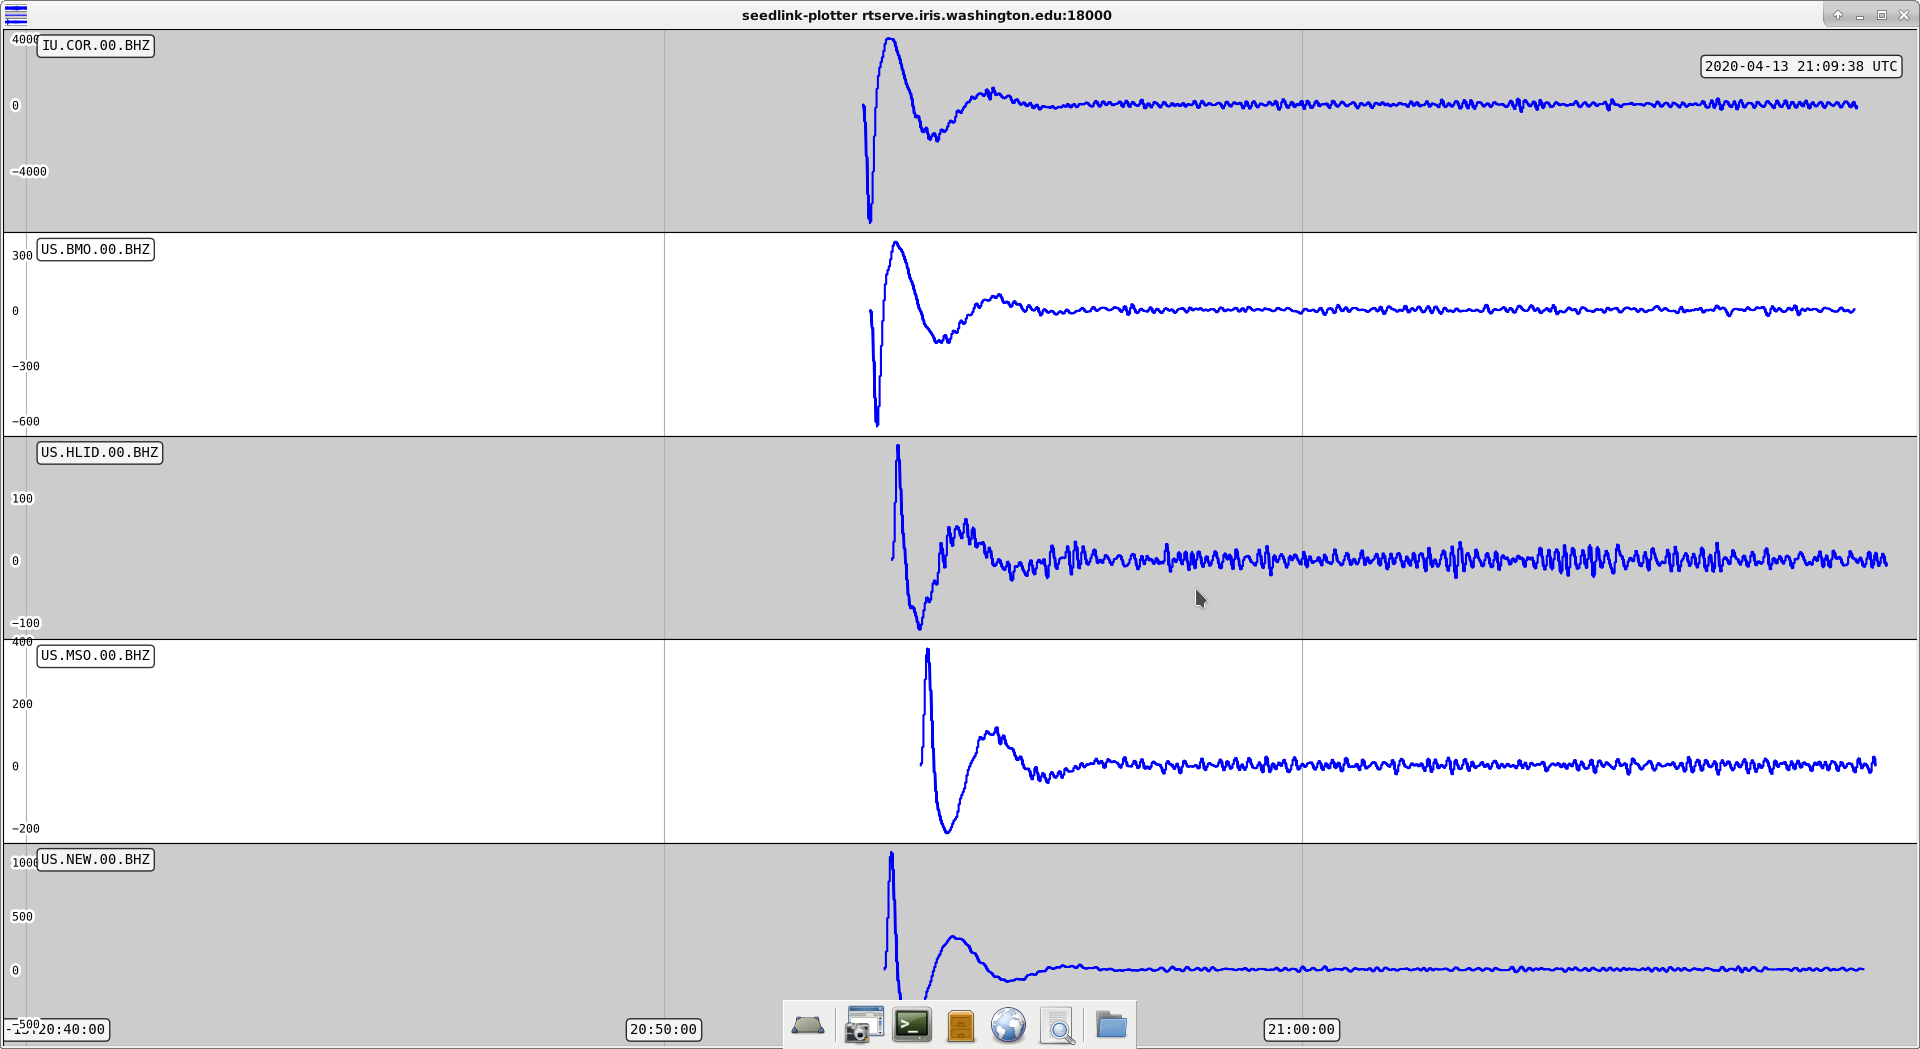
One of the things that SEI/DETCHAR have been working on is developing tools to give more real time early warning for large earthquakes like the Montana and Idaho earthquakes. The USGS has a server network that allows grabbing near real time ground motion data from different sites, so Anne Baer, Grace Johns and Ryan Fisher have been developing an Anaconda package to view eq-band timeseries from different sites. The plot this produces is shown in the attached screen shot. The plot gathers data in 2 second increments and runs like an ndscope, just fewer controls at the moment. I don't think you can scroll through past data or resize in real time. This morning DaveB helped me get this set up to run on an ops machine.
The idea is to monitor ground motion at stations the are between the site and likely earthquakes, hopefully to get a few minutes early warning. SEISMON and the USGS webpage have about a 10 minute lag (depending on where the earthquake is) between the earthquake and the report showing up in the database.
The process I had to go through was:
1. Make an alias in my bashrc by adding this line:
alias setupanaconda="source /opt/rtcds/userapps/release/cds/h1/scripts/setup_anaconda"
Then open a new terminal, run setupanaconda then type:
conda init bash
2. In a new terminal, use the new alias to active conda, then activate Dave's eq_fence environment:
(base) jim.warner@opslogin0:~ 0$ setupanaconda
(base) jim.warner@opslogin0:~ 0$ conda activate eq_fence
You will tell this was successful if (base) on the terminal line is replaced by (eq_fence).
3. Then run the plotter:
(eq_fence) jim.warner@opslogin0:~ 0$ seedlink-plotter -s "IU_COR:00BHZ, US_BMO:00BHZ, US_MSO:00BHZ, US_NEW:00BHZ, US_HLID:00BHZ" -b 30m --seedlink_server "rtserve.iris.washington.edu:18000" --update_time 2s
This will get you a live version of the attached plot. It gathers some data first, and the is a characteristic filter turn on transient for the first ~ minute or so of data, which is shown in the attached screen shot. I'd like to put this up on one of the NUCs so we can try running it for a few days and see if it blows anything up.
Also, this script pulls data from USGS servers, so we maybe don't want a dozen people just running this.