Tonight I found MC1 M1 T2 and T3 scales maxed out on the scale on the SUS Saturations medm, which looks at H1:SUS-MC1_M1_MASTER_OUT_(T2/T3)MON. These two channels were approx. +/- 40K. I looked at the OSEM IN channels and found T3 OSEM IN oscillating by about 1000 counts, peak to peak, which was much larger than the other OSEMS. I checked SDF, there were no channel diffs, I put the optic in DAMPED and SAFE, and back to ALIGNED and the oscillations returned. I'm leaving MC1 in SAFE MODE for the rest of the night.
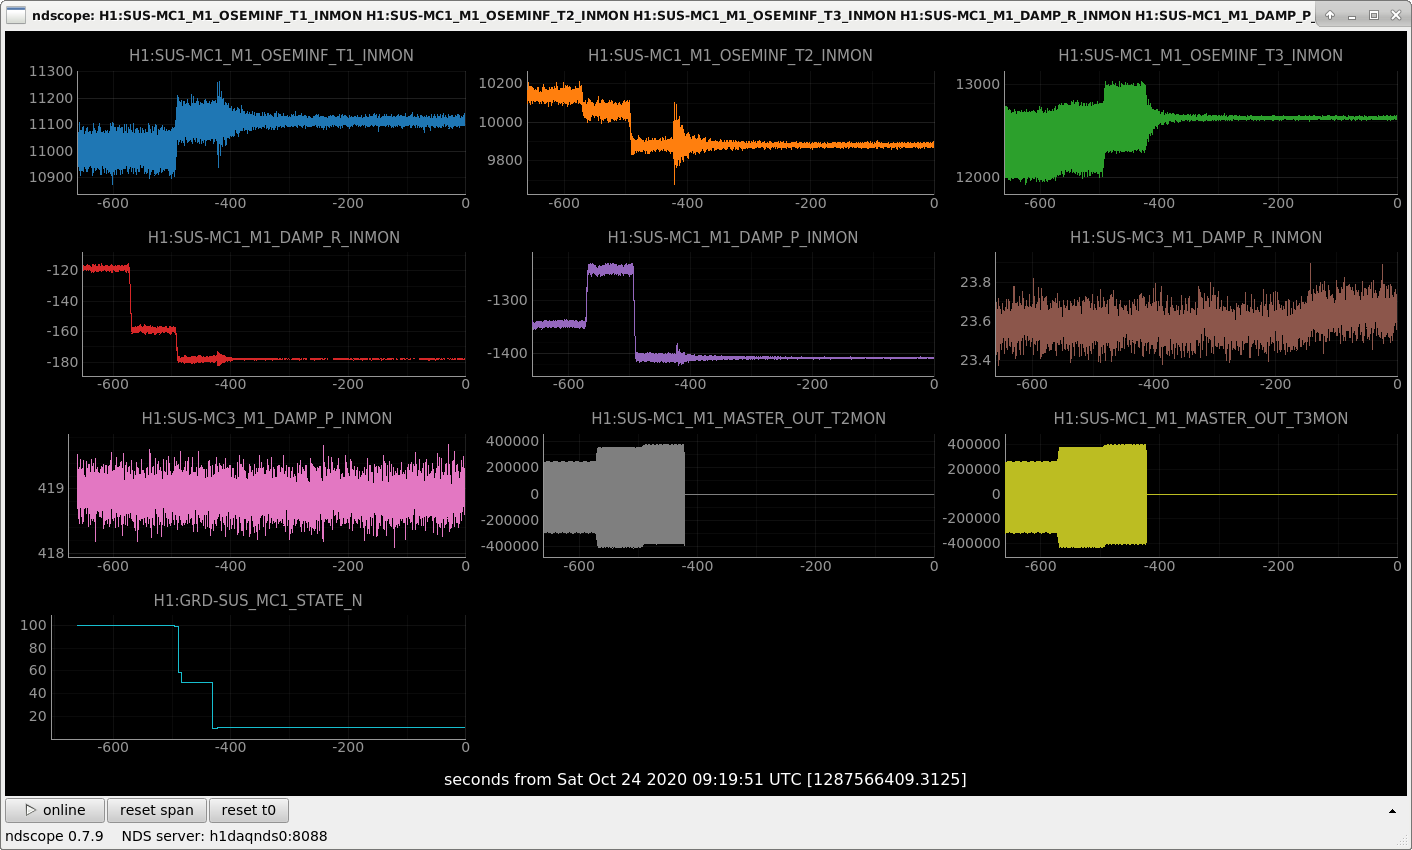
Attached: a plot of MC1 transitioning from ALIGNED to DAMPED to SAFE. Left side of the plot shows the oscillations, the right sid shows the optic in SAFE MODE.
I'll also send an email since tomorrow is Saturday
Corey has put MC1 back into "Aligned" and the oscillations have not returned this morning. Edit: the oscillations are back
It looks like all of the osems have sensible readings, none of them are near the edge of their range now and none were on Friday before the oscillations started. The only suspicous thing that we have seen is that there were some glitches in the damping loops at around 17 UTC on Friday, 3 hours before the oscilations and railing of some osems started.
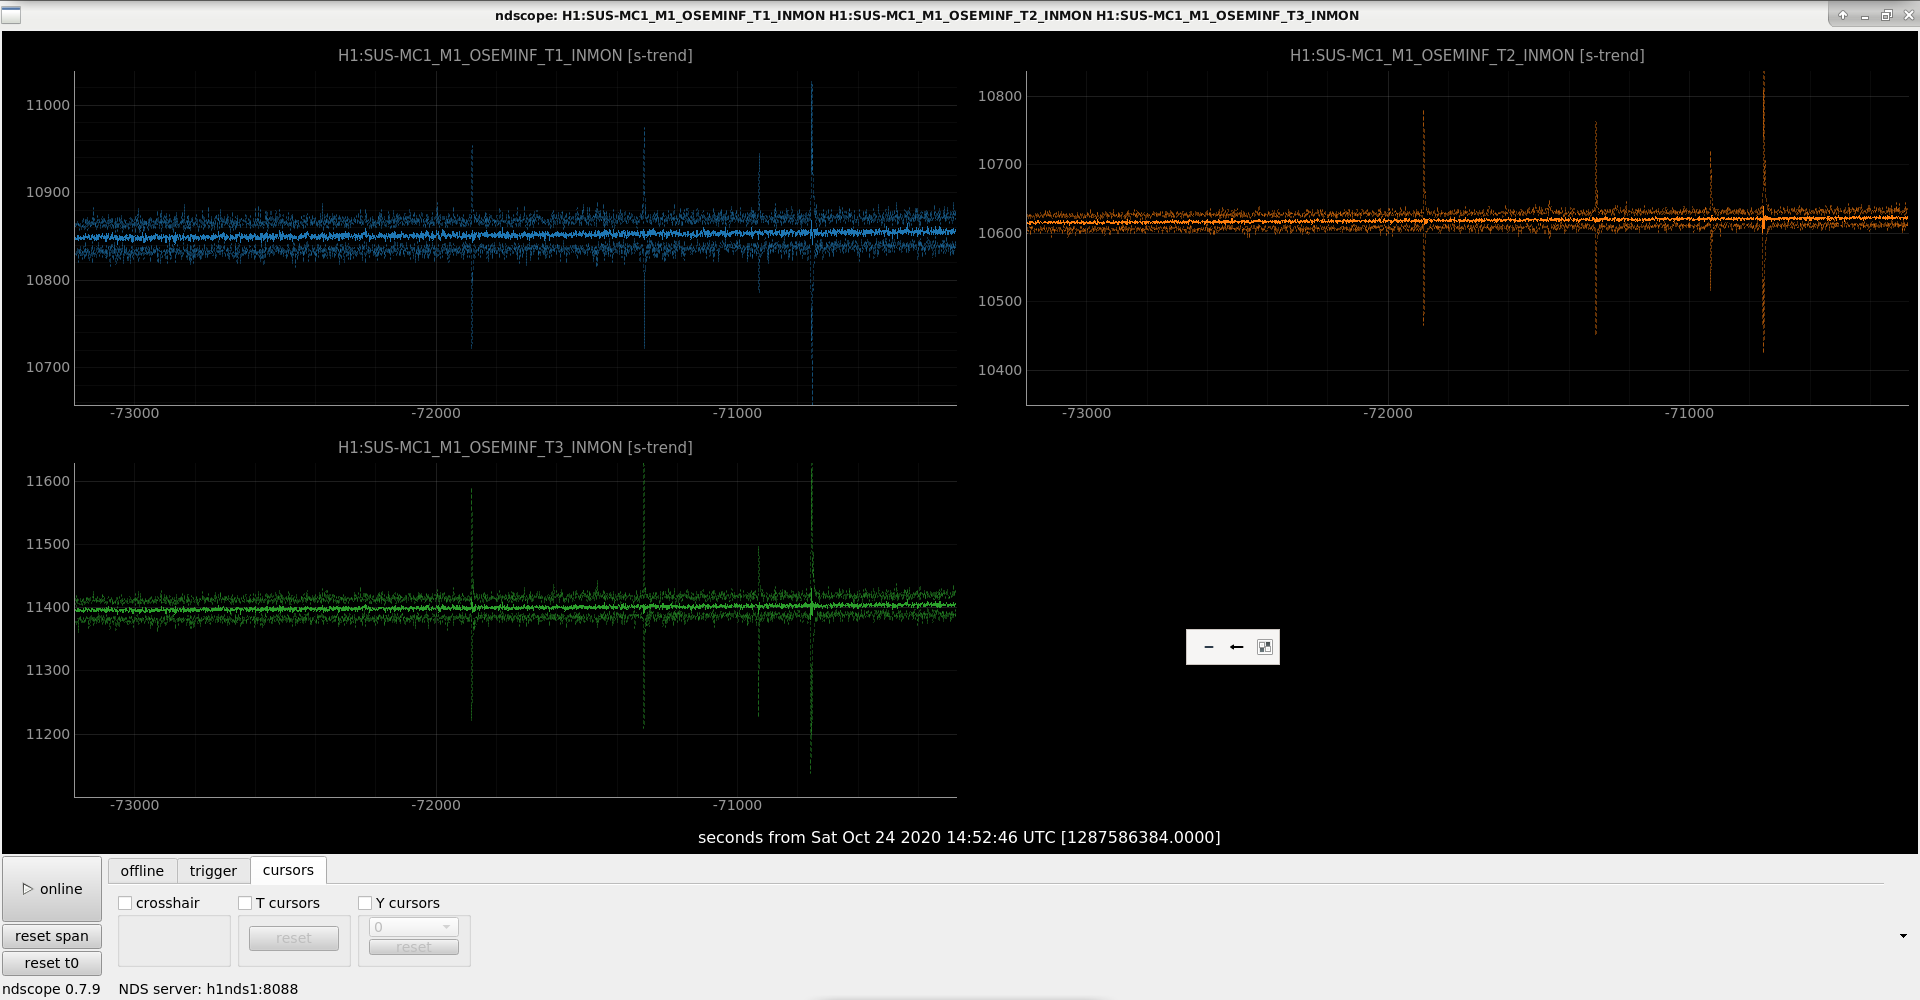
Sheila requested me to look for the ndscope trends for the osem glitches before the SUS was put on SAFE state. Based on the plot attached, I found that T1, T2, and T3 were glitching around 1853 UTC (23 Oct 2020) - I will look into the details once I reach home (currently at site).

Adding a zoomed (seconds trend) in ndscope plot for T1, T2 and T3 top mass osem for MC1, time 18.54 UTC (23 Oct 2020). All the glicthes seen over here are similar in size (peak to peak amplitude), which is different from a similar issue (with MC1 and MC3 top mass OSEMs) observed in May 2019.